Christchurch Airbnb Market Analysis 2025: Short Term Rental Data & Vacation Rental Statistics in England, United Kingdom
Is Airbnb profitable in Christchurch in 2025? Explore comprehensive Airbnb analytics for Christchurch, England, United Kingdom to uncover income potential. This 2025 STR market report for Christchurch, based on AirROI data from April 2024 to March 2025, reveals key trends in the niche market of 187 active listings.
Whether you're considering an Airbnb investment in Christchurch, optimizing your existing vacation rental, or exploring rental arbitrage opportunities, understanding the Christchurch Airbnb data is crucial. Leveraging the low regulation environment is key to maximizing your short term rental income potential. Let's dive into the specifics.
Key Christchurch Airbnb Performance Metrics Overview
Monthly Airbnb Revenue Variations & Income Potential in Christchurch (2025)
Understanding the monthly revenue variations for Airbnb listings in Christchurch is key to maximizing your short term rental income potential. Seasonality significantly impacts earnings. Our analysis, based on data from the past 12 months, shows that the peak revenue month for STRs in Christchurch is typically May, while January often presents the lowest earnings, highlighting opportunities for strategic pricing adjustments during shoulder and low seasons. Explore the typical Airbnb income in Christchurch across different performance tiers:
- Best-in-class properties (Top 10%) achieve $6,335+ monthly, often utilizing dynamic pricing and superior guest experiences.
- Strong performing properties (Top 25%) earn $3,853 or more, indicating effective management and desirable locations/amenities.
- Typical properties (Median) generate around $2,234 per month, representing the average market performance.
- Entry-level properties (Bottom 25%) see earnings around $1,140, often with potential for optimization.
Average Monthly Airbnb Earnings Trend in Christchurch
Christchurch Airbnb Occupancy Rate Trends (2025)
Maximize your bookings by understanding the Christchurch STR occupancy trends. Seasonal demand shifts significantly influence how often properties are booked. Typically, Augustsees the highest demand (peak season occupancy), while January experiences the lowest (low season). Effective strategies, like adjusting minimum stays or offering promotions, can boost occupancy during slower periods. Here's how different property tiers perform in Christchurch:
- Best-in-class properties (Top 10%) achieve 78%+ occupancy, indicating high desirability and potentially optimized availability.
- Strong performing properties (Top 25%) maintain 60% or higher occupancy, suggesting good market fit and guest satisfaction.
- Typical properties (Median) have an occupancy rate around 37%.
- Entry-level properties (Bottom 25%) average 18% occupancy, potentially facing higher vacancy.
Average Monthly Occupancy Rate Trend in Christchurch
Average Daily Rate (ADR) Airbnb Trends in Christchurch (2025)
Effective short term rental pricing strategy in Christchurch involves understanding monthly ADR fluctuations. The Average Daily Rate (ADR) for Airbnb in Christchurch typically peaks in August and dips lowest during March. Leveraging Airbnb dynamic pricing tools or strategies based on this seasonality can significantly boost revenue. Here's a look at the typical nightly rates achieved:
- Best-in-class properties (Top 10%) command rates of $513+ per night, often due to premium features or locations.
- Strong performing properties (Top 25%) achieve nightly rates of $324 or more.
- Typical properties (Median) charge around $204 per night.
- Entry-level properties (Bottom 25%) earn around $120 per night.
Average Daily Rate (ADR) Trend by Month in Christchurch
Get Live Christchurch Market Intelligence 👇

Explore Real-time Analytics
Airbnb Seasonality Analysis & Trends in Christchurch (2025)
Peak Season (May, August, June)
- Revenue averages $4,640 per month
- Occupancy rates average 49.3%
- Daily rates average $266
Shoulder Season
- Revenue averages $2,868 per month
- Occupancy maintains around 40.9%
- Daily rates hold near $260
Low Season (January, February, March)
- Revenue drops to average $1,647 per month
- Occupancy decreases to average 32.7%
- Daily rates adjust to average $246
Seasonality Insights for Christchurch
- The Airbnb seasonality in Christchurch shows highly seasonal trends requiring careful strategy. While the sections above show seasonal averages, it's also insightful to look at the extremes:
- During the high season, the absolute peak month showcases Christchurch's highest earning potential, with monthly revenues capable of climbing to $4,752, occupancy reaching a high of 60.3%, and ADRs peaking at $271.
- Conversely, the slowest single month of the year, typically falling within the low season, marks the market's lowest point. In this month, revenue might dip to $1,611, occupancy could drop to 31.0%, and ADRs may adjust down to $245.
- Understanding both the seasonal averages and these monthly peaks and troughs in revenue, occupancy, and ADR is crucial for maximizing your Airbnb profit potential in Christchurch.
Seasonal Strategies for Maximizing Profit
- Peak Season: Maximize revenue through premium pricing and potentially longer minimum stays. Ensure high availability.
- Low Season: Offer competitive pricing, special promotions (e.g., extended stay discounts), and flexible cancellation policies. Target off-season travelers like remote workers or budget-conscious guests.
- Shoulder Seasons: Implement dynamic pricing that balances peak and low rates. Target weekend travelers or specific events. Offer slightly more flexible terms than peak season.
- Regularly analyze your own performance against these Christchurch seasonality benchmarks and adjust your pricing and availability strategy accordingly.
Best Areas for Airbnb Investment in Christchurch (2025)
Exploring the top neighborhoods for short-term rentals in Christchurch? This section highlights key areas, outlining why they are attractive for hosts and guests, along with notable local attractions. Consider these locations based on your target guest profile and investment strategy.
| Neighborhood / Area | Why Host Here? (Target Guests & Appeal) | Key Attractions & Landmarks |
|---|---|---|
| Central Christchurch | The hub of the city, home to many shops, restaurants, and attractions. Ideal for tourists wanting to experience the city's vibrant culture and history, along with easy access to public transport. | Christchurch Cathedral, Quake City, The Cardboard Cathedral, Victoria Square, Dux Dine |
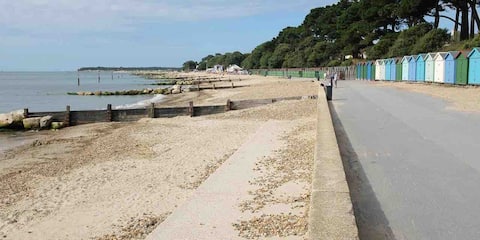
| Sumner | A coastal suburb with stunning beaches and a laid-back atmosphere. Perfect for visitors looking for seaside relaxation, surf, and outdoor activities. | Sumner Beach, Scarborough Hill, The Cave Rock, Sumner Life Saving Club, The Pines Beach |
| Lyttelton | A charming port town with a rich maritime history. Attracts tourists who enjoy quaint towns with beautiful harbors and hiking trails. | Lyttelton Harbour, Godley Head Walkway, Lyttelton Farmers' Market, Port Hills, Café culture |
| Merivale | An upscale neighborhood with boutique shopping, fine dining, and proximity to Hagley Park. Attractive to those looking for luxury stays. | Hagley Park, Merivale Mall, Papanui Road dining, Parks and Gardens, Christchurch Casino |
| Cashmere | Known for its beautiful views and access to nature, including the Port Hills. Great for travelers who enjoy outdoor activities such as hiking and biking. | Cashmere Hills, Christchurch Adventure Park, The Sign of the Kiwi, Schnapps Bar, Nature walks |
| Riccarton | A vibrant suburb known for its shopping and dining options, as well as being near the University of Canterbury. Ideal for students and families. | Westfield Riccarton, Riccarton Bush, University of Canterbury, Botanic Gardens, Dining and cafés |
| New Brighton | A popular beach destination with a family-friendly atmosphere, known for its long pier and recreational activities. Perfect for summer vacations. | New Brighton Beach, New Brighton Pier, Heathcote River, New Brighton Market, Beach Volleyball |
| Rolleston | A rapidly growing area just outside of Christchurch, ideal for families and business travelers seeking a quieter setting with good amenities. | Rolleston Sports Centre, Parks and open spaces, Shopping centers, Local cafés, Proximity to Christchurch city |
Understanding Airbnb License Requirements & STR Laws in Christchurch (2025)
While Christchurch, England, United Kingdom currently shows low STR regulations, specific Airbnb license requirements might still exist or change. Always verify the latest short term rental regulations and Airbnb license requirements directly with local government authorities for Christchurch to ensure full compliance before hosting.
(Source: AirROI data, 2025, finding no licensed listings among those analyzed)
Top Performing Airbnb Properties in Christchurch (2025)
Benchmark your potential! Explore examples of top-performing Airbnb properties in Christchurchbased on Trailing Twelve Month (TTM) revenue. Analyze their characteristics, revenue, occupancy rate, and ADR to understand what drives success in this market.

"Chime House" quirky period property by the sea
Entire Place • 6 bedrooms
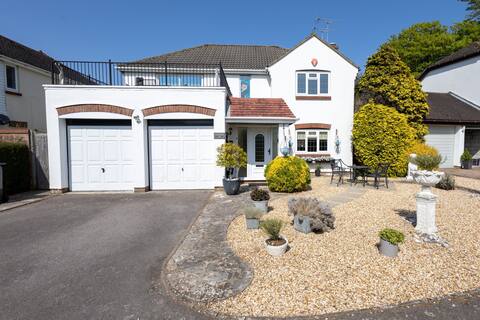
The Best Harbour View in Mudeford - Shell Yes!
Entire Place • 4 bedrooms

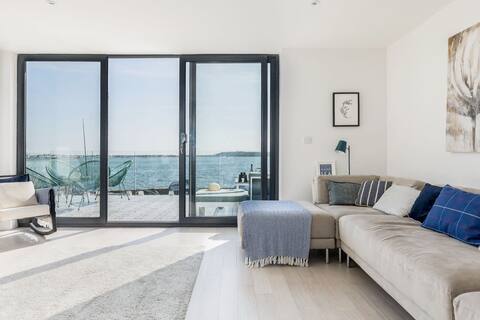
The Beach House
Entire Place • 3 bedrooms
'Raggleswood' - by the seaside in Mudeford
Entire Place • 4 bedrooms
Bay Tree House. Large Mudeford Holiday Residence
Entire Place • 4 bedrooms
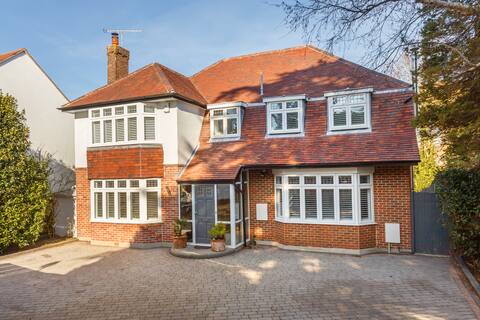
Gorgeous modern chic mudeford house
Entire Place • 4 bedrooms
Note: Performance varies based on location, size, amenities, seasonality, and management quality. Data reflects the past 12 months.
Top Performing Airbnb Hosts in Christchurch (2025)
Learn from the best! This table showcases top-performing Airbnb hosts in Christchurch based on the number of properties managed and estimated total revenue over the past year. Analyze their scale and performance metrics.
| Host Name | Properties | Grossing Revenue | Stay Reviews | Avg Rating |
|---|---|---|---|---|
| Ian | 25 | $633,362 | 349 | 4.50/5.0 |
| Candice | 7 | $365,673 | 69 | 4.23/5.0 |
| Christchurch Bay Coastal Escap | 7 | $344,187 | 258 | 4.96/5.0 |
| Sarah | 1 | $143,893 | 47 | 4.96/5.0 |
| Matthew | 3 | $135,233 | 245 | 4.90/5.0 |
| Bournecoast Holiday Agents | 8 | $131,863 | 87 | 3.56/5.0 |
| Caroline | 2 | $114,707 | 39 | 4.83/5.0 |
| Lois | 1 | $82,303 | 32 | 4.91/5.0 |
| Host #111310192 | 1 | $81,664 | 61 | 4.77/5.0 |
| Bond Holiday Lets | 2 | $78,535 | 14 | 4.69/5.0 |
Analyzing the strategies of top hosts, such as their property selection, pricing, and guest communication, can offer valuable lessons for optimizing your own Airbnb operations in Christchurch.
Dive Deeper: Advanced Christchurch STR Market Data (2025)
Ready to unlock more insights? AirROI provides access to advanced metrics and comprehensive Airbnb data for Christchurch. Explore detailed analytics beyond this report to refine your investment strategy, optimize pricing, and maximize your vacation rental profits.
Explore Advanced MetricsChristchurch Short-Term Rental Market Composition (2025): Property & Room Types
Room Type Distribution
Property Type Distribution
Market Composition Insights for Christchurch
- The Christchurch Airbnb market composition is heavily skewed towards Entire Home/Apt listings, which make up 91.4% of the 187 active rentals. This indicates strong guest preference for privacy and space.
- Looking at the property type distribution in Christchurch, House properties are the most common (69%), reflecting the local real estate landscape.
- Houses represent a significant 69% portion, catering likely to families or larger groups.
- The presence of 6.4% Hotel/Boutique listings indicates integration with traditional hospitality.
- Smaller segments like outdoor/unique, unique stays (combined 2.6%) offer potential for unique stay experiences.
Christchurch Airbnb Room Capacity Analysis (2025): Bedroom Distribution
Distribution of Listings by Number of Bedrooms
Room Capacity Insights for Christchurch
- The dominant room capacity in Christchurch is 2 bedrooms listings, making up 33.7% of the market. This suggests a strong demand for properties suitable for couples or solo travelers.
- Together, 2 bedrooms and 1 bedroom properties represent 63.6% of the active Airbnb listings in Christchurch, indicating a high concentration in these sizes.
- A significant 28.9% of listings offer 3+ bedrooms, catering to larger groups and families seeking more space in Christchurch.
Christchurch Vacation Rental Guest Capacity Trends (2025)
Distribution of Listings by Guest Capacity
Guest Capacity Insights for Christchurch
- The most common guest capacity trend in Christchurch vacation rentals is listings accommodating 4 guests (35.3%). This suggests the primary traveler segment is likely small families or groups.
- Properties designed for 4 guests and 2 guests dominate the Christchurch STR market, accounting for 57.8% of listings.
- 27.8% of properties accommodate 6+ guests, serving the market segment for larger families or group travel in Christchurch.
- On average, properties in Christchurch are equipped to host 4.2 guests.
Christchurch Airbnb Booking Patterns (2025): Available vs. Booked Days
Available Days Distribution
Booked Days Distribution
Booking Pattern Insights for Christchurch
- The most common availability pattern in Christchurch falls within the 271-366 days range, representing 47.1% of listings. This suggests many properties have significant open periods on their calendars.
- Approximately 75.4% of listings show high availability (181+ days open annually), indicating potential for increased bookings or specific owner usage patterns.
- For booked days, the 91-180 days range is most frequent in Christchurch (28.9%), reflecting common guest stay durations or potential owner blocking patterns.
- A notable 26.2% of properties secure long booking periods (181+ days booked per year), highlighting successful long-term rental strategies or significant owner usage.
Christchurch Airbnb Minimum Stay Requirements Analysis
Distribution of Listings by Minimum Night Requirement
1 Night
32 listings
18.2% of total
2 Nights
69 listings
39.2% of total
3 Nights
28 listings
15.9% of total
4-6 Nights
17 listings
9.7% of total
7-29 Nights
5 listings
2.8% of total
30+ Nights
25 listings
14.2% of total
Key Insights
- The most prevalent minimum stay requirement in Christchurch is 2 Nights, adopted by 39.2% of listings. This highlights the market's preference for shorter, flexible bookings.
- A significant segment (14.2%) caters to monthly stays (30+ nights) in Christchurch, pointing to opportunities in the extended-stay market.
Recommendations
- Align with the market by considering a 2 Nights minimum stay, as 39.2% of Christchurch hosts use this setting.
- If feasible, allowing 1-night stays, especially midweek or during low season, could capture last-minute bookings, as only 18.2% currently do.
- A 2-night minimum appears standard (39.2%). Consider this for weekends or peak periods.
- Explore offering discounts for stays of 30+ nights to attract the 14.2% of the market seeking extended stays.
- Adjust minimum nights based on seasonality – potentially shorter during low season and longer during peak demand periods in Christchurch.
Christchurch Airbnb Cancellation Policy Trends Analysis (2025)
Super Strict 30 Days
2 listings
1.2% of total
Super Strict 60 Days
7 listings
4.3% of total
Flexible
29 listings
17.8% of total
Moderate
36 listings
22.1% of total
Firm
35 listings
21.5% of total
Strict
54 listings
33.1% of total
Cancellation Policy Insights for Christchurch
- The prevailing Airbnb cancellation policy trend in Christchurch is Strict, used by 33.1% of listings.
- A majority (54.6%) of hosts in Christchurch utilize Firm or Strict policies, indicating a market where hosts prioritize booking security.
Recommendations for Hosts
- Consider adopting a Strict policy to align with the 33.1% market standard in Christchurch.
- With 33.1% using Strict terms, this is a viable option in Christchurch, particularly for high-value properties or during peak demand periods.
- Regularly review your cancellation policy against competitors and market demand shifts in Christchurch.
Christchurch STR Booking Lead Time Analysis (2025)
Average Booking Lead Time by Month
Booking Lead Time Insights for Christchurch
- The overall average booking lead time for vacation rentals in Christchurch is 59 days.
- Guests book furthest in advance for stays during July (average 99 days), likely coinciding with peak travel demand or local events.
- The shortest booking windows occur for stays in February (average 33 days), indicating more last-minute travel plans during this time.
- Seasonally, Summer (86 days avg.) sees the longest lead times, while Winter (46 days avg.) has the shortest, reflecting typical travel planning cycles.
Recommendations for Hosts
- Use the overall average lead time (59 days) as a baseline for your pricing and availability strategy in Christchurch.
- For July stays, consider implementing length-of-stay discounts or slightly higher rates for bookings made less than 99 days out to capitalize on advance planning.
- Target marketing efforts for the Summer season well in advance (at least 86 days) to capture early planners.
- Monitor your own booking lead times against these Christchurch averages to identify opportunities for dynamic pricing adjustments.
Popular & Essential Airbnb Amenities in Christchurch (2025)
Amenity Prevalence
Amenity Insights for Christchurch
- Essential amenities in Christchurch that guests expect include: Heating, Wifi, TV, Smoke alarm. Lacking these (any) could significantly impact bookings.
- Popular amenities like Hot water, Kitchen, Dishes and silverware are common but not universal. Offering these can provide a competitive edge.
Recommendations for Hosts
- Ensure your listing includes all essential amenities for Christchurch: Heating, Wifi, TV, Smoke alarm.
- Prioritize adding missing essentials: Heating, Wifi, TV, Smoke alarm.
- Consider adding popular differentiators like Hot water or Kitchen to increase appeal.
- Highlight unique or less common amenities you offer (e.g., hot tub, dedicated workspace, EV charger) in your listing description and photos.
- Regularly check competitor amenities in Christchurch to stay competitive.
Christchurch Airbnb Guest Demographics & Profile Analysis (2025)
Guest Profile Summary for Christchurch
- The typical guest profile for Airbnb in Christchurch consists of primarily domestic travelers (92%), often arriving from nearby England, typically belonging to the Post-2000s (Gen Z/Alpha) group (50%), primarily speaking English or French.
- Domestic travelers account for 92.3% of guests.
- Key international markets include United Kingdom (92.3%) and United States (1.5%).
- Top languages spoken are English (73.3%) followed by French (6.5%).
- A significant demographic segment is the Post-2000s (Gen Z/Alpha) group, representing 50% of guests.
Recommendations for Hosts
- Target domestic marketing efforts towards travelers from England and London.
- Tailor amenities and listing descriptions to appeal to the dominant Post-2000s (Gen Z/Alpha) demographic (e.g., highlight fast WiFi, smart home features, local guides).
- Highlight unique local experiences or amenities relevant to the primary guest profile.
- Consider seasonal promotions aligned with peak travel times for key origin markets.
Nearby Short-Term Rental Market Comparison
How does the Christchurch Airbnb market stack up against its neighbors? Compare key performance metrics like average monthly revenue, ADR, and occupancy rates in surrounding areas to understand the broader regional STR landscape.
| Market | Active Properties | Monthly Revenue | Daily Rate | Avg. Occupancy |
|---|---|---|---|---|
| Englishcombe | 13 | $8,558 | $573.69 | 49% |
| Dorney | 12 | $8,335 | $622.48 | 45% |
| Chew Magna | 14 | $6,649 | $399.59 | 46% |
| Lambourn | 11 | $6,081 | $669.47 | 28% |
| City of Westminster | 1,327 | $6,043 | $486.66 | 52% |
| Long Sutton | 17 | $5,726 | $383.88 | 46% |
| Stoke St. Michael | 10 | $5,277 | $424.04 | 42% |
| Winsham | 10 | $5,154 | $484.22 | 52% |
| Oldland Common | 13 | $5,093 | $355.47 | 43% |
| Wraysbury | 14 | $4,719 | $396.18 | 46% |