Cheshire East Airbnb Market Analysis 2025: Short Term Rental Data & Vacation Rental Statistics in England, United Kingdom
Is Airbnb profitable in Cheshire East in 2025? Explore comprehensive Airbnb analytics for Cheshire East, England, United Kingdom to uncover income potential. This 2025 STR market report for Cheshire East, based on AirROI data from April 2024 to March 2025, reveals key trends in the niche market of 24 active listings.
Whether you're considering an Airbnb investment in Cheshire East, optimizing your existing vacation rental, or exploring rental arbitrage opportunities, understanding the Cheshire East Airbnb data is crucial. Leveraging the low regulation environment is key to maximizing your short term rental income potential. Let's dive into the specifics.
Key Cheshire East Airbnb Performance Metrics Overview
Monthly Airbnb Revenue Variations & Income Potential in Cheshire East (2025)
Understanding the monthly revenue variations for Airbnb listings in Cheshire East is key to maximizing your short term rental income potential. Seasonality significantly impacts earnings. Our analysis, based on data from the past 12 months, shows that the peak revenue month for STRs in Cheshire East is typically December, while January often presents the lowest earnings, highlighting opportunities for strategic pricing adjustments during shoulder and low seasons. Explore the typical Airbnb income in Cheshire East across different performance tiers:
- Best-in-class properties (Top 10%) achieve $6,603+ monthly, often utilizing dynamic pricing and superior guest experiences.
- Strong performing properties (Top 25%) earn $3,112 or more, indicating effective management and desirable locations/amenities.
- Typical properties (Median) generate around $1,790 per month, representing the average market performance.
- Entry-level properties (Bottom 25%) see earnings around $1,016, often with potential for optimization.
Average Monthly Airbnb Earnings Trend in Cheshire East
Cheshire East Airbnb Occupancy Rate Trends (2025)
Maximize your bookings by understanding the Cheshire East STR occupancy trends. Seasonal demand shifts significantly influence how often properties are booked. Typically, Augustsees the highest demand (peak season occupancy), while April experiences the lowest (low season). Effective strategies, like adjusting minimum stays or offering promotions, can boost occupancy during slower periods. Here's how different property tiers perform in Cheshire East:
- Best-in-class properties (Top 10%) achieve 77%+ occupancy, indicating high desirability and potentially optimized availability.
- Strong performing properties (Top 25%) maintain 58% or higher occupancy, suggesting good market fit and guest satisfaction.
- Typical properties (Median) have an occupancy rate around 42%.
- Entry-level properties (Bottom 25%) average 24% occupancy, potentially facing higher vacancy.
Average Monthly Occupancy Rate Trend in Cheshire East
Average Daily Rate (ADR) Airbnb Trends in Cheshire East (2025)
Effective short term rental pricing strategy in Cheshire East involves understanding monthly ADR fluctuations. The Average Daily Rate (ADR) for Airbnb in Cheshire East typically peaks in October and dips lowest during March. Leveraging Airbnb dynamic pricing tools or strategies based on this seasonality can significantly boost revenue. Here's a look at the typical nightly rates achieved:
- Best-in-class properties (Top 10%) command rates of $466+ per night, often due to premium features or locations.
- Strong performing properties (Top 25%) achieve nightly rates of $215 or more.
- Typical properties (Median) charge around $139 per night.
- Entry-level properties (Bottom 25%) earn around $92 per night.
Average Daily Rate (ADR) Trend by Month in Cheshire East
Get Live Cheshire East Market Intelligence 👇

Explore Real-time Analytics
Airbnb Seasonality Analysis & Trends in Cheshire East (2025)
Peak Season (December, August, September)
- Revenue averages $3,399 per month
- Occupancy rates average 53.7%
- Daily rates average $213
Shoulder Season
- Revenue averages $2,676 per month
- Occupancy maintains around 42.7%
- Daily rates hold near $211
Low Season (January, February, April)
- Revenue drops to average $1,962 per month
- Occupancy decreases to average 33.4%
- Daily rates adjust to average $200
Seasonality Insights for Cheshire East
- The Airbnb seasonality in Cheshire East shows moderate seasonality with distinct peak and low periods. While the sections above show seasonal averages, it's also insightful to look at the extremes:
- During the high season, the absolute peak month showcases Cheshire East's highest earning potential, with monthly revenues capable of climbing to $3,605, occupancy reaching a high of 61.0%, and ADRs peaking at $219.
- Conversely, the slowest single month of the year, typically falling within the low season, marks the market's lowest point. In this month, revenue might dip to $1,851, occupancy could drop to 28.4%, and ADRs may adjust down to $191.
- Understanding both the seasonal averages and these monthly peaks and troughs in revenue, occupancy, and ADR is crucial for maximizing your Airbnb profit potential in Cheshire East.
Seasonal Strategies for Maximizing Profit
- Peak Season: Maximize revenue through premium pricing and potentially longer minimum stays. Ensure high availability.
- Low Season: Offer competitive pricing, special promotions (e.g., extended stay discounts), and flexible cancellation policies. Target off-season travelers like remote workers or budget-conscious guests.
- Shoulder Seasons: Implement dynamic pricing that balances peak and low rates. Target weekend travelers or specific events. Offer slightly more flexible terms than peak season.
- Regularly analyze your own performance against these Cheshire East seasonality benchmarks and adjust your pricing and availability strategy accordingly.
Best Areas for Airbnb Investment in Cheshire East (2025)
Exploring the top neighborhoods for short-term rentals in Cheshire East? This section highlights key areas, outlining why they are attractive for hosts and guests, along with notable local attractions. Consider these locations based on your target guest profile and investment strategy.
| Neighborhood / Area | Why Host Here? (Target Guests & Appeal) | Key Attractions & Landmarks |
|---|---|---|
| Chester City Centre | Historic city with Roman walls, a vibrant shopping scene, and an array of attractions. Ideal for both leisure and business travelers. | Chester Cathedral, Chester Zoo, The Rows, Grosvenor Park, Chester Racecourse, River Dee |
| Wilmslow | Upscale town known for its affluent residents and close proximity to Manchester. Great for business travelers and those seeking a quiet retreat with easy access to the city. | The Carrs Park, Wilmslow Town Centre, Cheese Festival, Local boutiques, Food markets |
| Knutsford | Charming market town with a rich history and beautiful gardens. Ideal for tourists wanting a taste of English culture in a picturesque setting. | Tatton Park, Knutsford Heritage Centre, The Moor, Local cafes and restaurants |
| Macclesfield | Historic market town gaining popularity for its scenic surroundings and rich textile history. Good for outdoor enthusiasts and families. | Macclesfield Forest, The Silk Museum, Riverside Park, Local festivals |
| Congleton | Quaint market town offering access to beautiful countryside and local attractions. Appeals to families and those enjoying nature. | Astbury Mere Country Park, Congleton Park, Local markets, Blakesley Hall |
| Poynton | Family-friendly town with close-knit community vibes, ideal for travelers seeking a peaceful environment with local amenities. | Poynton Park, Local cafes, Community events |
| Sandbach | Historic town with medieval architecture and a vibrant local community. Perfect for visitors wanting a quieter stay with easy access to larger towns. | Sandbach Crosses, Local eateries, Historic buildings |
| Crewe | Known for its railway heritage, offers diverse accommodation options, and is a hub for business travelers and visitors to nearby attractions. | Crewe Heritage Centre, Local theatres, Shopping options |
Understanding Airbnb License Requirements & STR Laws in Cheshire East (2025)
While Cheshire East, England, United Kingdom currently shows low STR regulations, specific Airbnb license requirements might still exist or change. Always verify the latest short term rental regulations and Airbnb license requirements directly with local government authorities for Cheshire East to ensure full compliance before hosting.
(Source: AirROI data, 2025, finding no licensed listings among those analyzed)
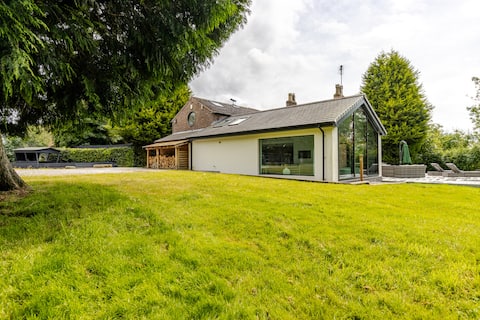
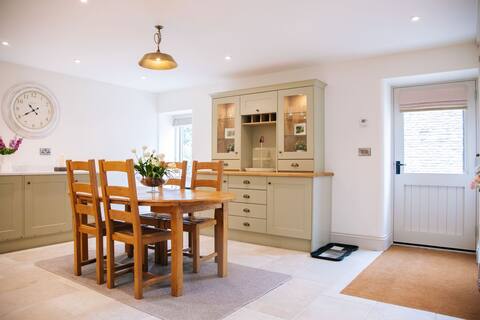
Top Performing Airbnb Properties in Cheshire East (2025)
Benchmark your potential! Explore examples of top-performing Airbnb properties in Cheshire Eastbased on Trailing Twelve Month (TTM) revenue. Analyze their characteristics, revenue, occupancy rate, and ADR to understand what drives success in this market.
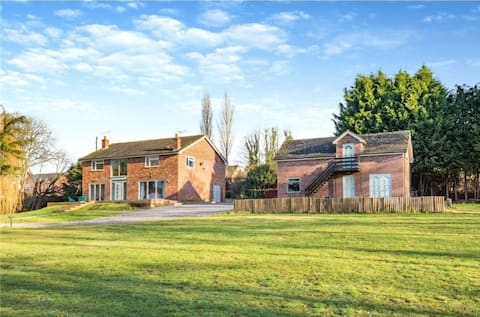
Huge Country House HOT TUB Included
Entire Place • 5 bedrooms

Countryside farm views with hot tub & gamesroom
Entire Place • 4 bedrooms
Private Farmhouse in Cheshire, 4 Bedrooms, Hot Tub
Entire Place • 4 bedrooms

Beautiful open plan accommodation to 1st floor.
Entire Place • 2 bedrooms
'The Cottage' at Further Harrop Farm
Entire Place • 3 bedrooms
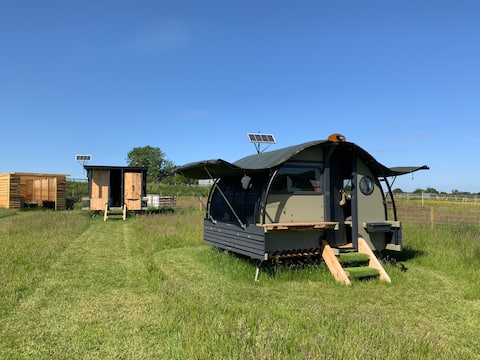
Rye Bank Adventures - exclusive hire glampsite
Entire Place • 2 bedrooms
Note: Performance varies based on location, size, amenities, seasonality, and management quality. Data reflects the past 12 months.
Top Performing Airbnb Hosts in Cheshire East (2025)
Learn from the best! This table showcases top-performing Airbnb hosts in Cheshire East based on the number of properties managed and estimated total revenue over the past year. Analyze their scale and performance metrics.
| Host Name | Properties | Grossing Revenue | Stay Reviews | Avg Rating |
|---|---|---|---|---|
| Roveina | 1 | $102,196 | 10 | 4.80/5.0 |
| Emma-Clare | 1 | $92,793 | 122 | 4.99/5.0 |
| Ryan | 1 | $59,645 | 30 | 4.90/5.0 |
| Sara | 2 | $58,686 | 63 | 4.89/5.0 |
| Lynsey | 1 | $58,525 | 47 | 4.98/5.0 |
| Ed | 1 | $31,306 | 6 | 5.00/5.0 |
| Ben | 1 | $30,223 | 12 | 5.00/5.0 |
| Martin | 1 | $29,594 | 160 | 4.96/5.0 |
| Sarah | 1 | $24,728 | 22 | 4.86/5.0 |
| Gary | 1 | $22,811 | 137 | 4.96/5.0 |
Analyzing the strategies of top hosts, such as their property selection, pricing, and guest communication, can offer valuable lessons for optimizing your own Airbnb operations in Cheshire East.
Dive Deeper: Advanced Cheshire East STR Market Data (2025)
Ready to unlock more insights? AirROI provides access to advanced metrics and comprehensive Airbnb data for Cheshire East. Explore detailed analytics beyond this report to refine your investment strategy, optimize pricing, and maximize your vacation rental profits.
Explore Advanced MetricsCheshire East Short-Term Rental Market Composition (2025): Property & Room Types
Room Type Distribution
Property Type Distribution
Market Composition Insights for Cheshire East
- The Cheshire East Airbnb market composition is heavily skewed towards Entire Home/Apt listings, which make up 100% of the 24 active rentals. This indicates strong guest preference for privacy and space.
- Looking at the property type distribution in Cheshire East, House properties are the most common (45.8%), reflecting the local real estate landscape.
- Houses represent a significant 45.8% portion, catering likely to families or larger groups.
- The presence of 8.3% Hotel/Boutique listings indicates integration with traditional hospitality.
- Smaller segments like unique stays (combined 4.2%) offer potential for unique stay experiences.
Cheshire East Airbnb Room Capacity Analysis (2025): Bedroom Distribution
Distribution of Listings by Number of Bedrooms
Room Capacity Insights for Cheshire East
- The dominant room capacity in Cheshire East is 1 bedroom listings, making up 37.5% of the market. This suggests a strong demand for properties suitable for couples or solo travelers.
- Together, 1 bedroom and 2 bedrooms properties represent 66.7% of the active Airbnb listings in Cheshire East, indicating a high concentration in these sizes.
- A significant 20.8% of listings offer 3+ bedrooms, catering to larger groups and families seeking more space in Cheshire East.
Cheshire East Vacation Rental Guest Capacity Trends (2025)
Distribution of Listings by Guest Capacity
Guest Capacity Insights for Cheshire East
- The most common guest capacity trend in Cheshire East vacation rentals is listings accommodating 2 guests (37.5%). This suggests the primary traveler segment is likely couples or solo travelers.
- Properties designed for 2 guests and 4 guests dominate the Cheshire East STR market, accounting for 62.5% of listings.
- 20.9% of properties accommodate 6+ guests, serving the market segment for larger families or group travel in Cheshire East.
- On average, properties in Cheshire East are equipped to host 4.0 guests.
Cheshire East Airbnb Booking Patterns (2025): Available vs. Booked Days
Available Days Distribution
Booked Days Distribution
Booking Pattern Insights for Cheshire East
- The most common availability pattern in Cheshire East falls within the 181-270 days range, representing 45.8% of listings. This suggests many properties have significant open periods on their calendars.
- Approximately 66.6% of listings show high availability (181+ days open annually), indicating potential for increased bookings or specific owner usage patterns.
- For booked days, the 91-180 days range is most frequent in Cheshire East (45.8%), reflecting common guest stay durations or potential owner blocking patterns.
- A notable 33.3% of properties secure long booking periods (181+ days booked per year), highlighting successful long-term rental strategies or significant owner usage.
Cheshire East Airbnb Minimum Stay Requirements Analysis
Distribution of Listings by Minimum Night Requirement
1 Night
8 listings
34.8% of total
2 Nights
11 listings
47.8% of total
3 Nights
3 listings
13% of total
7-29 Nights
1 listings
4.3% of total
Key Insights
- The most prevalent minimum stay requirement in Cheshire East is 2 Nights, adopted by 47.8% of listings. This highlights the market's preference for shorter, flexible bookings.
- A strong majority (82.6%) of the Cheshire East Airbnb data shows acceptance of very short stays (1-2 nights), indicating a dynamic, high-turnover market.
Recommendations
- Align with the market by considering a 2 Nights minimum stay, as 47.8% of Cheshire East hosts use this setting.
- Adjust minimum nights based on seasonality – potentially shorter during low season and longer during peak demand periods in Cheshire East.
Cheshire East Airbnb Cancellation Policy Trends Analysis (2025)
Flexible
5 listings
20.8% of total
Moderate
10 listings
41.7% of total
Firm
5 listings
20.8% of total
Strict
4 listings
16.7% of total
Cancellation Policy Insights for Cheshire East
- The prevailing Airbnb cancellation policy trend in Cheshire East is Moderate, used by 41.7% of listings.
- There's a relatively balanced mix between guest-friendly (62.5%) and stricter (37.5%) policies, offering choices for different guest needs.
Recommendations for Hosts
- Consider adopting a Moderate policy to align with the 41.7% market standard in Cheshire East.
- Regularly review your cancellation policy against competitors and market demand shifts in Cheshire East.
Cheshire East STR Booking Lead Time Analysis (2025)
Average Booking Lead Time by Month
Booking Lead Time Insights for Cheshire East
- The overall average booking lead time for vacation rentals in Cheshire East is 49 days.
- Guests book furthest in advance for stays during July (average 77 days), likely coinciding with peak travel demand or local events.
- The shortest booking windows occur for stays in February (average 36 days), indicating more last-minute travel plans during this time.
- Seasonally, Summer (71 days avg.) sees the longest lead times, while Winter (44 days avg.) has the shortest, reflecting typical travel planning cycles.
Recommendations for Hosts
- Use the overall average lead time (49 days) as a baseline for your pricing and availability strategy in Cheshire East.
- For July stays, consider implementing length-of-stay discounts or slightly higher rates for bookings made less than 77 days out to capitalize on advance planning.
- Target marketing efforts for the Summer season well in advance (at least 71 days) to capture early planners.
- Monitor your own booking lead times against these Cheshire East averages to identify opportunities for dynamic pricing adjustments.
Popular & Essential Airbnb Amenities in Cheshire East (2025)
Amenity Prevalence
Amenity Insights for Cheshire East
- Essential amenities in Cheshire East that guests expect include: Smoke alarm, Free parking on premises, Hot water. Lacking these (any) could significantly impact bookings.
- Popular amenities like TV, Heating, Microwave are common but not universal. Offering these can provide a competitive edge.
- Warning: Wifi is not universally provided but is considered essential globally. Ensure reliable Wifi is offered.
Recommendations for Hosts
- Ensure your listing includes all essential amenities for Cheshire East: Smoke alarm, Free parking on premises, Hot water.
- Prioritize adding missing essentials: Hot water.
- Consider adding popular differentiators like TV or Heating to increase appeal.
- Highlight unique or less common amenities you offer (e.g., hot tub, dedicated workspace, EV charger) in your listing description and photos.
- Regularly check competitor amenities in Cheshire East to stay competitive.
Cheshire East Airbnb Guest Demographics & Profile Analysis (2025)
Guest Profile Summary for Cheshire East
- The typical guest profile for Airbnb in Cheshire East consists of primarily domestic travelers (96%), often arriving from nearby England, typically belonging to the Post-2000s (Gen Z/Alpha) group (50%), primarily speaking English or French.
- Domestic travelers account for 95.7% of guests.
- Key international markets include United Kingdom (95.7%) and Australia (1.6%).
- Top languages spoken are English (79%) followed by French (5.4%).
- A significant demographic segment is the Post-2000s (Gen Z/Alpha) group, representing 50% of guests.
Recommendations for Hosts
- Target domestic marketing efforts towards travelers from England and London.
- Tailor amenities and listing descriptions to appeal to the dominant Post-2000s (Gen Z/Alpha) demographic (e.g., highlight fast WiFi, smart home features, local guides).
- Highlight unique local experiences or amenities relevant to the primary guest profile.
- Consider seasonal promotions aligned with peak travel times for key origin markets.
Nearby Short-Term Rental Market Comparison
How does the Cheshire East Airbnb market stack up against its neighbors? Compare key performance metrics like average monthly revenue, ADR, and occupancy rates in surrounding areas to understand the broader regional STR landscape.
| Market | Active Properties | Monthly Revenue | Daily Rate | Avg. Occupancy |
|---|---|---|---|---|
| Grinton | 14 | $5,456 | $365.05 | 51% |
| Cartmel Fell | 17 | $4,719 | $331.68 | 52% |
| Casterton | 11 | $4,578 | $300.82 | 51% |
| Cark | 11 | $4,540 | $885.21 | 31% |
| Flore | 10 | $4,534 | $347.03 | 40% |
| Abbeycwmhir | 10 | $4,502 | $259.18 | 49% |
| Craven Arms | 10 | $4,487 | $292.69 | 50% |
| Eglwys-bach | 16 | $4,413 | $315.23 | 52% |
| Waverton | 16 | $4,358 | $444.20 | 33% |
| Hayton | 13 | $4,333 | $239.53 | 60% |