Chelmarsh Airbnb Market Analysis 2025: Short Term Rental Data & Vacation Rental Statistics in England, United Kingdom
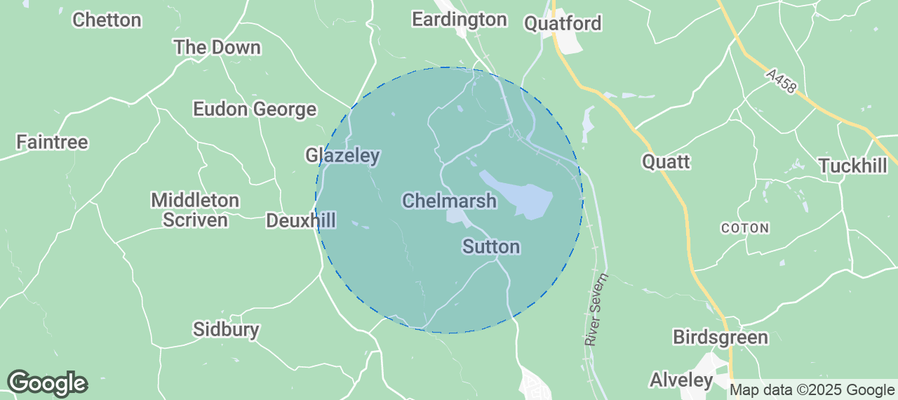
Is Airbnb profitable in Chelmarsh in 2025? Explore comprehensive Airbnb analytics for Chelmarsh, England, United Kingdom to uncover income potential. This 2025 STR market report for Chelmarsh, based on AirROI data from April 2024 to March 2025, reveals key trends in the niche market of 25 active listings.
Whether you're considering an Airbnb investment in Chelmarsh, optimizing your existing vacation rental, or exploring rental arbitrage opportunities, understanding the Chelmarsh Airbnb data is crucial. Leveraging the low regulation environment is key to maximizing your short term rental income potential. Let's dive into the specifics.
Key Chelmarsh Airbnb Performance Metrics Overview
Monthly Airbnb Revenue Variations & Income Potential in Chelmarsh (2025)
Understanding the monthly revenue variations for Airbnb listings in Chelmarsh is key to maximizing your short term rental income potential. Seasonality significantly impacts earnings. Our analysis, based on data from the past 12 months, shows that the peak revenue month for STRs in Chelmarsh is typically August, while January often presents the lowest earnings, highlighting opportunities for strategic pricing adjustments during shoulder and low seasons. Explore the typical Airbnb income in Chelmarsh across different performance tiers:
- Best-in-class properties (Top 10%) achieve $6,857+ monthly, often utilizing dynamic pricing and superior guest experiences.
- Strong performing properties (Top 25%) earn $4,883 or more, indicating effective management and desirable locations/amenities.
- Typical properties (Median) generate around $2,664 per month, representing the average market performance.
- Entry-level properties (Bottom 25%) see earnings around $1,652, often with potential for optimization.
Average Monthly Airbnb Earnings Trend in Chelmarsh
Chelmarsh Airbnb Occupancy Rate Trends (2025)
Maximize your bookings by understanding the Chelmarsh STR occupancy trends. Seasonal demand shifts significantly influence how often properties are booked. Typically, Augustsees the highest demand (peak season occupancy), while December experiences the lowest (low season). Effective strategies, like adjusting minimum stays or offering promotions, can boost occupancy during slower periods. Here's how different property tiers perform in Chelmarsh:
- Best-in-class properties (Top 10%) achieve 80%+ occupancy, indicating high desirability and potentially optimized availability.
- Strong performing properties (Top 25%) maintain 65% or higher occupancy, suggesting good market fit and guest satisfaction.
- Typical properties (Median) have an occupancy rate around 44%.
- Entry-level properties (Bottom 25%) average 23% occupancy, potentially facing higher vacancy.
Average Monthly Occupancy Rate Trend in Chelmarsh
Average Daily Rate (ADR) Airbnb Trends in Chelmarsh (2025)
Effective short term rental pricing strategy in Chelmarsh involves understanding monthly ADR fluctuations. The Average Daily Rate (ADR) for Airbnb in Chelmarsh typically peaks in August and dips lowest during November. Leveraging Airbnb dynamic pricing tools or strategies based on this seasonality can significantly boost revenue. Here's a look at the typical nightly rates achieved:
- Best-in-class properties (Top 10%) command rates of $1,051+ per night, often due to premium features or locations.
- Strong performing properties (Top 25%) achieve nightly rates of $327 or more.
- Typical properties (Median) charge around $246 per night.
- Entry-level properties (Bottom 25%) earn around $145 per night.
Average Daily Rate (ADR) Trend by Month in Chelmarsh
Get Live Chelmarsh Market Intelligence 👇
Explore Real-time Analytics
Airbnb Seasonality Analysis & Trends in Chelmarsh (2025)
Peak Season (August, February, March)
- Revenue averages $4,713 per month
- Occupancy rates average 53.4%
- Daily rates average $369
Shoulder Season
- Revenue averages $3,213 per month
- Occupancy maintains around 45.8%
- Daily rates hold near $372
Low Season (January, June, December)
- Revenue drops to average $2,629 per month
- Occupancy decreases to average 37.0%
- Daily rates adjust to average $345
Seasonality Insights for Chelmarsh
- The Airbnb seasonality in Chelmarsh shows highly seasonal trends requiring careful strategy. While the sections above show seasonal averages, it's also insightful to look at the extremes:
- During the high season, the absolute peak month showcases Chelmarsh's highest earning potential, with monthly revenues capable of climbing to $5,243, occupancy reaching a high of 68.8%, and ADRs peaking at $401.
- Conversely, the slowest single month of the year, typically falling within the low season, marks the market's lowest point. In this month, revenue might dip to $2,447, occupancy could drop to 32.7%, and ADRs may adjust down to $312.
- Understanding both the seasonal averages and these monthly peaks and troughs in revenue, occupancy, and ADR is crucial for maximizing your Airbnb profit potential in Chelmarsh.
Seasonal Strategies for Maximizing Profit
- Peak Season: Maximize revenue through premium pricing and potentially longer minimum stays. Ensure high availability.
- Low Season: Offer competitive pricing, special promotions (e.g., extended stay discounts), and flexible cancellation policies. Target off-season travelers like remote workers or budget-conscious guests.
- Shoulder Seasons: Implement dynamic pricing that balances peak and low rates. Target weekend travelers or specific events. Offer slightly more flexible terms than peak season.
- Regularly analyze your own performance against these Chelmarsh seasonality benchmarks and adjust your pricing and availability strategy accordingly.
Best Areas for Airbnb Investment in Chelmarsh (2025)
Exploring the top neighborhoods for short-term rentals in Chelmarsh? This section highlights key areas, outlining why they are attractive for hosts and guests, along with notable local attractions. Consider these locations based on your target guest profile and investment strategy.
| Neighborhood / Area | Why Host Here? (Target Guests & Appeal) | Key Attractions & Landmarks |
|---|---|---|
| Chelmarsh Village | A quaint and picturesque village near the scenic Chelmarsh Reservoir, favored by those seeking a peaceful retreat. Great for nature lovers and those looking to escape the bustle of city life. | Chelmarsh Reservoir, The Old Rectory, St. Peter's Church, Local walking trails, Countryside views |
| Bridgnorth | Just a short drive from Chelmarsh, Bridgnorth boasts historic charm with its beautiful buildings and the River Severn. A popular destination for tourists exploring Shropshire. | Bridgnorth Castle, The Severn Valley Railway, River Severn walks, Historic pubs, Cliff Railway |
| Kinver Edge | Famous for its dramatic sandstone cliffs and scenic woodland, Kinver Edge attracts hikers and outdoor enthusiasts, offering stunning views of the surrounding countryside. | Kinver Edge and the Rock Houses, National Trust walks, Historic Kinver village, Local shops and cafes, Nature reserves |
| Telford | A larger town nearby with various amenities, parks, and historical sites. It caters to both business travelers and families seeking accommodation with access to attractions. | Ironbridge Gorge, Telford Town Park, Blists Hill Victorian Town, Shopping centers, Local museums |
| Seven Valley Railway | Known for its heritage railway, this area attracts visitors who enjoy steam railways and scenic train rides through beautiful countryside landscapes. | Seven Valley Railway, Historic train rides, Scenic walks along the railway, Local villages, Railway heritage |
| Stourbridge | A market town with rich glassmaking heritage, Stourbridge offers a mix of cultural history and modern amenities, appealing to visitors interested in the arts. | Stourbridge Glass Museum, Mary Stevens Park, Local shopping and dining, Cultural events, Historic buildings |
| Wolverhampton | A city with diverse attractions, including shopping, entertainment, and rich history. Ideal for those who want vibrant urban experiences while staying close to the countryside. | Wolverhampton Art Gallery, Wolverhampton Grand Theatre, Local pubs and restaurants, Shopping centers, Parks and green spaces |
| Birmingham | While a bit further, Birmingham offers extensive shopping, dining, and entertainment options, appealing to tourists who want a city experience combined with rural retreats nearby. | Bullring Shopping Centre, Birmingham Museum and Art Gallery, Cadbury World, Cannon Hill Park, Birmingham Botanical Gardens |
Understanding Airbnb License Requirements & STR Laws in Chelmarsh (2025)
While Chelmarsh, England, United Kingdom currently shows low STR regulations, specific Airbnb license requirements might still exist or change. Always verify the latest short term rental regulations and Airbnb license requirements directly with local government authorities for Chelmarsh to ensure full compliance before hosting.
(Source: AirROI data, 2025, finding no licensed listings among those analyzed)
Top Performing Airbnb Properties in Chelmarsh (2025)
Benchmark your potential! Explore examples of top-performing Airbnb properties in Chelmarshbased on Trailing Twelve Month (TTM) revenue. Analyze their characteristics, revenue, occupancy rate, and ADR to understand what drives success in this market.
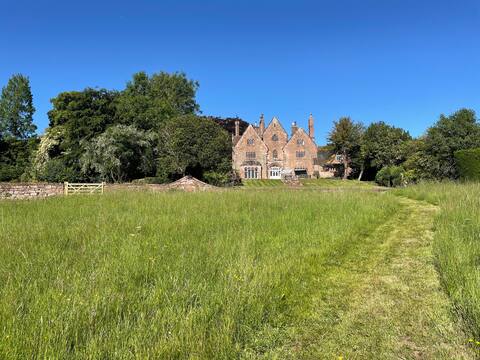
Historic family home with wonderful gardens
Entire Place • 7 bedrooms

oak Lodge vip
Private Room • 2 bedrooms
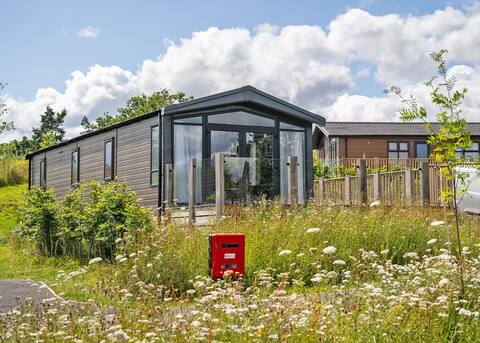
Sycamore Lodge vip
Private Room • 2 bedrooms
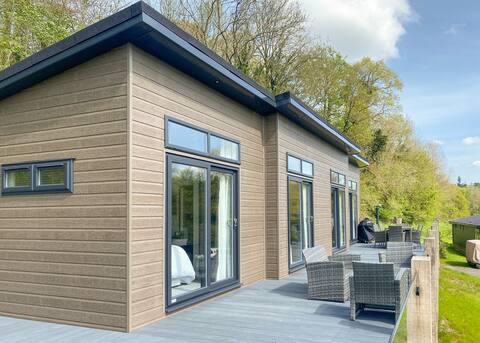
Cedar Lodge vip
Private Room • 3 bedrooms
ivy Lodge vip
Private Room • 2 bedrooms
Cedar Lodge
Private Room • 3 bedrooms
Note: Performance varies based on location, size, amenities, seasonality, and management quality. Data reflects the past 12 months.
Top Performing Airbnb Hosts in Chelmarsh (2025)
Learn from the best! This table showcases top-performing Airbnb hosts in Chelmarsh based on the number of properties managed and estimated total revenue over the past year. Analyze their scale and performance metrics.
| Host Name | Properties | Grossing Revenue | Stay Reviews | Avg Rating |
|---|---|---|---|---|
| Hoseasons | 11 | $339,359 | 23 | 0.89/5.0 |
| Karen | 6 | $99,188 | 182 | 4.95/5.0 |
| David | 3 | $66,474 | 326 | 5.00/5.0 |
| Host #262849785 | 1 | $58,625 | 1 | 0.00/5.0 |
| Cheryl | 1 | $35,345 | 203 | 5.00/5.0 |
| Audrey Marie | 1 | $33,962 | 263 | 4.98/5.0 |
| Host #222199733 | 1 | $15,530 | 0 | 0.00/5.0 |
| Beryl | 1 | $436 | 41 | 5.00/5.0 |
Analyzing the strategies of top hosts, such as their property selection, pricing, and guest communication, can offer valuable lessons for optimizing your own Airbnb operations in Chelmarsh.
Dive Deeper: Advanced Chelmarsh STR Market Data (2025)
Ready to unlock more insights? AirROI provides access to advanced metrics and comprehensive Airbnb data for Chelmarsh. Explore detailed analytics beyond this report to refine your investment strategy, optimize pricing, and maximize your vacation rental profits.
Explore Advanced MetricsChelmarsh Short-Term Rental Market Composition (2025): Property & Room Types
Room Type Distribution
Property Type Distribution
Market Composition Insights for Chelmarsh
- The Chelmarsh Airbnb market composition is heavily skewed towards Entire Home/Apt listings, which make up 48% of the 25 active rentals. This indicates strong guest preference for privacy and space.
- However, a notable 40% share for Private Rooms suggests opportunities for budget-conscious travelers or hosts renting out spare rooms.
- Looking at the property type distribution in Chelmarsh, Outdoor/Unique properties are the most common (48%), reflecting the local real estate landscape.
- Houses represent a significant 20% portion, catering likely to families or larger groups.
- The presence of 12% Hotel/Boutique listings indicates integration with traditional hospitality.
- Smaller segments like others (combined 4.0%) offer potential for unique stay experiences.
Chelmarsh Airbnb Room Capacity Analysis (2025): Bedroom Distribution
Distribution of Listings by Number of Bedrooms
Room Capacity Insights for Chelmarsh
- The dominant room capacity in Chelmarsh is 2 bedrooms listings, making up 40% of the market. This suggests a strong demand for properties suitable for couples or solo travelers.
- Together, 2 bedrooms and 3 bedrooms properties represent 64.0% of the active Airbnb listings in Chelmarsh, indicating a high concentration in these sizes.
- A significant 36.0% of listings offer 3+ bedrooms, catering to larger groups and families seeking more space in Chelmarsh.
Chelmarsh Vacation Rental Guest Capacity Trends (2025)
Distribution of Listings by Guest Capacity
Guest Capacity Insights for Chelmarsh
- The most common guest capacity trend in Chelmarsh vacation rentals is listings accommodating 4 guests (40%). This suggests the primary traveler segment is likely small families or groups.
- Properties designed for 4 guests and 2 guests dominate the Chelmarsh STR market, accounting for 68.0% of listings.
- 24.0% of properties accommodate 6+ guests, serving the market segment for larger families or group travel in Chelmarsh.
- On average, properties in Chelmarsh are equipped to host 4.1 guests.
Chelmarsh Airbnb Booking Patterns (2025): Available vs. Booked Days
Available Days Distribution
Booked Days Distribution
Booking Pattern Insights for Chelmarsh
- The most common availability pattern in Chelmarsh falls within the 271-366 days range, representing 48% of listings. This suggests many properties have significant open periods on their calendars.
- Approximately 80.0% of listings show high availability (181+ days open annually), indicating potential for increased bookings or specific owner usage patterns.
- For booked days, the 91-180 days range is most frequent in Chelmarsh (32%), reflecting common guest stay durations or potential owner blocking patterns.
- A notable 20.0% of properties secure long booking periods (181+ days booked per year), highlighting successful long-term rental strategies or significant owner usage.
Chelmarsh Airbnb Minimum Stay Requirements Analysis
Distribution of Listings by Minimum Night Requirement
1 Night
8 listings
34.8% of total
2 Nights
7 listings
30.4% of total
4-6 Nights
1 listings
4.3% of total
30+ Nights
7 listings
30.4% of total
Key Insights
- The most prevalent minimum stay requirement in Chelmarsh is 1 Night, adopted by 34.8% of listings. This highlights the market's preference for shorter, flexible bookings.
- A strong majority (65.2%) of the Chelmarsh Airbnb data shows acceptance of very short stays (1-2 nights), indicating a dynamic, high-turnover market.
- A significant segment (30.4%) caters to monthly stays (30+ nights) in Chelmarsh, pointing to opportunities in the extended-stay market.
Recommendations
- Align with the market by considering a 1 Night minimum stay, as 34.8% of Chelmarsh hosts use this setting.
- Explore offering discounts for stays of 30+ nights to attract the 30.4% of the market seeking extended stays.
- Adjust minimum nights based on seasonality – potentially shorter during low season and longer during peak demand periods in Chelmarsh.
Chelmarsh Airbnb Cancellation Policy Trends Analysis (2025)
Super Strict 60 Days
2 listings
14.3% of total
Flexible
1 listings
7.1% of total
Moderate
9 listings
64.3% of total
Firm
1 listings
7.1% of total
Strict
1 listings
7.1% of total
Cancellation Policy Insights for Chelmarsh
- The prevailing Airbnb cancellation policy trend in Chelmarsh is Moderate, used by 64.3% of listings.
- The market strongly favors guest-friendly terms, with 71.4% of listings offering Flexible or Moderate policies. This suggests guests in Chelmarsh may expect booking flexibility.
- Strict cancellation policies are quite rare (7.1%), potentially making listings with this policy less competitive unless justified by high demand or property type.
Recommendations for Hosts
- Consider adopting a Moderate policy to align with the 64.3% market standard in Chelmarsh.
- Using a Strict policy might deter some guests, as only 7.1% of listings use it. Evaluate if potential revenue protection outweighs possible lower booking rates.
- Regularly review your cancellation policy against competitors and market demand shifts in Chelmarsh.
Chelmarsh STR Booking Lead Time Analysis (2025)
Average Booking Lead Time by Month
Booking Lead Time Insights for Chelmarsh
- The overall average booking lead time for vacation rentals in Chelmarsh is 63 days.
- Guests book furthest in advance for stays during September (average 79 days), likely coinciding with peak travel demand or local events.
- The shortest booking windows occur for stays in March (average 24 days), indicating more last-minute travel plans during this time.
- Seasonally, Fall (61 days avg.) sees the longest lead times, while Winter (49 days avg.) has the shortest, reflecting typical travel planning cycles.
Recommendations for Hosts
- Use the overall average lead time (63 days) as a baseline for your pricing and availability strategy in Chelmarsh.
- For September stays, consider implementing length-of-stay discounts or slightly higher rates for bookings made less than 79 days out to capitalize on advance planning.
- Target marketing efforts for the Fall season well in advance (at least 61 days) to capture early planners.
- Monitor your own booking lead times against these Chelmarsh averages to identify opportunities for dynamic pricing adjustments.
Popular & Essential Airbnb Amenities in Chelmarsh (2025)
Amenity Prevalence
Amenity Insights for Chelmarsh
- Essential amenities in Chelmarsh that guests expect include: Smoke alarm, Wifi, Carbon monoxide alarm, Kitchen, Free parking on premises, TV, Heating. Lacking these (any) could significantly impact bookings.
- Popular amenities like Hot water, Essentials, Cooking basics are common but not universal. Offering these can provide a competitive edge.
Recommendations for Hosts
- Ensure your listing includes all essential amenities for Chelmarsh: Smoke alarm, Wifi, Carbon monoxide alarm, Kitchen, Free parking on premises, TV, Heating.
- Consider adding popular differentiators like Hot water or Essentials to increase appeal.
- Highlight unique or less common amenities you offer (e.g., hot tub, dedicated workspace, EV charger) in your listing description and photos.
- Regularly check competitor amenities in Chelmarsh to stay competitive.
Chelmarsh Airbnb Guest Demographics & Profile Analysis (2025)
Guest Profile Summary for Chelmarsh
- The typical guest profile for Airbnb in Chelmarsh consists of primarily domestic travelers (94%), often arriving from nearby England, typically belonging to the Post-2000s (Gen Z/Alpha) group (50%), primarily speaking English or German.
- Domestic travelers account for 94.4% of guests.
- Key international markets include United Kingdom (94.4%) and United States (3.1%).
- Top languages spoken are English (81.6%) followed by German (6.6%).
- A significant demographic segment is the Post-2000s (Gen Z/Alpha) group, representing 50% of guests.
Recommendations for Hosts
- Target domestic marketing efforts towards travelers from England and Birmingham.
- Tailor amenities and listing descriptions to appeal to the dominant Post-2000s (Gen Z/Alpha) demographic (e.g., highlight fast WiFi, smart home features, local guides).
- Highlight unique local experiences or amenities relevant to the primary guest profile.
- Consider seasonal promotions aligned with peak travel times for key origin markets.
Nearby Short-Term Rental Market Comparison
How does the Chelmarsh Airbnb market stack up against its neighbors? Compare key performance metrics like average monthly revenue, ADR, and occupancy rates in surrounding areas to understand the broader regional STR landscape.
| Market | Active Properties | Monthly Revenue | Daily Rate | Avg. Occupancy |
|---|---|---|---|---|
| Englishcombe | 13 | $8,558 | $573.69 | 49% |
| Chew Magna | 14 | $6,649 | $399.59 | 46% |
| Lambourn | 11 | $6,081 | $669.47 | 28% |
| Long Sutton | 17 | $5,726 | $383.88 | 46% |
| Stoke St. Michael | 10 | $5,277 | $424.04 | 42% |
| Oldland Common | 13 | $5,093 | $355.47 | 43% |
| Crai | 20 | $4,799 | $371.85 | 46% |
| Dinton | 11 | $4,637 | $242.16 | 58% |
| Limpley Stoke | 10 | $4,598 | $523.47 | 52% |
| Flore | 10 | $4,534 | $347.03 | 40% |