Chatton Airbnb Market Analysis 2025: Short Term Rental Data & Vacation Rental Statistics in England, United Kingdom
Is Airbnb profitable in Chatton in 2025? Explore comprehensive Airbnb analytics for Chatton, England, United Kingdom to uncover income potential. This 2025 STR market report for Chatton, based on AirROI data from April 2024 to March 2025, reveals key trends in the niche market of 28 active listings.
Whether you're considering an Airbnb investment in Chatton, optimizing your existing vacation rental, or exploring rental arbitrage opportunities, understanding the Chatton Airbnb data is crucial. Leveraging the low regulation environment is key to maximizing your short term rental income potential. Let's dive into the specifics.
Key Chatton Airbnb Performance Metrics Overview
Monthly Airbnb Revenue Variations & Income Potential in Chatton (2025)
Understanding the monthly revenue variations for Airbnb listings in Chatton is key to maximizing your short term rental income potential. Seasonality significantly impacts earnings. Our analysis, based on data from the past 12 months, shows that the peak revenue month for STRs in Chatton is typically July, while January often presents the lowest earnings, highlighting opportunities for strategic pricing adjustments during shoulder and low seasons. Explore the typical Airbnb income in Chatton across different performance tiers:
- Best-in-class properties (Top 10%) achieve $7,359+ monthly, often utilizing dynamic pricing and superior guest experiences.
- Strong performing properties (Top 25%) earn $5,302 or more, indicating effective management and desirable locations/amenities.
- Typical properties (Median) generate around $2,631 per month, representing the average market performance.
- Entry-level properties (Bottom 25%) see earnings around $1,212, often with potential for optimization.
Average Monthly Airbnb Earnings Trend in Chatton
Chatton Airbnb Occupancy Rate Trends (2025)
Maximize your bookings by understanding the Chatton STR occupancy trends. Seasonal demand shifts significantly influence how often properties are booked. Typically, Augustsees the highest demand (peak season occupancy), while January experiences the lowest (low season). Effective strategies, like adjusting minimum stays or offering promotions, can boost occupancy during slower periods. Here's how different property tiers perform in Chatton:
- Best-in-class properties (Top 10%) achieve 82%+ occupancy, indicating high desirability and potentially optimized availability.
- Strong performing properties (Top 25%) maintain 68% or higher occupancy, suggesting good market fit and guest satisfaction.
- Typical properties (Median) have an occupancy rate around 48%.
- Entry-level properties (Bottom 25%) average 27% occupancy, potentially facing higher vacancy.
Average Monthly Occupancy Rate Trend in Chatton
Average Daily Rate (ADR) Airbnb Trends in Chatton (2025)
Effective short term rental pricing strategy in Chatton involves understanding monthly ADR fluctuations. The Average Daily Rate (ADR) for Airbnb in Chatton typically peaks in July and dips lowest during March. Leveraging Airbnb dynamic pricing tools or strategies based on this seasonality can significantly boost revenue. Here's a look at the typical nightly rates achieved:
- Best-in-class properties (Top 10%) command rates of $409+ per night, often due to premium features or locations.
- Strong performing properties (Top 25%) achieve nightly rates of $305 or more.
- Typical properties (Median) charge around $218 per night.
- Entry-level properties (Bottom 25%) earn around $125 per night.
Average Daily Rate (ADR) Trend by Month in Chatton
Get Live Chatton Market Intelligence 👇

Explore Real-time Analytics
Airbnb Seasonality Analysis & Trends in Chatton (2025)
Peak Season (July, August, May)
- Revenue averages $5,061 per month
- Occupancy rates average 60.8%
- Daily rates average $262
Shoulder Season
- Revenue averages $3,494 per month
- Occupancy maintains around 48.6%
- Daily rates hold near $242
Low Season (January, February, March)
- Revenue drops to average $2,075 per month
- Occupancy decreases to average 34.5%
- Daily rates adjust to average $206
Seasonality Insights for Chatton
- The Airbnb seasonality in Chatton shows highly seasonal trends requiring careful strategy. While the sections above show seasonal averages, it's also insightful to look at the extremes:
- During the high season, the absolute peak month showcases Chatton's highest earning potential, with monthly revenues capable of climbing to $5,288, occupancy reaching a high of 68.0%, and ADRs peaking at $266.
- Conversely, the slowest single month of the year, typically falling within the low season, marks the market's lowest point. In this month, revenue might dip to $1,818, occupancy could drop to 28.9%, and ADRs may adjust down to $204.
- Understanding both the seasonal averages and these monthly peaks and troughs in revenue, occupancy, and ADR is crucial for maximizing your Airbnb profit potential in Chatton.
Seasonal Strategies for Maximizing Profit
- Peak Season: Maximize revenue through premium pricing and potentially longer minimum stays. Ensure high availability.
- Low Season: Offer competitive pricing, special promotions (e.g., extended stay discounts), and flexible cancellation policies. Target off-season travelers like remote workers or budget-conscious guests.
- Shoulder Seasons: Implement dynamic pricing that balances peak and low rates. Target weekend travelers or specific events. Offer slightly more flexible terms than peak season.
- Regularly analyze your own performance against these Chatton seasonality benchmarks and adjust your pricing and availability strategy accordingly.
Best Areas for Airbnb Investment in Chatton (2025)
Exploring the top neighborhoods for short-term rentals in Chatton? This section highlights key areas, outlining why they are attractive for hosts and guests, along with notable local attractions. Consider these locations based on your target guest profile and investment strategy.
| Neighborhood / Area | Why Host Here? (Target Guests & Appeal) | Key Attractions & Landmarks |
|---|---|---|
| Chatton Village | A picturesque village that offers a peaceful countryside retreat, ideal for guests seeking tranquility and a taste of rural English life. | Chatton Park, St. Mary’s Church, Historic Cottages, Walking Trails, Local Pubs |
| Nearby Wooler | Known as the ‘Gateway to the Cheviots’, Wooler offers convenient access to Northumberland National Park and is popular among hikers and nature enthusiasts. | Northumberland National Park, Cheviot Hills, Wooler Common, Wooler Water, Local Shops and Cafes |
| Alnwick | Home to the famous Alnwick Castle and Gardens, this market town attracts tourists interested in history and film, as it was a filming location for Harry Potter. | Alnwick Castle, Alnwick Garden, Barter Books, Alnwick Market, Local Festivals |
| Bamburgh | Known for its stunning beach and castle, Bamburgh attracts beach lovers and history buffs, providing a scenic coastal experience. | Bamburgh Castle, Bamburgh Beach, Grace Darling Museum, Farne Islands boat tours |
| Holy Island | A tidal island with rich history, it draws visitors who want to experience its cultural heritage and tranquil landscapes, especially during the pilgrimage season. | Lindisfarne Priory, Lindisfarne Castle, Holy Island causeway, Wildlife and Nature Trails |
| Northumberland Coast | This area features dramatic coastlines and numerous beaches, perfect for outdoor activities and attracting holidaymakers looking for natural beauty. | Beadnell Bay, Seahouses, Farne Islands, Dunstanburgh Castle, Beautiful Coastal Walks |
| Craster | Famous for its kippers, this charming fishing village offers a unique coastal experience with beautiful coastal walks and access to the nearby Dunstanburgh Castle. | Craster Harbour, Dunstanburgh Castle walk, Local seafood restaurants, Coastal paths |
| Lowick | A small village close to major attractions, offers a quiet stay with easy access to both the Northumberland countryside and coastal regions. | Historical Sites, Walking Trails, Local Farming Experiences, Nature Reserves |
Understanding Airbnb License Requirements & STR Laws in Chatton (2025)
While Chatton, England, United Kingdom currently shows low STR regulations, specific Airbnb license requirements might still exist or change. Always verify the latest short term rental regulations and Airbnb license requirements directly with local government authorities for Chatton to ensure full compliance before hosting.
(Source: AirROI data, 2025, finding no licensed listings among those analyzed)
Top Performing Airbnb Properties in Chatton (2025)
Benchmark your potential! Explore examples of top-performing Airbnb properties in Chattonbased on Trailing Twelve Month (TTM) revenue. Analyze their characteristics, revenue, occupancy rate, and ADR to understand what drives success in this market.
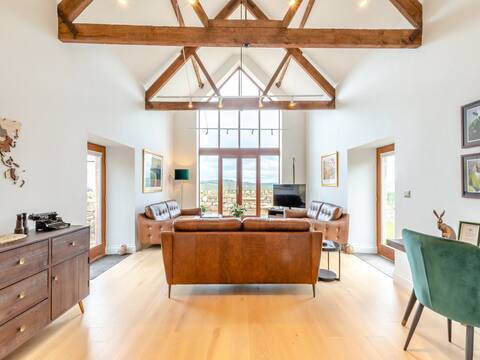
Haybale Barn
Entire Place • 4 bedrooms
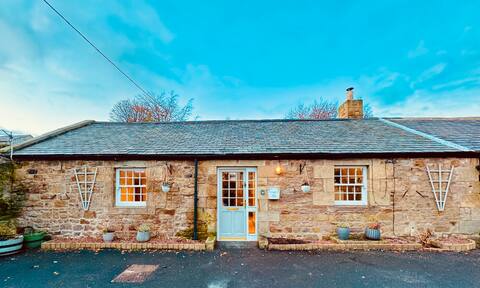
Old Stable House, Detached, Walled Garden &Parking
Entire Place • 2 bedrooms
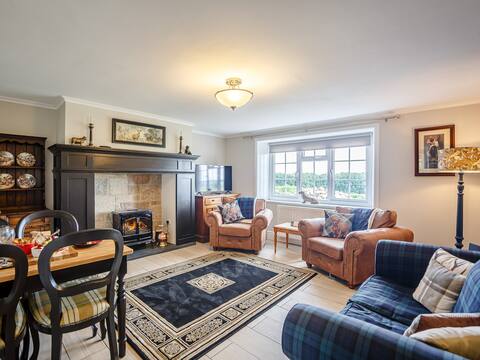
Farmside Cottage-UK35018
Entire Place • 2 bedrooms
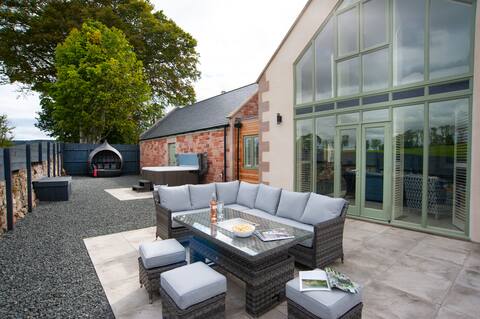
Sunset View, Hot Tub Haven for 8 people
Entire Place • 4 bedrooms
Percy Cottage
Entire Place • 1 bedroom
Limeworks Granary
Entire Place • 1 bedroom
Note: Performance varies based on location, size, amenities, seasonality, and management quality. Data reflects the past 12 months.
Top Performing Airbnb Hosts in Chatton (2025)
Learn from the best! This table showcases top-performing Airbnb hosts in Chatton based on the number of properties managed and estimated total revenue over the past year. Analyze their scale and performance metrics.
| Host Name | Properties | Grossing Revenue | Stay Reviews | Avg Rating |
|---|---|---|---|---|
| Cottages | 5 | $306,289 | 68 | 3.88/5.0 |
| Louise | 2 | $132,993 | 307 | 4.80/5.0 |
| Katie | 2 | $88,306 | 41 | 5.00/5.0 |
| Jo | 1 | $86,542 | 19 | 4.95/5.0 |
| Crabtree & Crabtree | 2 | $46,676 | 4 | 2.50/5.0 |
| Debra | 1 | $43,151 | 113 | 4.98/5.0 |
| Craig | 1 | $33,914 | 151 | 4.80/5.0 |
| Original Cottages - Northumber | 2 | $33,849 | 5 | 2.50/5.0 |
| Jonathan And Fran | 1 | $32,057 | 164 | 4.99/5.0 |
| Fliss | 2 | $31,932 | 350 | 4.88/5.0 |
Analyzing the strategies of top hosts, such as their property selection, pricing, and guest communication, can offer valuable lessons for optimizing your own Airbnb operations in Chatton.
Dive Deeper: Advanced Chatton STR Market Data (2025)
Ready to unlock more insights? AirROI provides access to advanced metrics and comprehensive Airbnb data for Chatton. Explore detailed analytics beyond this report to refine your investment strategy, optimize pricing, and maximize your vacation rental profits.
Explore Advanced MetricsChatton Short-Term Rental Market Composition (2025): Property & Room Types
Room Type Distribution
Property Type Distribution
Market Composition Insights for Chatton
- The Chatton Airbnb market composition is heavily skewed towards Entire Home/Apt listings, which make up 82.1% of the 28 active rentals. This indicates strong guest preference for privacy and space.
- Looking at the property type distribution in Chatton, House properties are the most common (75%), reflecting the local real estate landscape.
- Houses represent a significant 75% portion, catering likely to families or larger groups.
- The presence of 10.7% Hotel/Boutique listings indicates integration with traditional hospitality.
- Smaller segments like outdoor/unique (combined 3.6%) offer potential for unique stay experiences.
Chatton Airbnb Room Capacity Analysis (2025): Bedroom Distribution
Distribution of Listings by Number of Bedrooms
Room Capacity Insights for Chatton
- The dominant room capacity in Chatton is 2 bedrooms listings, making up 39.3% of the market. This suggests a strong demand for properties suitable for couples or solo travelers.
- Together, 2 bedrooms and 1 bedroom properties represent 78.6% of the active Airbnb listings in Chatton, indicating a high concentration in these sizes.
Chatton Vacation Rental Guest Capacity Trends (2025)
Distribution of Listings by Guest Capacity
Guest Capacity Insights for Chatton
- The most common guest capacity trend in Chatton vacation rentals is listings accommodating 4 guests (42.9%). This suggests the primary traveler segment is likely small families or groups.
- Properties designed for 4 guests and 2 guests dominate the Chatton STR market, accounting for 64.3% of listings.
- 17.8% of properties accommodate 6+ guests, serving the market segment for larger families or group travel in Chatton.
- On average, properties in Chatton are equipped to host 3.5 guests.
Chatton Airbnb Booking Patterns (2025): Available vs. Booked Days
Available Days Distribution
Booked Days Distribution
Booking Pattern Insights for Chatton
- The most common availability pattern in Chatton falls within the 181-270 days range, representing 32.1% of listings. This suggests many properties have significant open periods on their calendars.
- Approximately 60.7% of listings show high availability (181+ days open annually), indicating potential for increased bookings or specific owner usage patterns.
- For booked days, the 181-270 days range is most frequent in Chatton (35.7%), reflecting common guest stay durations or potential owner blocking patterns.
- A notable 46.4% of properties secure long booking periods (181+ days booked per year), highlighting successful long-term rental strategies or significant owner usage.
Chatton Airbnb Minimum Stay Requirements Analysis
Distribution of Listings by Minimum Night Requirement
1 Night
12 listings
42.9% of total
2 Nights
5 listings
17.9% of total
3 Nights
5 listings
17.9% of total
30+ Nights
6 listings
21.4% of total
Key Insights
- The most prevalent minimum stay requirement in Chatton is 1 Night, adopted by 42.9% of listings. This highlights the market's preference for shorter, flexible bookings.
- A strong majority (60.8%) of the Chatton Airbnb data shows acceptance of very short stays (1-2 nights), indicating a dynamic, high-turnover market.
- A significant segment (21.4%) caters to monthly stays (30+ nights) in Chatton, pointing to opportunities in the extended-stay market.
Recommendations
- Align with the market by considering a 1 Night minimum stay, as 42.9% of Chatton hosts use this setting.
- Explore offering discounts for stays of 30+ nights to attract the 21.4% of the market seeking extended stays.
- Adjust minimum nights based on seasonality – potentially shorter during low season and longer during peak demand periods in Chatton.
Chatton Airbnb Cancellation Policy Trends Analysis (2025)
Non-refundable
2 listings
8.7% of total
Super Strict 60 Days
6 listings
26.1% of total
Flexible
2 listings
8.7% of total
Moderate
3 listings
13% of total
Firm
8 listings
34.8% of total
Strict
2 listings
8.7% of total
Cancellation Policy Insights for Chatton
- The prevailing Airbnb cancellation policy trend in Chatton is Firm, used by 34.8% of listings.
- There's a relatively balanced mix between guest-friendly (21.7%) and stricter (43.5%) policies, offering choices for different guest needs.
- Strict cancellation policies are quite rare (8.7%), potentially making listings with this policy less competitive unless justified by high demand or property type.
Recommendations for Hosts
- Consider adopting a Firm policy to align with the 34.8% market standard in Chatton.
- Using a Strict policy might deter some guests, as only 8.7% of listings use it. Evaluate if potential revenue protection outweighs possible lower booking rates.
- Regularly review your cancellation policy against competitors and market demand shifts in Chatton.
Chatton STR Booking Lead Time Analysis (2025)
Average Booking Lead Time by Month
Booking Lead Time Insights for Chatton
- The overall average booking lead time for vacation rentals in Chatton is 48 days.
- Guests book furthest in advance for stays during August (average 91 days), likely coinciding with peak travel demand or local events.
- The shortest booking windows occur for stays in March (average 36 days), indicating more last-minute travel plans during this time.
- Seasonally, Summer (89 days avg.) sees the longest lead times, while Winter (54 days avg.) has the shortest, reflecting typical travel planning cycles.
Recommendations for Hosts
- Use the overall average lead time (48 days) as a baseline for your pricing and availability strategy in Chatton.
- For August stays, consider implementing length-of-stay discounts or slightly higher rates for bookings made less than 91 days out to capitalize on advance planning.
- Target marketing efforts for the Summer season well in advance (at least 89 days) to capture early planners.
- Monitor your own booking lead times against these Chatton averages to identify opportunities for dynamic pricing adjustments.
Popular & Essential Airbnb Amenities in Chatton (2025)
Amenity Prevalence
Amenity Insights for Chatton
- Popular amenities like Smoke alarm, Heating, Free parking on premises are common but not universal. Offering these can provide a competitive edge.
- Warning: Wifi is not universally provided but is considered essential globally. Ensure reliable Wifi is offered.
Recommendations for Hosts
- Consider adding popular differentiators like Smoke alarm or Heating to increase appeal.
- Highlight unique or less common amenities you offer (e.g., hot tub, dedicated workspace, EV charger) in your listing description and photos.
- Regularly check competitor amenities in Chatton to stay competitive.
Chatton Airbnb Guest Demographics & Profile Analysis (2025)
Guest Profile Summary for Chatton
- The typical guest profile for Airbnb in Chatton consists of primarily domestic travelers (93%), often arriving from nearby England, typically belonging to the Post-2000s (Gen Z/Alpha) group (50%), primarily speaking English or French.
- Domestic travelers account for 92.8% of guests.
- Key international markets include United Kingdom (92.8%) and Netherlands (1.1%).
- Top languages spoken are English (66.7%) followed by French (11.7%).
- A significant demographic segment is the Post-2000s (Gen Z/Alpha) group, representing 50% of guests.
Recommendations for Hosts
- Target domestic marketing efforts towards travelers from England and Newcastle upon Tyne.
- Tailor amenities and listing descriptions to appeal to the dominant Post-2000s (Gen Z/Alpha) demographic (e.g., highlight fast WiFi, smart home features, local guides).
- Highlight unique local experiences or amenities relevant to the primary guest profile.
- Consider seasonal promotions aligned with peak travel times for key origin markets.
Nearby Short-Term Rental Market Comparison
How does the Chatton Airbnb market stack up against its neighbors? Compare key performance metrics like average monthly revenue, ADR, and occupancy rates in surrounding areas to understand the broader regional STR landscape.
| Market | Active Properties | Monthly Revenue | Daily Rate | Avg. Occupancy |
|---|---|---|---|---|
| Grinton | 14 | $5,456 | $365.05 | 51% |
| Cartmel Fell | 17 | $4,719 | $331.68 | 52% |
| Casterton | 11 | $4,578 | $300.82 | 51% |
| Cark | 11 | $4,540 | $885.21 | 31% |
| Hayton | 13 | $4,333 | $239.53 | 60% |
| Watermillock | 16 | $4,281 | $274.03 | 50% |
| Kielder | 12 | $4,215 | $329.21 | 53% |
| Pooley Bridge | 13 | $4,145 | $317.26 | 52% |
| Kettlewell | 18 | $4,078 | $326.66 | 48% |
| Staveley-in-Cartmel | 25 | $4,054 | $355.95 | 47% |