Charlestown Airbnb Market Analysis 2025: Short Term Rental Data & Vacation Rental Statistics in England, United Kingdom
Is Airbnb profitable in Charlestown in 2025? Explore comprehensive Airbnb analytics for Charlestown, England, United Kingdom to uncover income potential. This 2025 STR market report for Charlestown, based on AirROI data from April 2024 to March 2025, reveals key trends in the niche market of 80 active listings.
Whether you're considering an Airbnb investment in Charlestown, optimizing your existing vacation rental, or exploring rental arbitrage opportunities, understanding the Charlestown Airbnb data is crucial. Leveraging the low regulation environment is key to maximizing your short term rental income potential. Let's dive into the specifics.
Key Charlestown Airbnb Performance Metrics Overview
Monthly Airbnb Revenue Variations & Income Potential in Charlestown (2025)
Understanding the monthly revenue variations for Airbnb listings in Charlestown is key to maximizing your short term rental income potential. Seasonality significantly impacts earnings. Our analysis, based on data from the past 12 months, shows that the peak revenue month for STRs in Charlestown is typically August, while January often presents the lowest earnings, highlighting opportunities for strategic pricing adjustments during shoulder and low seasons. Explore the typical Airbnb income in Charlestown across different performance tiers:
- Best-in-class properties (Top 10%) achieve $7,533+ monthly, often utilizing dynamic pricing and superior guest experiences.
- Strong performing properties (Top 25%) earn $4,846 or more, indicating effective management and desirable locations/amenities.
- Typical properties (Median) generate around $3,106 per month, representing the average market performance.
- Entry-level properties (Bottom 25%) see earnings around $1,882, often with potential for optimization.
Average Monthly Airbnb Earnings Trend in Charlestown
Charlestown Airbnb Occupancy Rate Trends (2025)
Maximize your bookings by understanding the Charlestown STR occupancy trends. Seasonal demand shifts significantly influence how often properties are booked. Typically, Augustsees the highest demand (peak season occupancy), while January experiences the lowest (low season). Effective strategies, like adjusting minimum stays or offering promotions, can boost occupancy during slower periods. Here's how different property tiers perform in Charlestown:
- Best-in-class properties (Top 10%) achieve 83%+ occupancy, indicating high desirability and potentially optimized availability.
- Strong performing properties (Top 25%) maintain 68% or higher occupancy, suggesting good market fit and guest satisfaction.
- Typical properties (Median) have an occupancy rate around 49%.
- Entry-level properties (Bottom 25%) average 28% occupancy, potentially facing higher vacancy.
Average Monthly Occupancy Rate Trend in Charlestown
Average Daily Rate (ADR) Airbnb Trends in Charlestown (2025)
Effective short term rental pricing strategy in Charlestown involves understanding monthly ADR fluctuations. The Average Daily Rate (ADR) for Airbnb in Charlestown typically peaks in August and dips lowest during November. Leveraging Airbnb dynamic pricing tools or strategies based on this seasonality can significantly boost revenue. Here's a look at the typical nightly rates achieved:
- Best-in-class properties (Top 10%) command rates of $442+ per night, often due to premium features or locations.
- Strong performing properties (Top 25%) achieve nightly rates of $311 or more.
- Typical properties (Median) charge around $215 per night.
- Entry-level properties (Bottom 25%) earn around $156 per night.
Average Daily Rate (ADR) Trend by Month in Charlestown
Get Live Charlestown Market Intelligence 👇

Explore Real-time Analytics
Airbnb Seasonality Analysis & Trends in Charlestown (2025)
Peak Season (August, July, June)
- Revenue averages $5,848 per month
- Occupancy rates average 66.5%
- Daily rates average $283
Shoulder Season
- Revenue averages $3,672 per month
- Occupancy maintains around 48.2%
- Daily rates hold near $253
Low Season (January, February, March)
- Revenue drops to average $2,189 per month
- Occupancy decreases to average 33.2%
- Daily rates adjust to average $245
Seasonality Insights for Charlestown
- The Airbnb seasonality in Charlestown shows highly seasonal trends requiring careful strategy. While the sections above show seasonal averages, it's also insightful to look at the extremes:
- During the high season, the absolute peak month showcases Charlestown's highest earning potential, with monthly revenues capable of climbing to $6,342, occupancy reaching a high of 74.7%, and ADRs peaking at $289.
- Conversely, the slowest single month of the year, typically falling within the low season, marks the market's lowest point. In this month, revenue might dip to $2,084, occupancy could drop to 25.5%, and ADRs may adjust down to $225.
- Understanding both the seasonal averages and these monthly peaks and troughs in revenue, occupancy, and ADR is crucial for maximizing your Airbnb profit potential in Charlestown.
Seasonal Strategies for Maximizing Profit
- Peak Season: Maximize revenue through premium pricing and potentially longer minimum stays. Ensure high availability.
- Low Season: Offer competitive pricing, special promotions (e.g., extended stay discounts), and flexible cancellation policies. Target off-season travelers like remote workers or budget-conscious guests.
- Shoulder Seasons: Implement dynamic pricing that balances peak and low rates. Target weekend travelers or specific events. Offer slightly more flexible terms than peak season.
- Regularly analyze your own performance against these Charlestown seasonality benchmarks and adjust your pricing and availability strategy accordingly.
Best Areas for Airbnb Investment in Charlestown (2025)
Exploring the top neighborhoods for short-term rentals in Charlestown? This section highlights key areas, outlining why they are attractive for hosts and guests, along with notable local attractions. Consider these locations based on your target guest profile and investment strategy.
| Neighborhood / Area | Why Host Here? (Target Guests & Appeal) | Key Attractions & Landmarks |
|---|---|---|
| Historic Dockyard | An iconic area featuring naval history and maritime museums, fantastic for tourists interested in British naval heritage and maritime exploration. | HMS Victory, Mary Rose Museum, National Museum of the Royal Navy, Royal Naval Museum, Portsmouth Historic Dockyard |
| Gunwharf Quays | A premier retail outlet center with waterfront dining and entertainment options, attracting shoppers and diners looking for a vibrant atmosphere. | Gunwharf Quays Shopping Centre, Spinnaker Tower, Vue Cinema, Waterfront Restaurants |
| Portsmouth Harbour | A beautiful waterfront area with scenic views and proximity to various attractions, perfect for visitors who want a blend of relaxation and activity. | Portsmouth Historic Dockyard, Clarence Pier, South Parade Pier |
| Old Portsmouth | A charming area with cobbled streets and historic buildings, ideal for those interested in history and picturesque walking routes. | Round Tower, Square Tower, The Point, Old Portsmouth pubs |
| Southsea | A vibrant beach area with a bustling seafront, attracting families and tourists looking for leisure activities and fun at the beach. | Southsea Common, South Parade Pier, D-Day Story Museum, Canoe Lake |
| Fratton | An emerging area with a local vibe, close to the city center and affordable accommodation options appealing to budget travelers and locals alike. | Fratton Park, Local markets, Community events |
| Cosham | A suburban area with great transport links, suitable for visitors who want a quieter stay but with easy access to central Portsmouth and attractions. | Cosham Village, Local parks, Historical sites |
| Eastney | A quieter, residential area known for its beaches and water activities, appealing to families and those looking for a more relaxed experience. | Eastney Beach, The D-Day Story, Local cafes and eateries |
Understanding Airbnb License Requirements & STR Laws in Charlestown (2025)
While Charlestown, England, United Kingdom currently shows low STR regulations, specific Airbnb license requirements might still exist or change. Always verify the latest short term rental regulations and Airbnb license requirements directly with local government authorities for Charlestown to ensure full compliance before hosting.
(Source: AirROI data, 2025, finding no licensed listings among those analyzed)
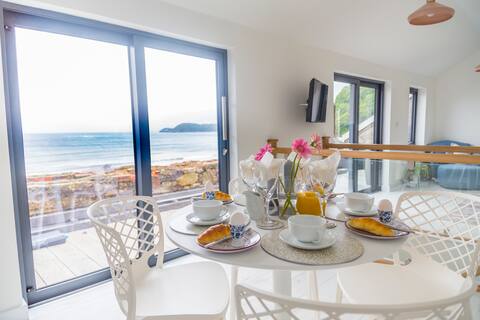
Top Performing Airbnb Properties in Charlestown (2025)
Benchmark your potential! Explore examples of top-performing Airbnb properties in Charlestownbased on Trailing Twelve Month (TTM) revenue. Analyze their characteristics, revenue, occupancy rate, and ADR to understand what drives success in this market.

Sea Breeze by Interhome
Entire Place • 3 bedrooms

two chi an mor
Entire Place • 3 bedrooms

On Amazing Spaces! Hot Tub Log Burner & Sea Views
Entire Place • 2 bedrooms

Charlestown Cornwall Fab Sea view 2 bedroom
Entire Place • 2 bedrooms
Super uninterrupted views over the beach and sea
Entire Place • 2 bedrooms
Spacious Boutique House nr Beach with Free Parking
Entire Place • 4 bedrooms
Note: Performance varies based on location, size, amenities, seasonality, and management quality. Data reflects the past 12 months.
Top Performing Airbnb Hosts in Charlestown (2025)
Learn from the best! This table showcases top-performing Airbnb hosts in Charlestown based on the number of properties managed and estimated total revenue over the past year. Analyze their scale and performance metrics.
| Host Name | Properties | Grossing Revenue | Stay Reviews | Avg Rating |
|---|---|---|---|---|
| Richard - Interhome Group | 4 | $299,564 | 41 | 3.65/5.0 |
| Cottages | 7 | $281,111 | 78 | 4.85/5.0 |
| Margaret | 4 | $274,865 | 407 | 4.96/5.0 |
| Lou | 3 | $134,103 | 56 | 4.95/5.0 |
| Charlotte | 1 | $94,118 | 154 | 4.95/5.0 |
| Host #15560926 | 1 | $83,320 | 10 | 5.00/5.0 |
| Dan | 1 | $82,152 | 48 | 5.00/5.0 |
| Cornish Horizons | 4 | $82,080 | 9 | 2.35/5.0 |
| Beth | 2 | $69,571 | 60 | 4.99/5.0 |
| Sarita | 2 | $65,283 | 356 | 4.93/5.0 |
Analyzing the strategies of top hosts, such as their property selection, pricing, and guest communication, can offer valuable lessons for optimizing your own Airbnb operations in Charlestown.
Dive Deeper: Advanced Charlestown STR Market Data (2025)
Ready to unlock more insights? AirROI provides access to advanced metrics and comprehensive Airbnb data for Charlestown. Explore detailed analytics beyond this report to refine your investment strategy, optimize pricing, and maximize your vacation rental profits.
Explore Advanced MetricsCharlestown Short-Term Rental Market Composition (2025): Property & Room Types
Room Type Distribution
Property Type Distribution
Market Composition Insights for Charlestown
- The Charlestown Airbnb market composition is heavily skewed towards Entire Home/Apt listings, which make up 93.8% of the 80 active rentals. This indicates strong guest preference for privacy and space.
- Looking at the property type distribution in Charlestown, House properties are the most common (73.8%), reflecting the local real estate landscape.
- Houses represent a significant 73.8% portion, catering likely to families or larger groups.
- Smaller segments like outdoor/unique, others, unique stays, hotel/boutique (combined 8.8%) offer potential for unique stay experiences.
Charlestown Airbnb Room Capacity Analysis (2025): Bedroom Distribution
Distribution of Listings by Number of Bedrooms
Room Capacity Insights for Charlestown
- The dominant room capacity in Charlestown is 2 bedrooms listings, making up 48.8% of the market. This suggests a strong demand for properties suitable for couples or solo travelers.
- Together, 2 bedrooms and 3 bedrooms properties represent 78.8% of the active Airbnb listings in Charlestown, indicating a high concentration in these sizes.
- A significant 36.3% of listings offer 3+ bedrooms, catering to larger groups and families seeking more space in Charlestown.
Charlestown Vacation Rental Guest Capacity Trends (2025)
Distribution of Listings by Guest Capacity
Guest Capacity Insights for Charlestown
- The most common guest capacity trend in Charlestown vacation rentals is listings accommodating 4 guests (43.8%). This suggests the primary traveler segment is likely small families or groups.
- Properties designed for 4 guests and 6 guests dominate the Charlestown STR market, accounting for 65.1% of listings.
- 28.9% of properties accommodate 6+ guests, serving the market segment for larger families or group travel in Charlestown.
- On average, properties in Charlestown are equipped to host 4.4 guests.
Charlestown Airbnb Booking Patterns (2025): Available vs. Booked Days
Available Days Distribution
Booked Days Distribution
Booking Pattern Insights for Charlestown
- The most common availability pattern in Charlestown falls within the 181-270 days range, representing 35% of listings. This suggests many properties have significant open periods on their calendars.
- Approximately 61.3% of listings show high availability (181+ days open annually), indicating potential for increased bookings or specific owner usage patterns.
- For booked days, the 91-180 days range is most frequent in Charlestown (36.3%), reflecting common guest stay durations or potential owner blocking patterns.
- A notable 38.7% of properties secure long booking periods (181+ days booked per year), highlighting successful long-term rental strategies or significant owner usage.
Charlestown Airbnb Minimum Stay Requirements Analysis
Distribution of Listings by Minimum Night Requirement
1 Night
14 listings
19.2% of total
2 Nights
7 listings
9.6% of total
3 Nights
23 listings
31.5% of total
4-6 Nights
4 listings
5.5% of total
7-29 Nights
2 listings
2.7% of total
30+ Nights
23 listings
31.5% of total
Key Insights
- The most prevalent minimum stay requirement in Charlestown is 3 Nights, adopted by 31.5% of listings. This highlights the market's preference for longer commitments.
- A significant segment (31.5%) caters to monthly stays (30+ nights) in Charlestown, pointing to opportunities in the extended-stay market.
Recommendations
- Align with the market by considering a 3 Nights minimum stay, as 31.5% of Charlestown hosts use this setting.
- If feasible, allowing 1-night stays, especially midweek or during low season, could capture last-minute bookings, as only 19.2% currently do.
- Explore offering discounts for stays of 30+ nights to attract the 31.5% of the market seeking extended stays.
- Adjust minimum nights based on seasonality – potentially shorter during low season and longer during peak demand periods in Charlestown.
Charlestown Airbnb Cancellation Policy Trends Analysis (2025)
Super Strict 60 Days
10 listings
14.7% of total
Flexible
3 listings
4.4% of total
Moderate
11 listings
16.2% of total
Firm
23 listings
33.8% of total
Strict
21 listings
30.9% of total
Cancellation Policy Insights for Charlestown
- The prevailing Airbnb cancellation policy trend in Charlestown is Firm, used by 33.8% of listings.
- A majority (64.7%) of hosts in Charlestown utilize Firm or Strict policies, indicating a market where hosts prioritize booking security.
Recommendations for Hosts
- Consider adopting a Firm policy to align with the 33.8% market standard in Charlestown.
- With 30.9% using Strict terms, this is a viable option in Charlestown, particularly for high-value properties or during peak demand periods.
- Regularly review your cancellation policy against competitors and market demand shifts in Charlestown.
Charlestown STR Booking Lead Time Analysis (2025)
Average Booking Lead Time by Month
Booking Lead Time Insights for Charlestown
- The overall average booking lead time for vacation rentals in Charlestown is 63 days.
- Guests book furthest in advance for stays during July (average 108 days), likely coinciding with peak travel demand or local events.
- The shortest booking windows occur for stays in February (average 47 days), indicating more last-minute travel plans during this time.
- Seasonally, Summer (99 days avg.) sees the longest lead times, while Winter (56 days avg.) has the shortest, reflecting typical travel planning cycles.
Recommendations for Hosts
- Use the overall average lead time (63 days) as a baseline for your pricing and availability strategy in Charlestown.
- For July stays, consider implementing length-of-stay discounts or slightly higher rates for bookings made less than 108 days out to capitalize on advance planning.
- Target marketing efforts for the Summer season well in advance (at least 99 days) to capture early planners.
- Monitor your own booking lead times against these Charlestown averages to identify opportunities for dynamic pricing adjustments.
Popular & Essential Airbnb Amenities in Charlestown (2025)
Amenity Prevalence
Amenity Insights for Charlestown
- Essential amenities in Charlestown that guests expect include: Smoke alarm, Wifi, Heating, TV. Lacking these (any) could significantly impact bookings.
- Popular amenities like Kitchen, Free parking on premises, Washer are common but not universal. Offering these can provide a competitive edge.
Recommendations for Hosts
- Ensure your listing includes all essential amenities for Charlestown: Smoke alarm, Wifi, Heating, TV.
- Prioritize adding missing essentials: Wifi, Heating, TV.
- Consider adding popular differentiators like Kitchen or Free parking on premises to increase appeal.
- Highlight unique or less common amenities you offer (e.g., hot tub, dedicated workspace, EV charger) in your listing description and photos.
- Regularly check competitor amenities in Charlestown to stay competitive.
Charlestown Airbnb Guest Demographics & Profile Analysis (2025)
Guest Profile Summary for Charlestown
- The typical guest profile for Airbnb in Charlestown consists of primarily domestic travelers (87%), often arriving from nearby England, typically belonging to the Post-2000s (Gen Z/Alpha) group (50%), primarily speaking English or French.
- Domestic travelers account for 86.9% of guests.
- Key international markets include United Kingdom (86.9%) and Germany (2.7%).
- Top languages spoken are English (67.8%) followed by French (10.3%).
- A significant demographic segment is the Post-2000s (Gen Z/Alpha) group, representing 50% of guests.
Recommendations for Hosts
- Target domestic marketing efforts towards travelers from England and London.
- Tailor amenities and listing descriptions to appeal to the dominant Post-2000s (Gen Z/Alpha) demographic (e.g., highlight fast WiFi, smart home features, local guides).
- Highlight unique local experiences or amenities relevant to the primary guest profile.
- Consider seasonal promotions aligned with peak travel times for key origin markets.
Nearby Short-Term Rental Market Comparison
How does the Charlestown Airbnb market stack up against its neighbors? Compare key performance metrics like average monthly revenue, ADR, and occupancy rates in surrounding areas to understand the broader regional STR landscape.
| Market | Active Properties | Monthly Revenue | Daily Rate | Avg. Occupancy |
|---|---|---|---|---|
| Llanrhidian | 15 | $4,842 | $386.18 | 53% |
| Crai | 20 | $4,799 | $371.85 | 46% |
| Trenance | 19 | $4,795 | $428.63 | 43% |
| Angle | 13 | $4,602 | $384.81 | 42% |
| Ludchurch | 15 | $4,354 | $291.87 | 43% |
| Redberth | 29 | $4,103 | $223.37 | 59% |
| Higher Crackington | 17 | $3,731 | $340.74 | 37% |
| Milverton | 11 | $3,675 | $393.89 | 37% |
| Pennorth | 13 | $3,595 | $417.69 | 37% |
| Gilwern | 22 | $3,505 | $193.56 | 53% |