Chacewater Airbnb Market Analysis 2025: Short Term Rental Data & Vacation Rental Statistics in England, United Kingdom
Is Airbnb profitable in Chacewater in 2025? Explore comprehensive Airbnb analytics for Chacewater, England, United Kingdom to uncover income potential. This 2025 STR market report for Chacewater, based on AirROI data from April 2024 to March 2025, reveals key trends in the niche market of 21 active listings.
Whether you're considering an Airbnb investment in Chacewater, optimizing your existing vacation rental, or exploring rental arbitrage opportunities, understanding the Chacewater Airbnb data is crucial. Leveraging the low regulation environment is key to maximizing your short term rental income potential. Let's dive into the specifics.
Key Chacewater Airbnb Performance Metrics Overview
Monthly Airbnb Revenue Variations & Income Potential in Chacewater (2025)
Understanding the monthly revenue variations for Airbnb listings in Chacewater is key to maximizing your short term rental income potential. Seasonality significantly impacts earnings. Our analysis, based on data from the past 12 months, shows that the peak revenue month for STRs in Chacewater is typically May, while March often presents the lowest earnings, highlighting opportunities for strategic pricing adjustments during shoulder and low seasons. Explore the typical Airbnb income in Chacewater across different performance tiers:
- Best-in-class properties (Top 10%) achieve $3,628+ monthly, often utilizing dynamic pricing and superior guest experiences.
- Strong performing properties (Top 25%) earn $2,762 or more, indicating effective management and desirable locations/amenities.
- Typical properties (Median) generate around $1,571 per month, representing the average market performance.
- Entry-level properties (Bottom 25%) see earnings around $698, often with potential for optimization.
Average Monthly Airbnb Earnings Trend in Chacewater
Chacewater Airbnb Occupancy Rate Trends (2025)
Maximize your bookings by understanding the Chacewater STR occupancy trends. Seasonal demand shifts significantly influence how often properties are booked. Typically, Augustsees the highest demand (peak season occupancy), while March experiences the lowest (low season). Effective strategies, like adjusting minimum stays or offering promotions, can boost occupancy during slower periods. Here's how different property tiers perform in Chacewater:
- Best-in-class properties (Top 10%) achieve 81%+ occupancy, indicating high desirability and potentially optimized availability.
- Strong performing properties (Top 25%) maintain 63% or higher occupancy, suggesting good market fit and guest satisfaction.
- Typical properties (Median) have an occupancy rate around 43%.
- Entry-level properties (Bottom 25%) average 18% occupancy, potentially facing higher vacancy.
Average Monthly Occupancy Rate Trend in Chacewater
Average Daily Rate (ADR) Airbnb Trends in Chacewater (2025)
Effective short term rental pricing strategy in Chacewater involves understanding monthly ADR fluctuations. The Average Daily Rate (ADR) for Airbnb in Chacewater typically peaks in May and dips lowest during February. Leveraging Airbnb dynamic pricing tools or strategies based on this seasonality can significantly boost revenue. Here's a look at the typical nightly rates achieved:
- Best-in-class properties (Top 10%) command rates of $184+ per night, often due to premium features or locations.
- Strong performing properties (Top 25%) achieve nightly rates of $156 or more.
- Typical properties (Median) charge around $130 per night.
- Entry-level properties (Bottom 25%) earn around $98 per night.
Average Daily Rate (ADR) Trend by Month in Chacewater
Get Live Chacewater Market Intelligence 👇

Explore Real-time Analytics
Airbnb Seasonality Analysis & Trends in Chacewater (2025)
Peak Season (May, August, April)
- Revenue averages $2,489 per month
- Occupancy rates average 49.2%
- Daily rates average $160
Shoulder Season
- Revenue averages $1,872 per month
- Occupancy maintains around 45.0%
- Daily rates hold near $147
Low Season (January, February, March)
- Revenue drops to average $1,142 per month
- Occupancy decreases to average 32.8%
- Daily rates adjust to average $123
Seasonality Insights for Chacewater
- The Airbnb seasonality in Chacewater shows highly seasonal trends requiring careful strategy. While the sections above show seasonal averages, it's also insightful to look at the extremes:
- During the high season, the absolute peak month showcases Chacewater's highest earning potential, with monthly revenues capable of climbing to $2,577, occupancy reaching a high of 57.9%, and ADRs peaking at $161.
- Conversely, the slowest single month of the year, typically falling within the low season, marks the market's lowest point. In this month, revenue might dip to $987, occupancy could drop to 27.1%, and ADRs may adjust down to $122.
- Understanding both the seasonal averages and these monthly peaks and troughs in revenue, occupancy, and ADR is crucial for maximizing your Airbnb profit potential in Chacewater.
Seasonal Strategies for Maximizing Profit
- Peak Season: Maximize revenue through premium pricing and potentially longer minimum stays. Ensure high availability.
- Low Season: Offer competitive pricing, special promotions (e.g., extended stay discounts), and flexible cancellation policies. Target off-season travelers like remote workers or budget-conscious guests.
- Shoulder Seasons: Implement dynamic pricing that balances peak and low rates. Target weekend travelers or specific events. Offer slightly more flexible terms than peak season.
- Regularly analyze your own performance against these Chacewater seasonality benchmarks and adjust your pricing and availability strategy accordingly.
Best Areas for Airbnb Investment in Chacewater (2025)
Exploring the top neighborhoods for short-term rentals in Chacewater? This section highlights key areas, outlining why they are attractive for hosts and guests, along with notable local attractions. Consider these locations based on your target guest profile and investment strategy.
| Neighborhood / Area | Why Host Here? (Target Guests & Appeal) | Key Attractions & Landmarks |
|---|---|---|
| Chacewater Village | A charming and picturesque village with rich mining history, perfect for those looking for a peaceful getaway close to nature. | St. Paul's Church, Chacewater Community Hall, Nearby walking trails, Historical mines, Local pubs |
| Truro | The nearby city of Truro is the retail and administrative center of Cornwall, attracting visitors for shopping, dining, and cultural events. | Truro Cathedral, Royal Cornwall Museum, Victoria Gardens, Shopping in the city center, Local theaters |
| Redruth | Redruth is a historic town known for its mining heritage, appealing to those interested in history and local culture. | Carn Brea Castle, Redruth Town Centre, Kresen Kernow archive, Historic Mining Sites, Local events and markets |
| Falmouth | A vibrant coastal town known for its beaches and maritime history, ideal for visitors looking for sea activities and relaxation. | Falmouth Maritime Museum, Gyllyngvase Beach, Pendennis Castle, Falmouth Harbour, Beautiful coastal walks |
| Penzance | A historic port town with stunning sea views and a vibrant arts scene, appealing to tourists looking for culture and nature. | St. Michael's Mount, Penzance Promenade, Penlee House Gallery, Jubilant arts festivals, Local seafood restaurants |
| Camborne | A town with rich mining history and a growing community, offering visitors a glimpse of Cornwall's industrial past. | Camborne's Mining Heritage, The Science Centre, Local markets, Historic buildings, Community events |
| Helston | Known for the famous Flora Day festival and beautiful natural surroundings, it attracts visitors interested in local traditions and outdoor activities. | Flora Day Festival, Helston Museum, Nearby nature reserves, Local pubs, Historic buildings |
| St Ives | A picturesque coastal town famous for its beaches, art galleries, and vibrant atmosphere, perfect for tourists seeking a seaside escape. | St Ives Harbour, Tate St Ives, Porthminster Beach, Art galleries, Coastal walks |
Understanding Airbnb License Requirements & STR Laws in Chacewater (2025)
While Chacewater, England, United Kingdom currently shows low STR regulations, specific Airbnb license requirements might still exist or change. Always verify the latest short term rental regulations and Airbnb license requirements directly with local government authorities for Chacewater to ensure full compliance before hosting.
(Source: AirROI data, 2025, finding no licensed listings among those analyzed)
Top Performing Airbnb Properties in Chacewater (2025)
Benchmark your potential! Explore examples of top-performing Airbnb properties in Chacewaterbased on Trailing Twelve Month (TTM) revenue. Analyze their characteristics, revenue, occupancy rate, and ADR to understand what drives success in this market.

Hygge Lodge with hot tub, woodburner and fab views
Entire Place • 1 bedroom
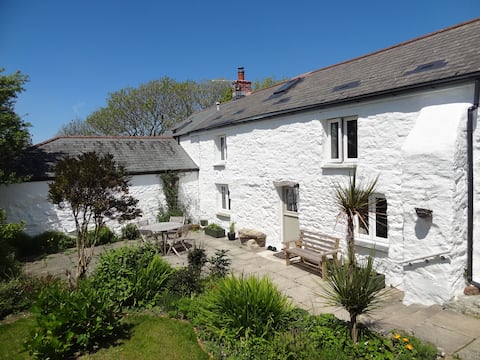
Traditional Cornish Miner's cottage
Entire Place • 2 bedrooms

Rural Cornish Cottage
Entire Place • 1 bedroom
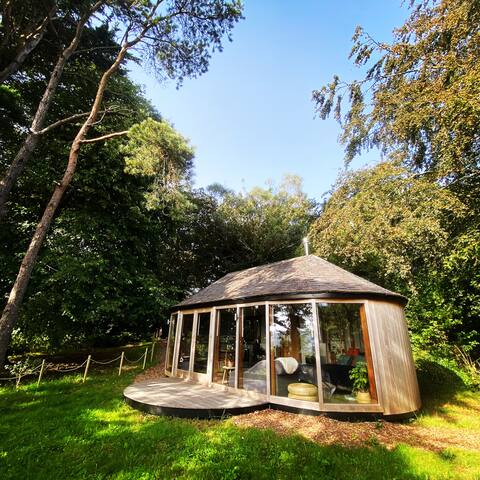
Unique Cedar Cabin in Cornwall
Entire Place • N/A
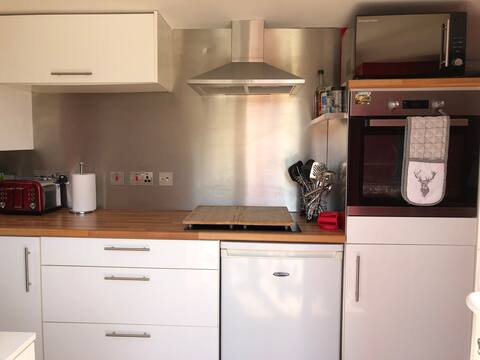
Perfect little cosy cottage - central location
Entire Place • 2 bedrooms

Primrose - Luxury Glamping with private hot tub
Entire Place • 2 bedrooms
Note: Performance varies based on location, size, amenities, seasonality, and management quality. Data reflects the past 12 months.
Top Performing Airbnb Hosts in Chacewater (2025)
Learn from the best! This table showcases top-performing Airbnb hosts in Chacewater based on the number of properties managed and estimated total revenue over the past year. Analyze their scale and performance metrics.
| Host Name | Properties | Grossing Revenue | Stay Reviews | Avg Rating |
|---|---|---|---|---|
| Stephen | 3 | $50,360 | 254 | 4.82/5.0 |
| Sally | 2 | $40,860 | 159 | 4.99/5.0 |
| Rachel | 1 | $34,529 | 180 | 4.87/5.0 |
| Jools | 3 | $33,697 | 47 | 4.90/5.0 |
| Roger And Polly | 1 | $30,302 | 169 | 4.98/5.0 |
| Emily | 1 | $28,366 | 46 | 4.98/5.0 |
| Alice | 1 | $24,940 | 12 | 5.00/5.0 |
| Sally | 2 | $23,564 | 18 | 2.47/5.0 |
| Jo | 1 | $19,762 | 8 | 5.00/5.0 |
| Katherine | 1 | $18,344 | 243 | 4.84/5.0 |
Analyzing the strategies of top hosts, such as their property selection, pricing, and guest communication, can offer valuable lessons for optimizing your own Airbnb operations in Chacewater.
Dive Deeper: Advanced Chacewater STR Market Data (2025)
Ready to unlock more insights? AirROI provides access to advanced metrics and comprehensive Airbnb data for Chacewater. Explore detailed analytics beyond this report to refine your investment strategy, optimize pricing, and maximize your vacation rental profits.
Explore Advanced MetricsChacewater Short-Term Rental Market Composition (2025): Property & Room Types
Room Type Distribution
Property Type Distribution
Market Composition Insights for Chacewater
- The Chacewater Airbnb market composition is heavily skewed towards Entire Home/Apt listings, which make up 95.2% of the 21 active rentals. This indicates strong guest preference for privacy and space.
- Looking at the property type distribution in Chacewater, Outdoor/Unique properties are the most common (38.1%), reflecting the local real estate landscape.
- Houses represent a significant 33.3% portion, catering likely to families or larger groups.
- Smaller segments like hotel/boutique, apartment/condo, unique stays (combined 14.4%) offer potential for unique stay experiences.
Chacewater Airbnb Room Capacity Analysis (2025): Bedroom Distribution
Distribution of Listings by Number of Bedrooms
Room Capacity Insights for Chacewater
- The dominant room capacity in Chacewater is 1 bedroom listings, making up 52.4% of the market. This suggests a strong demand for properties suitable for couples or solo travelers.
- Together, 1 bedroom and 2 bedrooms properties represent 90.5% of the active Airbnb listings in Chacewater, indicating a high concentration in these sizes.
- With over half the market (52.4%) consisting of studios or 1-bedroom units, Chacewater is particularly well-suited for individuals or couples.
Chacewater Vacation Rental Guest Capacity Trends (2025)
Distribution of Listings by Guest Capacity
Guest Capacity Insights for Chacewater
- The most common guest capacity trend in Chacewater vacation rentals is listings accommodating 4 guests (42.9%). This suggests the primary traveler segment is likely small families or groups.
- Properties designed for 4 guests and 2 guests dominate the Chacewater STR market, accounting for 76.2% of listings.
- On average, properties in Chacewater are equipped to host 3.1 guests.
Chacewater Airbnb Booking Patterns (2025): Available vs. Booked Days
Available Days Distribution
Booked Days Distribution
Booking Pattern Insights for Chacewater
- The most common availability pattern in Chacewater falls within the 271-366 days range, representing 42.9% of listings. This suggests many properties have significant open periods on their calendars.
- Approximately 71.5% of listings show high availability (181+ days open annually), indicating potential for increased bookings or specific owner usage patterns.
- For booked days, the 91-180 days range is most frequent in Chacewater (38.1%), reflecting common guest stay durations or potential owner blocking patterns.
- A notable 28.6% of properties secure long booking periods (181+ days booked per year), highlighting successful long-term rental strategies or significant owner usage.
Chacewater Airbnb Minimum Stay Requirements Analysis
Distribution of Listings by Minimum Night Requirement
1 Night
2 listings
10% of total
2 Nights
12 listings
60% of total
3 Nights
2 listings
10% of total
4-6 Nights
3 listings
15% of total
30+ Nights
1 listings
5% of total
Key Insights
- The most prevalent minimum stay requirement in Chacewater is 2 Nights, adopted by 60% of listings. This highlights the market's preference for shorter, flexible bookings.
- A strong majority (70.0%) of the Chacewater Airbnb data shows acceptance of very short stays (1-2 nights), indicating a dynamic, high-turnover market.
Recommendations
- Align with the market by considering a 2 Nights minimum stay, as 60% of Chacewater hosts use this setting.
- If feasible, allowing 1-night stays, especially midweek or during low season, could capture last-minute bookings, as only 10% currently do.
- A 2-night minimum appears standard (60%). Consider this for weekends or peak periods.
- Adjust minimum nights based on seasonality – potentially shorter during low season and longer during peak demand periods in Chacewater.
Chacewater Airbnb Cancellation Policy Trends Analysis (2025)
Flexible
1 listings
5% of total
Moderate
5 listings
25% of total
Firm
5 listings
25% of total
Strict
9 listings
45% of total
Cancellation Policy Insights for Chacewater
- The prevailing Airbnb cancellation policy trend in Chacewater is Strict, used by 45% of listings.
- A majority (70.0%) of hosts in Chacewater utilize Firm or Strict policies, indicating a market where hosts prioritize booking security.
Recommendations for Hosts
- Consider adopting a Strict policy to align with the 45% market standard in Chacewater.
- With 45% using Strict terms, this is a viable option in Chacewater, particularly for high-value properties or during peak demand periods.
- Regularly review your cancellation policy against competitors and market demand shifts in Chacewater.
Chacewater STR Booking Lead Time Analysis (2025)
Average Booking Lead Time by Month
Booking Lead Time Insights for Chacewater
- The overall average booking lead time for vacation rentals in Chacewater is 59 days.
- Guests book furthest in advance for stays during February (average 120 days), likely coinciding with peak travel demand or local events.
- The shortest booking windows occur for stays in March (average 15 days), indicating more last-minute travel plans during this time.
- Seasonally, Winter (94 days avg.) sees the longest lead times, while Fall (44 days avg.) has the shortest, reflecting typical travel planning cycles.
Recommendations for Hosts
- Use the overall average lead time (59 days) as a baseline for your pricing and availability strategy in Chacewater.
- For February stays, consider implementing length-of-stay discounts or slightly higher rates for bookings made less than 120 days out to capitalize on advance planning.
- Target marketing efforts for the Winter season well in advance (at least 94 days) to capture early planners.
- Monitor your own booking lead times against these Chacewater averages to identify opportunities for dynamic pricing adjustments.
Popular & Essential Airbnb Amenities in Chacewater (2025)
Amenity Prevalence
Amenity Insights for Chacewater
- Popular amenities like Free parking on premises, Refrigerator, Kitchen are common but not universal. Offering these can provide a competitive edge.
- Warning: Wifi is not universally provided but is considered essential globally. Ensure reliable Wifi is offered.
Recommendations for Hosts
- Consider adding popular differentiators like Free parking on premises or Refrigerator to increase appeal.
- Highlight unique or less common amenities you offer (e.g., hot tub, dedicated workspace, EV charger) in your listing description and photos.
- Regularly check competitor amenities in Chacewater to stay competitive.
Chacewater Airbnb Guest Demographics & Profile Analysis (2025)
Guest Profile Summary for Chacewater
- The typical guest profile for Airbnb in Chacewater consists of primarily domestic travelers (88%), often arriving from nearby England, typically belonging to the Post-2000s (Gen Z/Alpha) group (50%), primarily speaking English or French.
- Domestic travelers account for 87.5% of guests.
- Key international markets include United Kingdom (87.5%) and Germany (1.9%).
- Top languages spoken are English (64.9%) followed by French (8.2%).
- A significant demographic segment is the Post-2000s (Gen Z/Alpha) group, representing 50% of guests.
Recommendations for Hosts
- Target domestic marketing efforts towards travelers from England and London.
- Tailor amenities and listing descriptions to appeal to the dominant Post-2000s (Gen Z/Alpha) demographic (e.g., highlight fast WiFi, smart home features, local guides).
- Highlight unique local experiences or amenities relevant to the primary guest profile.
- Consider seasonal promotions aligned with peak travel times for key origin markets.
Nearby Short-Term Rental Market Comparison
How does the Chacewater Airbnb market stack up against its neighbors? Compare key performance metrics like average monthly revenue, ADR, and occupancy rates in surrounding areas to understand the broader regional STR landscape.
| Market | Active Properties | Monthly Revenue | Daily Rate | Avg. Occupancy |
|---|---|---|---|---|
| Llanrhidian | 15 | $4,842 | $386.18 | 53% |
| Trenance | 19 | $4,795 | $428.63 | 43% |
| Angle | 13 | $4,602 | $384.81 | 42% |
| Ludchurch | 15 | $4,354 | $291.87 | 43% |
| Redberth | 29 | $4,103 | $223.37 | 59% |
| Higher Crackington | 17 | $3,731 | $340.74 | 37% |
| Perranuthnoe | 24 | $3,421 | $352.15 | 37% |
| St. John | 44 | $3,354 | $233.49 | 50% |
| Llanboidy | 10 | $3,280 | $260.08 | 45% |
| Llangennith | 32 | $3,271 | $251.71 | 52% |