Bruton Airbnb Market Analysis 2025: Short Term Rental Data & Vacation Rental Statistics in England, United Kingdom
Is Airbnb profitable in Bruton in 2025? Explore comprehensive Airbnb analytics for Bruton, England, United Kingdom to uncover income potential. This 2025 STR market report for Bruton, based on AirROI data from April 2024 to March 2025, reveals key trends in the niche market of 46 active listings.
Whether you're considering an Airbnb investment in Bruton, optimizing your existing vacation rental, or exploring rental arbitrage opportunities, understanding the Bruton Airbnb data is crucial. Leveraging the low regulation environment is key to maximizing your short term rental income potential. Let's dive into the specifics.
Key Bruton Airbnb Performance Metrics Overview
Monthly Airbnb Revenue Variations & Income Potential in Bruton (2025)
Understanding the monthly revenue variations for Airbnb listings in Bruton is key to maximizing your short term rental income potential. Seasonality significantly impacts earnings. Our analysis, based on data from the past 12 months, shows that the peak revenue month for STRs in Bruton is typically May, while January often presents the lowest earnings, highlighting opportunities for strategic pricing adjustments during shoulder and low seasons. Explore the typical Airbnb income in Bruton across different performance tiers:
- Best-in-class properties (Top 10%) achieve $6,925+ monthly, often utilizing dynamic pricing and superior guest experiences.
- Strong performing properties (Top 25%) earn $3,893 or more, indicating effective management and desirable locations/amenities.
- Typical properties (Median) generate around $2,218 per month, representing the average market performance.
- Entry-level properties (Bottom 25%) see earnings around $1,093, often with potential for optimization.
Average Monthly Airbnb Earnings Trend in Bruton
Bruton Airbnb Occupancy Rate Trends (2025)
Maximize your bookings by understanding the Bruton STR occupancy trends. Seasonal demand shifts significantly influence how often properties are booked. Typically, Julysees the highest demand (peak season occupancy), while January experiences the lowest (low season). Effective strategies, like adjusting minimum stays or offering promotions, can boost occupancy during slower periods. Here's how different property tiers perform in Bruton:
- Best-in-class properties (Top 10%) achieve 71%+ occupancy, indicating high desirability and potentially optimized availability.
- Strong performing properties (Top 25%) maintain 53% or higher occupancy, suggesting good market fit and guest satisfaction.
- Typical properties (Median) have an occupancy rate around 35%.
- Entry-level properties (Bottom 25%) average 19% occupancy, potentially facing higher vacancy.
Average Monthly Occupancy Rate Trend in Bruton
Average Daily Rate (ADR) Airbnb Trends in Bruton (2025)
Effective short term rental pricing strategy in Bruton involves understanding monthly ADR fluctuations. The Average Daily Rate (ADR) for Airbnb in Bruton typically peaks in December and dips lowest during April. Leveraging Airbnb dynamic pricing tools or strategies based on this seasonality can significantly boost revenue. Here's a look at the typical nightly rates achieved:
- Best-in-class properties (Top 10%) command rates of $434+ per night, often due to premium features or locations.
- Strong performing properties (Top 25%) achieve nightly rates of $275 or more.
- Typical properties (Median) charge around $188 per night.
- Entry-level properties (Bottom 25%) earn around $133 per night.
Average Daily Rate (ADR) Trend by Month in Bruton
Get Live Bruton Market Intelligence 👇

Explore Real-time Analytics
Airbnb Seasonality Analysis & Trends in Bruton (2025)
Peak Season (May, July, June)
- Revenue averages $4,593 per month
- Occupancy rates average 42.3%
- Daily rates average $246
Shoulder Season
- Revenue averages $3,464 per month
- Occupancy maintains around 40.0%
- Daily rates hold near $249
Low Season (January, February, March)
- Revenue drops to average $1,836 per month
- Occupancy decreases to average 28.8%
- Daily rates adjust to average $258
Seasonality Insights for Bruton
- The Airbnb seasonality in Bruton shows highly seasonal trends requiring careful strategy. While the sections above show seasonal averages, it's also insightful to look at the extremes:
- During the high season, the absolute peak month showcases Bruton's highest earning potential, with monthly revenues capable of climbing to $4,919, occupancy reaching a high of 49.5%, and ADRs peaking at $272.
- Conversely, the slowest single month of the year, typically falling within the low season, marks the market's lowest point. In this month, revenue might dip to $1,619, occupancy could drop to 23.6%, and ADRs may adjust down to $236.
- Understanding both the seasonal averages and these monthly peaks and troughs in revenue, occupancy, and ADR is crucial for maximizing your Airbnb profit potential in Bruton.
Seasonal Strategies for Maximizing Profit
- Peak Season: Maximize revenue through premium pricing and potentially longer minimum stays. Ensure high availability.
- Low Season: Offer competitive pricing, special promotions (e.g., extended stay discounts), and flexible cancellation policies. Target off-season travelers like remote workers or budget-conscious guests.
- Shoulder Seasons: Implement dynamic pricing that balances peak and low rates. Target weekend travelers or specific events. Offer slightly more flexible terms than peak season.
- Regularly analyze your own performance against these Bruton seasonality benchmarks and adjust your pricing and availability strategy accordingly.
Best Areas for Airbnb Investment in Bruton (2025)
Exploring the top neighborhoods for short-term rentals in Bruton? This section highlights key areas, outlining why they are attractive for hosts and guests, along with notable local attractions. Consider these locations based on your target guest profile and investment strategy.
| Neighborhood / Area | Why Host Here? (Target Guests & Appeal) | Key Attractions & Landmarks |
|---|---|---|
| Bruton Town Centre | The historic center of Bruton features charming architecture, boutique shops, and a vibrant local community. It is a prime location for tourists wanting to experience the town's culture and history. | Bruton Museum, Hauser & Wirth Somerset, Church of St. Mary, Bruton Arts Festival, Local boutiques and cafes |
| Castle Cary Road | A picturesque area near Bruton with scenic views and access to nature walks. Ideal for visitors looking for a peaceful retreat. | Nearby countryside walks, Horse grazing fields, St. Mary’s Church, Bruton Dovecote, Historic stone buildings |
| Milborne Port | A quaint village offering easy access to both Bruton and surrounding nature, perfect for those who enjoy outdoor activities and rural charm. | St. John the Baptist Church, Milborne Port Golf Club, Local parks, Walking trails, Adventurous cycling routes |
| Bruton Railway Station | Conveniently located for travelers using public transport to explore the wider Somerset area. A great base for trips to nearby attractions. | Historical significance, Access to neighboring towns, Nearby cafes, Local art installations, Cycle routes |
| Cranmore | A quiet village close to Bruton with a strong sense of community and excellent local facilities. Attracts guests looking for a rural getaway. | Cranmore Tower, Walking trails, Local farm shops, Beautiful countryside views, Historic structures |
| Bruton Hill | Set on elevated ground, Bruton Hill provides stunning views of the surrounding countryside and is popular for its tranquil atmosphere and natural beauty. | Stunning views, Nature reserves, Hiking trails, Photography spots, Picnic areas |
| Bayford | Another rural locality close to Bruton, Bayford is an excellent choice for families and outdoor enthusiasts with access to various recreational activities. | Local parks, Walking and cycling trails, Picnic spots, Community events, Wildlife watching |
| Cheddar Gorge | While not directly in Bruton, this iconic natural site is easily accessible and attracts a lot of tourists. Perfect for stays when visiting the Gorge and its attractions. | Cheddar Gorge cliffs, Caves and rock formations, Hiking trails, Cheddar Village, Local cheese shops |
Understanding Airbnb License Requirements & STR Laws in Bruton (2025)
While Bruton, England, United Kingdom currently shows low STR regulations, specific Airbnb license requirements might still exist or change. Always verify the latest short term rental regulations and Airbnb license requirements directly with local government authorities for Bruton to ensure full compliance before hosting.
(Source: AirROI data, 2025, finding no licensed listings among those analyzed)
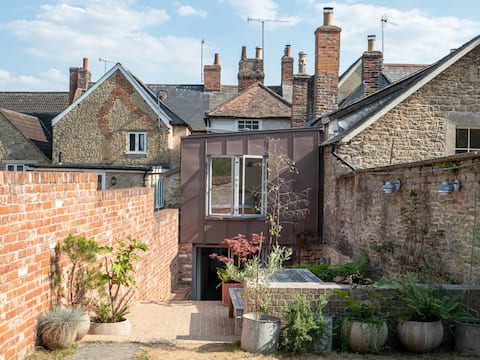
Top Performing Airbnb Properties in Bruton (2025)
Benchmark your potential! Explore examples of top-performing Airbnb properties in Brutonbased on Trailing Twelve Month (TTM) revenue. Analyze their characteristics, revenue, occupancy rate, and ADR to understand what drives success in this market.
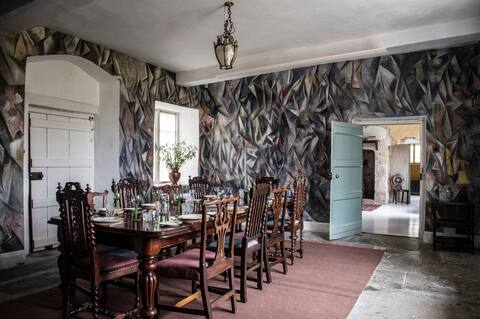
Durslade Farmhouse I Quirky Art-filled I 6 Bedroom
Entire Place • 6 bedrooms
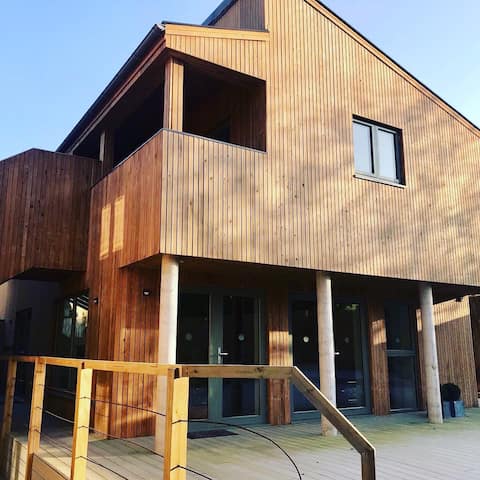
Large modern family house in Bruton
Entire Place • 9 bedrooms
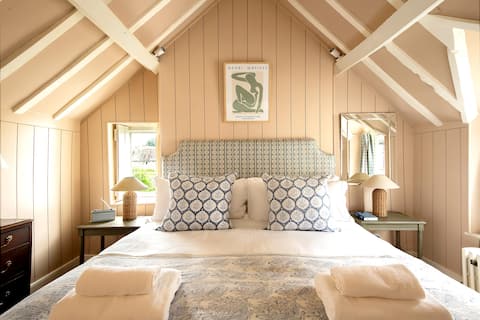
Unique Luxury Cottage in Bruton
Entire Place • 2 bedrooms

Godminster Manor Cottage
Entire Place • 3 bedrooms
Stylish 4-bedroom townhouse in the heart of Bruton
Entire Place • 4 bedrooms

The Bruton House
Entire Place • 4 bedrooms
Note: Performance varies based on location, size, amenities, seasonality, and management quality. Data reflects the past 12 months.
Top Performing Airbnb Hosts in Bruton (2025)
Learn from the best! This table showcases top-performing Airbnb hosts in Bruton based on the number of properties managed and estimated total revenue over the past year. Analyze their scale and performance metrics.
| Host Name | Properties | Grossing Revenue | Stay Reviews | Avg Rating |
|---|---|---|---|---|
| Bella | 1 | $186,195 | 43 | 4.95/5.0 |
| Matthew | 1 | $167,162 | 29 | 4.90/5.0 |
| Hannah | 2 | $99,086 | 113 | 4.94/5.0 |
| Denise | 5 | $94,739 | 110 | 4.97/5.0 |
| David | 1 | $89,699 | 88 | 4.95/5.0 |
| Joanna | 2 | $85,550 | 277 | 4.93/5.0 |
| Belu | 1 | $79,545 | 109 | 4.94/5.0 |
| Steve | 2 | $72,242 | 205 | 4.95/5.0 |
| Jade | 1 | $59,021 | 26 | 4.85/5.0 |
| Host #7184234 | 1 | $55,645 | 11 | 5.00/5.0 |
Analyzing the strategies of top hosts, such as their property selection, pricing, and guest communication, can offer valuable lessons for optimizing your own Airbnb operations in Bruton.
Dive Deeper: Advanced Bruton STR Market Data (2025)
Ready to unlock more insights? AirROI provides access to advanced metrics and comprehensive Airbnb data for Bruton. Explore detailed analytics beyond this report to refine your investment strategy, optimize pricing, and maximize your vacation rental profits.
Explore Advanced MetricsBruton Short-Term Rental Market Composition (2025): Property & Room Types
Room Type Distribution
Property Type Distribution
Market Composition Insights for Bruton
- The Bruton Airbnb market composition is heavily skewed towards Entire Home/Apt listings, which make up 82.6% of the 46 active rentals. This indicates strong guest preference for privacy and space.
- Looking at the property type distribution in Bruton, House properties are the most common (69.6%), reflecting the local real estate landscape.
- Houses represent a significant 69.6% portion, catering likely to families or larger groups.
- The presence of 13% Hotel/Boutique listings indicates integration with traditional hospitality.
- Smaller segments like unique stays, outdoor/unique, others (combined 10.8%) offer potential for unique stay experiences.
Bruton Airbnb Room Capacity Analysis (2025): Bedroom Distribution
Distribution of Listings by Number of Bedrooms
Room Capacity Insights for Bruton
- The dominant room capacity in Bruton is 1 bedroom listings, making up 28.3% of the market. This suggests a strong demand for properties suitable for couples or solo travelers.
- Together, 1 bedroom and 2 bedrooms properties represent 54.4% of the active Airbnb listings in Bruton, indicating a high concentration in these sizes.
- A significant 28.2% of listings offer 3+ bedrooms, catering to larger groups and families seeking more space in Bruton.
Bruton Vacation Rental Guest Capacity Trends (2025)
Distribution of Listings by Guest Capacity
Guest Capacity Insights for Bruton
- The most common guest capacity trend in Bruton vacation rentals is listings accommodating 4 guests (23.9%). This suggests the primary traveler segment is likely small families or groups.
- Properties designed for 4 guests and 2 guests dominate the Bruton STR market, accounting for 47.8% of listings.
- 23.9% of properties accommodate 6+ guests, serving the market segment for larger families or group travel in Bruton.
- On average, properties in Bruton are equipped to host 3.7 guests.
Bruton Airbnb Booking Patterns (2025): Available vs. Booked Days
Available Days Distribution
Booked Days Distribution
Booking Pattern Insights for Bruton
- The most common availability pattern in Bruton falls within the 271-366 days range, representing 50% of listings. This suggests many properties have significant open periods on their calendars.
- Approximately 73.9% of listings show high availability (181+ days open annually), indicating potential for increased bookings or specific owner usage patterns.
- For booked days, the 31-90 days range is most frequent in Bruton (37%), reflecting common guest stay durations or potential owner blocking patterns.
- A notable 26.0% of properties secure long booking periods (181+ days booked per year), highlighting successful long-term rental strategies or significant owner usage.
Bruton Airbnb Minimum Stay Requirements Analysis
Distribution of Listings by Minimum Night Requirement
1 Night
13 listings
28.9% of total
2 Nights
19 listings
42.2% of total
3 Nights
5 listings
11.1% of total
7-29 Nights
1 listings
2.2% of total
30+ Nights
7 listings
15.6% of total
Key Insights
- The most prevalent minimum stay requirement in Bruton is 2 Nights, adopted by 42.2% of listings. This highlights the market's preference for shorter, flexible bookings.
- A strong majority (71.1%) of the Bruton Airbnb data shows acceptance of very short stays (1-2 nights), indicating a dynamic, high-turnover market.
- A significant segment (15.6%) caters to monthly stays (30+ nights) in Bruton, pointing to opportunities in the extended-stay market.
Recommendations
- Align with the market by considering a 2 Nights minimum stay, as 42.2% of Bruton hosts use this setting.
- If feasible, allowing 1-night stays, especially midweek or during low season, could capture last-minute bookings, as only 28.9% currently do.
- Explore offering discounts for stays of 30+ nights to attract the 15.6% of the market seeking extended stays.
- Adjust minimum nights based on seasonality – potentially shorter during low season and longer during peak demand periods in Bruton.
Bruton Airbnb Cancellation Policy Trends Analysis (2025)
Super Strict 30 Days
1 listings
2.4% of total
Non-refundable
1 listings
2.4% of total
Flexible
10 listings
24.4% of total
Moderate
7 listings
17.1% of total
Firm
10 listings
24.4% of total
Strict
12 listings
29.3% of total
Cancellation Policy Insights for Bruton
- The prevailing Airbnb cancellation policy trend in Bruton is Strict, used by 29.3% of listings.
- A majority (53.7%) of hosts in Bruton utilize Firm or Strict policies, indicating a market where hosts prioritize booking security.
Recommendations for Hosts
- Consider adopting a Strict policy to align with the 29.3% market standard in Bruton.
- Regularly review your cancellation policy against competitors and market demand shifts in Bruton.
Bruton STR Booking Lead Time Analysis (2025)
Average Booking Lead Time by Month
Booking Lead Time Insights for Bruton
- The overall average booking lead time for vacation rentals in Bruton is 54 days.
- Guests book furthest in advance for stays during June (average 94 days), likely coinciding with peak travel demand or local events.
- The shortest booking windows occur for stays in February (average 30 days), indicating more last-minute travel plans during this time.
- Seasonally, Summer (72 days avg.) sees the longest lead times, while Fall (47 days avg.) has the shortest, reflecting typical travel planning cycles.
Recommendations for Hosts
- Use the overall average lead time (54 days) as a baseline for your pricing and availability strategy in Bruton.
- For June stays, consider implementing length-of-stay discounts or slightly higher rates for bookings made less than 94 days out to capitalize on advance planning.
- Target marketing efforts for the Summer season well in advance (at least 72 days) to capture early planners.
- Monitor your own booking lead times against these Bruton averages to identify opportunities for dynamic pricing adjustments.
Popular & Essential Airbnb Amenities in Bruton (2025)
Amenity Prevalence
Amenity Insights for Bruton
- Essential amenities in Bruton that guests expect include: Smoke alarm, Heating, Wifi. Lacking these (any) could significantly impact bookings.
- Popular amenities like Hot water, Iron, Carbon monoxide alarm are common but not universal. Offering these can provide a competitive edge.
Recommendations for Hosts
- Ensure your listing includes all essential amenities for Bruton: Smoke alarm, Heating, Wifi.
- Prioritize adding missing essentials: Heating, Wifi.
- Consider adding popular differentiators like Hot water or Iron to increase appeal.
- Highlight unique or less common amenities you offer (e.g., hot tub, dedicated workspace, EV charger) in your listing description and photos.
- Regularly check competitor amenities in Bruton to stay competitive.
Bruton Airbnb Guest Demographics & Profile Analysis (2025)
Guest Profile Summary for Bruton
- The typical guest profile for Airbnb in Bruton consists of primarily domestic travelers (89%), often arriving from nearby London, typically belonging to the Post-2000s (Gen Z/Alpha) group (50%), primarily speaking English or French.
- Domestic travelers account for 88.6% of guests.
- Key international markets include United Kingdom (88.6%) and United States (4.8%).
- Top languages spoken are English (60.6%) followed by French (11.6%).
- A significant demographic segment is the Post-2000s (Gen Z/Alpha) group, representing 50% of guests.
Recommendations for Hosts
- Target domestic marketing efforts towards travelers from London and England.
- Tailor amenities and listing descriptions to appeal to the dominant Post-2000s (Gen Z/Alpha) demographic (e.g., highlight fast WiFi, smart home features, local guides).
- Highlight unique local experiences or amenities relevant to the primary guest profile.
- Consider seasonal promotions aligned with peak travel times for key origin markets.
Nearby Short-Term Rental Market Comparison
How does the Bruton Airbnb market stack up against its neighbors? Compare key performance metrics like average monthly revenue, ADR, and occupancy rates in surrounding areas to understand the broader regional STR landscape.
| Market | Active Properties | Monthly Revenue | Daily Rate | Avg. Occupancy |
|---|---|---|---|---|
| Englishcombe | 13 | $8,558 | $573.69 | 49% |
| Chew Magna | 14 | $6,649 | $399.59 | 46% |
| Lambourn | 11 | $6,081 | $669.47 | 28% |
| Long Sutton | 17 | $5,726 | $383.88 | 46% |
| Stoke St. Michael | 10 | $5,277 | $424.04 | 42% |
| Winsham | 10 | $5,154 | $484.22 | 52% |
| Oldland Common | 13 | $5,093 | $355.47 | 43% |
| Crai | 20 | $4,799 | $371.85 | 46% |
| Dinton | 11 | $4,637 | $242.16 | 58% |
| Limpley Stoke | 10 | $4,598 | $523.47 | 52% |