Broughton Airbnb Market Analysis 2025: Short Term Rental Data & Vacation Rental Statistics in England, United Kingdom
Is Airbnb profitable in Broughton in 2025? Explore comprehensive Airbnb analytics for Broughton, England, United Kingdom to uncover income potential. This 2025 STR market report for Broughton, based on AirROI data from April 2024 to March 2025, reveals key trends in the niche market of 30 active listings.
Whether you're considering an Airbnb investment in Broughton, optimizing your existing vacation rental, or exploring rental arbitrage opportunities, understanding the Broughton Airbnb data is crucial. Leveraging the low regulation environment is key to maximizing your short term rental income potential. Let's dive into the specifics.
Key Broughton Airbnb Performance Metrics Overview
Monthly Airbnb Revenue Variations & Income Potential in Broughton (2025)
Understanding the monthly revenue variations for Airbnb listings in Broughton is key to maximizing your short term rental income potential. Seasonality significantly impacts earnings. Our analysis, based on data from the past 12 months, shows that the peak revenue month for STRs in Broughton is typically July, while April often presents the lowest earnings, highlighting opportunities for strategic pricing adjustments during shoulder and low seasons. Explore the typical Airbnb income in Broughton across different performance tiers:
- Best-in-class properties (Top 10%) achieve $8,591+ monthly, often utilizing dynamic pricing and superior guest experiences.
- Strong performing properties (Top 25%) earn $5,888 or more, indicating effective management and desirable locations/amenities.
- Typical properties (Median) generate around $2,741 per month, representing the average market performance.
- Entry-level properties (Bottom 25%) see earnings around $1,566, often with potential for optimization.
Average Monthly Airbnb Earnings Trend in Broughton
Broughton Airbnb Occupancy Rate Trends (2025)
Maximize your bookings by understanding the Broughton STR occupancy trends. Seasonal demand shifts significantly influence how often properties are booked. Typically, Julysees the highest demand (peak season occupancy), while March experiences the lowest (low season). Effective strategies, like adjusting minimum stays or offering promotions, can boost occupancy during slower periods. Here's how different property tiers perform in Broughton:
- Best-in-class properties (Top 10%) achieve 41%+ occupancy, indicating high desirability and potentially optimized availability.
- Strong performing properties (Top 25%) maintain 33% or higher occupancy, suggesting good market fit and guest satisfaction.
- Typical properties (Median) have an occupancy rate around 20%.
- Entry-level properties (Bottom 25%) average 13% occupancy, potentially facing higher vacancy.
Average Monthly Occupancy Rate Trend in Broughton
Average Daily Rate (ADR) Airbnb Trends in Broughton (2025)
Effective short term rental pricing strategy in Broughton involves understanding monthly ADR fluctuations. The Average Daily Rate (ADR) for Airbnb in Broughton typically peaks in December and dips lowest during February. Leveraging Airbnb dynamic pricing tools or strategies based on this seasonality can significantly boost revenue. Here's a look at the typical nightly rates achieved:
- Best-in-class properties (Top 10%) command rates of $1,226+ per night, often due to premium features or locations.
- Strong performing properties (Top 25%) achieve nightly rates of $888 or more.
- Typical properties (Median) charge around $568 per night.
- Entry-level properties (Bottom 25%) earn around $353 per night.
Average Daily Rate (ADR) Trend by Month in Broughton
Get Live Broughton Market Intelligence 👇

Explore Real-time Analytics
Airbnb Seasonality Analysis & Trends in Broughton (2025)
Peak Season (July, August, December)
- Revenue averages $6,351 per month
- Occupancy rates average 31.5%
- Daily rates average $685
Shoulder Season
- Revenue averages $3,830 per month
- Occupancy maintains around 22.8%
- Daily rates hold near $669
Low Season (March, April, November)
- Revenue drops to average $2,545 per month
- Occupancy decreases to average 18.7%
- Daily rates adjust to average $683
Seasonality Insights for Broughton
- The Airbnb seasonality in Broughton shows highly seasonal trends requiring careful strategy. While the sections above show seasonal averages, it's also insightful to look at the extremes:
- During the high season, the absolute peak month showcases Broughton's highest earning potential, with monthly revenues capable of climbing to $8,488, occupancy reaching a high of 36.1%, and ADRs peaking at $704.
- Conversely, the slowest single month of the year, typically falling within the low season, marks the market's lowest point. In this month, revenue might dip to $2,098, occupancy could drop to 13.0%, and ADRs may adjust down to $653.
- Understanding both the seasonal averages and these monthly peaks and troughs in revenue, occupancy, and ADR is crucial for maximizing your Airbnb profit potential in Broughton.
Seasonal Strategies for Maximizing Profit
- Peak Season: Maximize revenue through premium pricing and potentially longer minimum stays. Ensure high availability.
- Low Season: Offer competitive pricing, special promotions (e.g., extended stay discounts), and flexible cancellation policies. Target off-season travelers like remote workers or budget-conscious guests.
- Shoulder Seasons: Implement dynamic pricing that balances peak and low rates. Target weekend travelers or specific events. Offer slightly more flexible terms than peak season.
- Regularly analyze your own performance against these Broughton seasonality benchmarks and adjust your pricing and availability strategy accordingly.
Best Areas for Airbnb Investment in Broughton (2025)
Exploring the top neighborhoods for short-term rentals in Broughton? This section highlights key areas, outlining why they are attractive for hosts and guests, along with notable local attractions. Consider these locations based on your target guest profile and investment strategy.
| Neighborhood / Area | Why Host Here? (Target Guests & Appeal) | Key Attractions & Landmarks |
|---|---|---|
| Broughton Village | A quaint village with picturesque surroundings, ideal for a quiet retreat. Attractions include nearby parks and rural landscapes, making it appealing for those looking for a country getaway. | Broughton Hall, Local countryside walks, Village pub and shops |
| Broughton Astley | A vibrant community with plenty of local amenities and easy access to the scenic Leicestershire countryside. It's perfect for families and travelers looking for a mix of village life and outdoor activities. | Broughton Astley Village Centre, Local walking trails, Nearby parks |
| Leicester City Centre | Though a bit further, this bustling city offers cultural experiences, shopping, and nightlife. It's a prime location for tourists and business travelers. | Leicester Market, King Richard III Visitor Centre, National Space Centre, De Montfort Hall |
| Market Harborough | A charming market town with a rich history and a vibrant local market. It's great for visitors who appreciate quaint town life and local events. | Harborough Museum, The Old Grammar School, Market Harborough Town Centre |
| Whetstone | A suburban area with good access to Leicester, offering a peaceful setting with local shops and restaurants, suitable for family stays. | Whetstone Pastures, Local parks, Historical sites |
| Glen Parva | Close to Leicester, popular for its affordable accommodation options and local amenities, making it a hidden gem for budget-conscious travelers. | Glen Parva Nature Reserve, Local pubs, Accessibility to Leicester City |
| Narborough | A small village with a friendly community feel, offering easy access to surrounding areas and local attractions. Ideal for those looking to escape city life without being too far away. | Narborough Hall, Local parks, Nearby shops |
| Enderby | A small town with good transport links to Leicester and surrounding areas, making it an excellent choice for short-term rentals. | Enderby Lock, Local restaurants, Surrounding countryside |
Understanding Airbnb License Requirements & STR Laws in Broughton (2025)
While Broughton, England, United Kingdom currently shows low STR regulations, specific Airbnb license requirements might still exist or change. Always verify the latest short term rental regulations and Airbnb license requirements directly with local government authorities for Broughton to ensure full compliance before hosting.
(Source: AirROI data, 2025, finding no licensed listings among those analyzed)
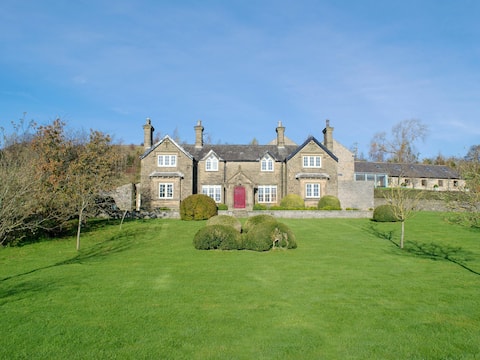
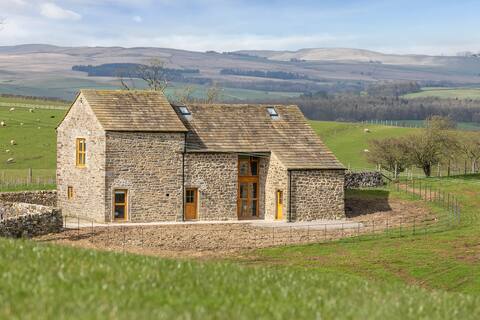
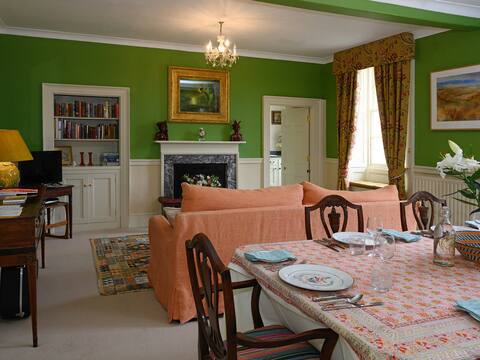
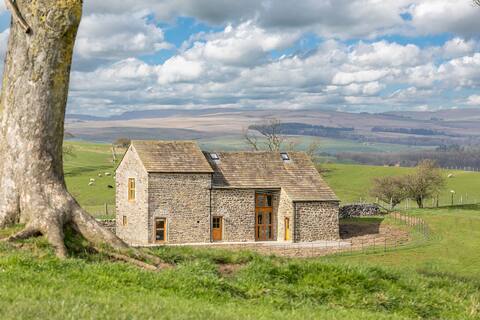
Top Performing Airbnb Properties in Broughton (2025)
Benchmark your potential! Explore examples of top-performing Airbnb properties in Broughtonbased on Trailing Twelve Month (TTM) revenue. Analyze their characteristics, revenue, occupancy rate, and ADR to understand what drives success in this market.

Chapel Flat - uk42251
Entire Place • 3 bedrooms

top Lodge - uk42245
Entire Place • 3 bedrooms
Roomy 6BR House in 3,000-acre Country Estate. Has Kids Cave!
Entire Place • 6 bedrooms
Poverty Hill by Birch Stays
Entire Place • 4 bedrooms
Bell Flat - uk42250
Entire Place • 2 bedrooms
Poverty Hill Barn
Entire Place • 4 bedrooms
Note: Performance varies based on location, size, amenities, seasonality, and management quality. Data reflects the past 12 months.
Top Performing Airbnb Hosts in Broughton (2025)
Learn from the best! This table showcases top-performing Airbnb hosts in Broughton based on the number of properties managed and estimated total revenue over the past year. Analyze their scale and performance metrics.
| Host Name | Properties | Grossing Revenue | Stay Reviews | Avg Rating |
|---|---|---|---|---|
| Host #222201078 | 7 | $268,754 | 0 | 0.00/5.0 |
| Host #1854981 | 14 | $248,158 | 0 | 0.00/5.0 |
| Broughton Hall | 8 | $233,285 | 42 | 2.99/5.0 |
| Aoife | 1 | $7,102 | 18 | 4.89/5.0 |
Analyzing the strategies of top hosts, such as their property selection, pricing, and guest communication, can offer valuable lessons for optimizing your own Airbnb operations in Broughton.
Dive Deeper: Advanced Broughton STR Market Data (2025)
Ready to unlock more insights? AirROI provides access to advanced metrics and comprehensive Airbnb data for Broughton. Explore detailed analytics beyond this report to refine your investment strategy, optimize pricing, and maximize your vacation rental profits.
Explore Advanced MetricsBroughton Short-Term Rental Market Composition (2025): Property & Room Types
Room Type Distribution
Property Type Distribution
Market Composition Insights for Broughton
- The Broughton Airbnb market composition is heavily skewed towards Entire Home/Apt listings, which make up 100% of the 30 active rentals. This indicates strong guest preference for privacy and space.
- Looking at the property type distribution in Broughton, House properties are the most common (100%), reflecting the local real estate landscape.
- Houses represent a significant 100% portion, catering likely to families or larger groups.
Broughton Airbnb Room Capacity Analysis (2025): Bedroom Distribution
Distribution of Listings by Number of Bedrooms
Room Capacity Insights for Broughton
- The dominant room capacity in Broughton is 3 bedrooms listings, making up 26.7% of the market. This suggests a strong demand for properties suitable for families or small groups.
- Together, 3 bedrooms and 5+ bedrooms properties represent 46.7% of the active Airbnb listings in Broughton, indicating a high concentration in these sizes.
- A significant 63.4% of listings offer 3+ bedrooms, catering to larger groups and families seeking more space in Broughton.
Broughton Vacation Rental Guest Capacity Trends (2025)
Distribution of Listings by Guest Capacity
Guest Capacity Insights for Broughton
- The most common guest capacity trend in Broughton vacation rentals is listings accommodating 8+ guests (30%). This suggests the primary traveler segment is likely larger groups.
- Properties designed for 8+ guests and 6 guests dominate the Broughton STR market, accounting for 53.3% of listings.
- 60.0% of properties accommodate 6+ guests, serving the market segment for larger families or group travel in Broughton.
- On average, properties in Broughton are equipped to host 5.7 guests.
Broughton Airbnb Booking Patterns (2025): Available vs. Booked Days
Available Days Distribution
Booked Days Distribution
Booking Pattern Insights for Broughton
- The most common availability pattern in Broughton falls within the 271-366 days range, representing 100% of listings. This suggests many properties have significant open periods on their calendars.
- Approximately 100.0% of listings show high availability (181+ days open annually), indicating potential for increased bookings or specific owner usage patterns.
- For booked days, the 31-90 days range is most frequent in Broughton (53.3%), reflecting common guest stay durations or potential owner blocking patterns.
Broughton Airbnb Minimum Stay Requirements Analysis
Distribution of Listings by Minimum Night Requirement
1 Night
4 listings
13.8% of total
3 Nights
19 listings
65.5% of total
30+ Nights
6 listings
20.7% of total
Key Insights
- The most prevalent minimum stay requirement in Broughton is 3 Nights, adopted by 65.5% of listings. This highlights the market's preference for longer commitments.
- Very short stays (1-2 nights) are less common (13.8%), suggesting hosts prefer slightly longer bookings to optimize turnover.
- A significant segment (20.7%) caters to monthly stays (30+ nights) in Broughton, pointing to opportunities in the extended-stay market.
Recommendations
- Align with the market by considering a 3 Nights minimum stay, as 65.5% of Broughton hosts use this setting.
- If feasible, allowing 1-night stays, especially midweek or during low season, could capture last-minute bookings, as only 13.8% currently do.
- Explore offering discounts for stays of 30+ nights to attract the 20.7% of the market seeking extended stays.
- Adjust minimum nights based on seasonality – potentially shorter during low season and longer during peak demand periods in Broughton.
Broughton Airbnb Cancellation Policy Trends Analysis (2025)
Flexible
1 listings
16.7% of total
Firm
5 listings
83.3% of total
Cancellation Policy Insights for Broughton
- The prevailing Airbnb cancellation policy trend in Broughton is Firm, used by 83.3% of listings.
- A majority (83.3%) of hosts in Broughton utilize Firm or Strict policies, indicating a market where hosts prioritize booking security.
Recommendations for Hosts
- Consider adopting a Firm policy to align with the 83.3% market standard in Broughton.
- Regularly review your cancellation policy against competitors and market demand shifts in Broughton.
Broughton STR Booking Lead Time Analysis (2025)
Average Booking Lead Time by Month
Booking Lead Time Insights for Broughton
- The overall average booking lead time for vacation rentals in Broughton is 113 days.
- Guests book furthest in advance for stays during March (average 194 days), likely coinciding with peak travel demand or local events.
- The shortest booking windows occur for stays in January (average 42 days), indicating more last-minute travel plans during this time.
- Seasonally, Spring (166 days avg.) sees the longest lead times, while Winter (90 days avg.) has the shortest, reflecting typical travel planning cycles.
Recommendations for Hosts
- Use the overall average lead time (113 days) as a baseline for your pricing and availability strategy in Broughton.
- For March stays, consider implementing length-of-stay discounts or slightly higher rates for bookings made less than 194 days out to capitalize on advance planning.
- Target marketing efforts for the Spring season well in advance (at least 166 days) to capture early planners.
- Monitor your own booking lead times against these Broughton averages to identify opportunities for dynamic pricing adjustments.
Popular & Essential Airbnb Amenities in Broughton (2025)
Amenity Prevalence
Amenity Insights for Broughton
- Essential amenities in Broughton that guests expect include: TV, Wifi, Heating, Smoke alarm, Essentials, Hot water, Dryer, Kitchen, Carbon monoxide alarm, Washer. Lacking these (any) could significantly impact bookings.
Recommendations for Hosts
- Ensure your listing includes all essential amenities for Broughton: TV, Wifi, Heating, Smoke alarm, Essentials, Hot water, Dryer, Kitchen, Carbon monoxide alarm, Washer.
- Prioritize adding missing essentials: Essentials, Hot water, Dryer, Kitchen, Carbon monoxide alarm, Washer.
- Highlight unique or less common amenities you offer (e.g., hot tub, dedicated workspace, EV charger) in your listing description and photos.
- Regularly check competitor amenities in Broughton to stay competitive.
Broughton Airbnb Guest Demographics & Profile Analysis (2025)
Guest Profile Summary for Broughton
- The typical guest profile for Airbnb in Broughton consists of primarily domestic travelers (92%), often arriving from nearby England, typically belonging to the Post-2000s (Gen Z/Alpha) group (50%), primarily speaking English or French.
- Domestic travelers account for 92.3% of guests.
- Key international markets include United Kingdom (92.3%) and Belgium (7.7%).
- Top languages spoken are English (60%) followed by French (20%).
- A significant demographic segment is the Post-2000s (Gen Z/Alpha) group, representing 50% of guests.
Recommendations for Hosts
- Target domestic marketing efforts towards travelers from England and Spennymoor.
- Tailor amenities and listing descriptions to appeal to the dominant Post-2000s (Gen Z/Alpha) demographic (e.g., highlight fast WiFi, smart home features, local guides).
- Highlight unique local experiences or amenities relevant to the primary guest profile.
- Consider seasonal promotions aligned with peak travel times for key origin markets.
Nearby Short-Term Rental Market Comparison
How does the Broughton Airbnb market stack up against its neighbors? Compare key performance metrics like average monthly revenue, ADR, and occupancy rates in surrounding areas to understand the broader regional STR landscape.
| Market | Active Properties | Monthly Revenue | Daily Rate | Avg. Occupancy |
|---|---|---|---|---|
| Grinton | 14 | $5,456 | $365.05 | 51% |
| Cartmel Fell | 17 | $4,719 | $331.68 | 52% |
| Casterton | 11 | $4,578 | $300.82 | 51% |
| Cark | 11 | $4,540 | $885.21 | 31% |
| Flore | 10 | $4,534 | $347.03 | 40% |
| Abbeycwmhir | 10 | $4,502 | $259.19 | 49% |
| Craven Arms | 10 | $4,487 | $292.69 | 50% |
| Eglwys-bach | 16 | $4,413 | $315.23 | 52% |
| Waverton | 16 | $4,358 | $444.20 | 33% |
| Hayton | 13 | $4,333 | $239.53 | 60% |