Broseley Airbnb Market Analysis 2025: Short Term Rental Data & Vacation Rental Statistics in England, United Kingdom
Is Airbnb profitable in Broseley in 2025? Explore comprehensive Airbnb analytics for Broseley, England, United Kingdom to uncover income potential. This 2025 STR market report for Broseley, based on AirROI data from April 2024 to March 2025, reveals key trends in the niche market of 20 active listings.
Whether you're considering an Airbnb investment in Broseley, optimizing your existing vacation rental, or exploring rental arbitrage opportunities, understanding the Broseley Airbnb data is crucial. Leveraging the low regulation environment is key to maximizing your short term rental income potential. Let's dive into the specifics.
Key Broseley Airbnb Performance Metrics Overview
Monthly Airbnb Revenue Variations & Income Potential in Broseley (2025)
Understanding the monthly revenue variations for Airbnb listings in Broseley is key to maximizing your short term rental income potential. Seasonality significantly impacts earnings. Our analysis, based on data from the past 12 months, shows that the peak revenue month for STRs in Broseley is typically August, while March often presents the lowest earnings, highlighting opportunities for strategic pricing adjustments during shoulder and low seasons. Explore the typical Airbnb income in Broseley across different performance tiers:
- Best-in-class properties (Top 10%) achieve $3,856+ monthly, often utilizing dynamic pricing and superior guest experiences.
- Strong performing properties (Top 25%) earn $2,209 or more, indicating effective management and desirable locations/amenities.
- Typical properties (Median) generate around $1,568 per month, representing the average market performance.
- Entry-level properties (Bottom 25%) see earnings around $742, often with potential for optimization.
Average Monthly Airbnb Earnings Trend in Broseley
Broseley Airbnb Occupancy Rate Trends (2025)
Maximize your bookings by understanding the Broseley STR occupancy trends. Seasonal demand shifts significantly influence how often properties are booked. Typically, Augustsees the highest demand (peak season occupancy), while March experiences the lowest (low season). Effective strategies, like adjusting minimum stays or offering promotions, can boost occupancy during slower periods. Here's how different property tiers perform in Broseley:
- Best-in-class properties (Top 10%) achieve 77%+ occupancy, indicating high desirability and potentially optimized availability.
- Strong performing properties (Top 25%) maintain 57% or higher occupancy, suggesting good market fit and guest satisfaction.
- Typical properties (Median) have an occupancy rate around 37%.
- Entry-level properties (Bottom 25%) average 22% occupancy, potentially facing higher vacancy.
Average Monthly Occupancy Rate Trend in Broseley
Average Daily Rate (ADR) Airbnb Trends in Broseley (2025)
Effective short term rental pricing strategy in Broseley involves understanding monthly ADR fluctuations. The Average Daily Rate (ADR) for Airbnb in Broseley typically peaks in September and dips lowest during March. Leveraging Airbnb dynamic pricing tools or strategies based on this seasonality can significantly boost revenue. Here's a look at the typical nightly rates achieved:
- Best-in-class properties (Top 10%) command rates of $277+ per night, often due to premium features or locations.
- Strong performing properties (Top 25%) achieve nightly rates of $176 or more.
- Typical properties (Median) charge around $112 per night.
- Entry-level properties (Bottom 25%) earn around $86 per night.
Average Daily Rate (ADR) Trend by Month in Broseley
Get Live Broseley Market Intelligence 👇

Explore Real-time Analytics
Airbnb Seasonality Analysis & Trends in Broseley (2025)
Peak Season (August, June, May)
- Revenue averages $2,496 per month
- Occupancy rates average 47.4%
- Daily rates average $145
Shoulder Season
- Revenue averages $1,902 per month
- Occupancy maintains around 41.4%
- Daily rates hold near $144
Low Season (January, February, March)
- Revenue drops to average $1,346 per month
- Occupancy decreases to average 35.1%
- Daily rates adjust to average $138
Seasonality Insights for Broseley
- The Airbnb seasonality in Broseley shows highly seasonal trends requiring careful strategy. While the sections above show seasonal averages, it's also insightful to look at the extremes:
- During the high season, the absolute peak month showcases Broseley's highest earning potential, with monthly revenues capable of climbing to $2,818, occupancy reaching a high of 58.6%, and ADRs peaking at $149.
- Conversely, the slowest single month of the year, typically falling within the low season, marks the market's lowest point. In this month, revenue might dip to $1,157, occupancy could drop to 30.0%, and ADRs may adjust down to $135.
- Understanding both the seasonal averages and these monthly peaks and troughs in revenue, occupancy, and ADR is crucial for maximizing your Airbnb profit potential in Broseley.
Seasonal Strategies for Maximizing Profit
- Peak Season: Maximize revenue through premium pricing and potentially longer minimum stays. Ensure high availability.
- Low Season: Offer competitive pricing, special promotions (e.g., extended stay discounts), and flexible cancellation policies. Target off-season travelers like remote workers or budget-conscious guests.
- Shoulder Seasons: Implement dynamic pricing that balances peak and low rates. Target weekend travelers or specific events. Offer slightly more flexible terms than peak season.
- Regularly analyze your own performance against these Broseley seasonality benchmarks and adjust your pricing and availability strategy accordingly.
Best Areas for Airbnb Investment in Broseley (2025)
Exploring the top neighborhoods for short-term rentals in Broseley? This section highlights key areas, outlining why they are attractive for hosts and guests, along with notable local attractions. Consider these locations based on your target guest profile and investment strategy.
| Neighborhood / Area | Why Host Here? (Target Guests & Appeal) | Key Attractions & Landmarks |
|---|---|---|
| Broseley Town Centre | The heart of Broseley, filled with local shops, cafes, and historical sites. A great base for visitors wanting to explore the Shropshire region and visit nearby attractions. | Broseley Pipeworks, Jackfield Tile Museum, Museum of Broseley, The Old Coalport China Works, Ironbridge Gorge |
| Coalport | A picturesque village known for its historic charm and proximity to the Ironbridge Gorge. Ideal for visitors interested in history and nature walks. | Coalport China Museum, The Iron Bridge, River Severn walks, The Tar Tunnel, Benthall Hall |
| Ironbridge Gorge | A UNESCO World Heritage Site famous for its rich industrial history and iconic Iron Bridge. A major draw for tourists, offering numerous attractions and activities. | The Iron Bridge, Blists Hill Victorian Town, The Iron Museum, The Old Town, Merrythought Factory |
| Telford | A larger town nearby that offers shopping, dining, and entertainment. Accessible and well-connected, making it a good option for travelers. | Telford Shopping Centre, Wonderland, The Showcase Cinema, Telford Ice Rink, The International Centre |
| Lilleshall | A quaint village known for its scenic countryside and Lilleshall Abbey ruins, perfect for guests who enjoy outdoor activities and history. | Lilleshall Abbey, Lilleshall National Sports Centre, Multiple walking trails, The Shropshire Hills AONB, Local pubs and eateries |
| Much Wenlock | A charming market town nearby, steeped in history and known for its association with the modern Olympic Games. A favorite among history buffs and walkers. | Wenlock Abbey, The Guildhall, The Old Gaol, Museum of the Order of St John, Beautiful walks around the town |
| Broseley Marsh | A quieter suburb of Broseley, known for its rural tranquility and access to nature. Attracts those looking for a peaceful retreat close to attractions. | River Severn walks, Nature reserves, Local wildlife, Countryside views, Quiet pubs |
| Benthall | A small village with stunning views and beautiful countryside, great for hiking and exploring the local flora and fauna. Ideal for nature lovers and outdoor adventurers. | Benthall Hall, Local walking trails, Countryside parks, Benthall Edge views, Shropshire Hills |
Understanding Airbnb License Requirements & STR Laws in Broseley (2025)
While Broseley, England, United Kingdom currently shows low STR regulations, specific Airbnb license requirements might still exist or change. Always verify the latest short term rental regulations and Airbnb license requirements directly with local government authorities for Broseley to ensure full compliance before hosting.
(Source: AirROI data, 2025, finding no licensed listings among those analyzed)
Top Performing Airbnb Properties in Broseley (2025)
Benchmark your potential! Explore examples of top-performing Airbnb properties in Broseleybased on Trailing Twelve Month (TTM) revenue. Analyze their characteristics, revenue, occupancy rate, and ADR to understand what drives success in this market.
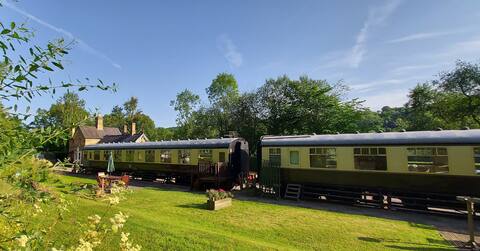
Unusual stay in luxury converted train carriage 2
Entire Place • 2 bedrooms
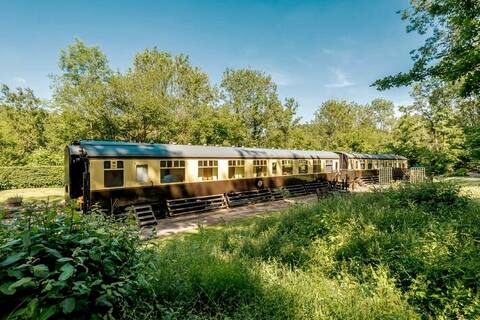
Quirky, Beautifully Converted Train Carriage 1
Entire Place • 3 bedrooms

Two Riverside cottages that can be rented together
Entire Place • 5 bedrooms

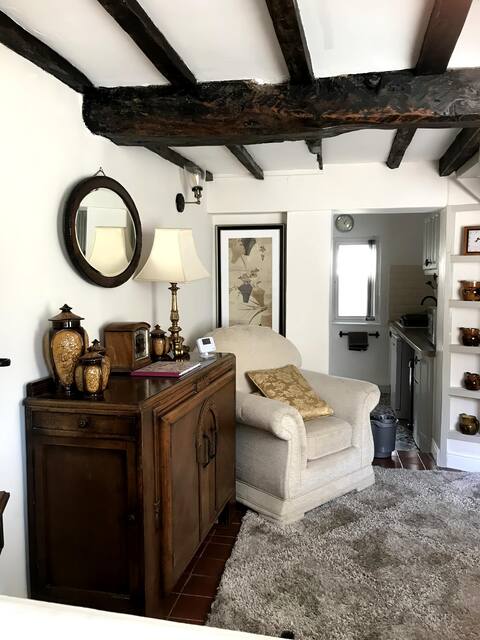
Button Cottage
Entire Place • 1 bedroom
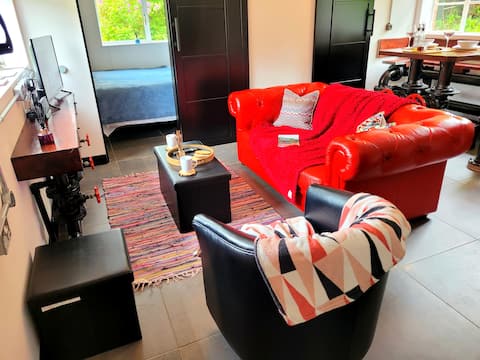
Quirky, Gorgeous Cottage near Iron Bridge!
Entire Place • 2 bedrooms
The Old Pumping Station Broseley, Ironbridge Gorge
Entire Place • 1 bedroom
Note: Performance varies based on location, size, amenities, seasonality, and management quality. Data reflects the past 12 months.
Top Performing Airbnb Hosts in Broseley (2025)
Learn from the best! This table showcases top-performing Airbnb hosts in Broseley based on the number of properties managed and estimated total revenue over the past year. Analyze their scale and performance metrics.
| Host Name | Properties | Grossing Revenue | Stay Reviews | Avg Rating |
|---|---|---|---|---|
| Stephen | 2 | $108,321 | 11 | 4.83/5.0 |
| Alice | 3 | $45,989 | 34 | 4.62/5.0 |
| Laura | 5 | $44,729 | 141 | 4.91/5.0 |
| Lisa | 1 | $25,253 | 109 | 4.99/5.0 |
| Judie | 1 | $24,658 | 33 | 4.94/5.0 |
| Karolina | 1 | $23,094 | 215 | 4.92/5.0 |
| Host #158103748 | 1 | $16,892 | 0 | 0.00/5.0 |
| Diana | 1 | $15,306 | 48 | 4.92/5.0 |
| Melissa | 1 | $15,165 | 20 | 4.95/5.0 |
| Janice | 1 | $15,131 | 70 | 4.96/5.0 |
Analyzing the strategies of top hosts, such as their property selection, pricing, and guest communication, can offer valuable lessons for optimizing your own Airbnb operations in Broseley.
Dive Deeper: Advanced Broseley STR Market Data (2025)
Ready to unlock more insights? AirROI provides access to advanced metrics and comprehensive Airbnb data for Broseley. Explore detailed analytics beyond this report to refine your investment strategy, optimize pricing, and maximize your vacation rental profits.
Explore Advanced MetricsBroseley Short-Term Rental Market Composition (2025): Property & Room Types
Room Type Distribution
Property Type Distribution
Market Composition Insights for Broseley
- The Broseley Airbnb market composition is heavily skewed towards Entire Home/Apt listings, which make up 85% of the 20 active rentals. This indicates strong guest preference for privacy and space.
- Looking at the property type distribution in Broseley, House properties are the most common (50%), reflecting the local real estate landscape.
- Houses represent a significant 50% portion, catering likely to families or larger groups.
- The presence of 15% Hotel/Boutique listings indicates integration with traditional hospitality.
Broseley Airbnb Room Capacity Analysis (2025): Bedroom Distribution
Distribution of Listings by Number of Bedrooms
Room Capacity Insights for Broseley
- The dominant room capacity in Broseley is 1 bedroom listings, making up 45% of the market. This suggests a strong demand for properties suitable for couples or solo travelers.
- Together, 1 bedroom and 2 bedrooms properties represent 70.0% of the active Airbnb listings in Broseley, indicating a high concentration in these sizes.
- A significant 25.0% of listings offer 3+ bedrooms, catering to larger groups and families seeking more space in Broseley.
Broseley Vacation Rental Guest Capacity Trends (2025)
Distribution of Listings by Guest Capacity
Guest Capacity Insights for Broseley
- The most common guest capacity trend in Broseley vacation rentals is listings accommodating 4 guests (35%). This suggests the primary traveler segment is likely small families or groups.
- Properties designed for 4 guests and 2 guests dominate the Broseley STR market, accounting for 65.0% of listings.
- 15.0% of properties accommodate 6+ guests, serving the market segment for larger families or group travel in Broseley.
- On average, properties in Broseley are equipped to host 3.6 guests.
Broseley Airbnb Booking Patterns (2025): Available vs. Booked Days
Available Days Distribution
Booked Days Distribution
Booking Pattern Insights for Broseley
- The most common availability pattern in Broseley falls within the 271-366 days range, representing 45% of listings. This suggests many properties have significant open periods on their calendars.
- Approximately 75.0% of listings show high availability (181+ days open annually), indicating potential for increased bookings or specific owner usage patterns.
- For booked days, the 31-90 days range is most frequent in Broseley (30%), reflecting common guest stay durations or potential owner blocking patterns.
- A notable 30.0% of properties secure long booking periods (181+ days booked per year), highlighting successful long-term rental strategies or significant owner usage.
Broseley Airbnb Minimum Stay Requirements Analysis
Distribution of Listings by Minimum Night Requirement
1 Night
1 listings
5.3% of total
2 Nights
6 listings
31.6% of total
3 Nights
4 listings
21.1% of total
4-6 Nights
2 listings
10.5% of total
7-29 Nights
1 listings
5.3% of total
30+ Nights
5 listings
26.3% of total
Key Insights
- The most prevalent minimum stay requirement in Broseley is 2 Nights, adopted by 31.6% of listings. This highlights the market's preference for shorter, flexible bookings.
- A significant segment (26.3%) caters to monthly stays (30+ nights) in Broseley, pointing to opportunities in the extended-stay market.
Recommendations
- Align with the market by considering a 2 Nights minimum stay, as 31.6% of Broseley hosts use this setting.
- If feasible, allowing 1-night stays, especially midweek or during low season, could capture last-minute bookings, as only 5.3% currently do.
- A 2-night minimum appears standard (31.6%). Consider this for weekends or peak periods.
- Explore offering discounts for stays of 30+ nights to attract the 26.3% of the market seeking extended stays.
- Adjust minimum nights based on seasonality – potentially shorter during low season and longer during peak demand periods in Broseley.
Broseley Airbnb Cancellation Policy Trends Analysis (2025)
Super Strict 30 Days
1 listings
5.6% of total
Flexible
4 listings
22.2% of total
Moderate
7 listings
38.9% of total
Firm
2 listings
11.1% of total
Strict
4 listings
22.2% of total
Cancellation Policy Insights for Broseley
- The prevailing Airbnb cancellation policy trend in Broseley is Moderate, used by 38.9% of listings.
- There's a relatively balanced mix between guest-friendly (61.1%) and stricter (33.3%) policies, offering choices for different guest needs.
Recommendations for Hosts
- Consider adopting a Moderate policy to align with the 38.9% market standard in Broseley.
- Regularly review your cancellation policy against competitors and market demand shifts in Broseley.
Broseley STR Booking Lead Time Analysis (2025)
Average Booking Lead Time by Month
Booking Lead Time Insights for Broseley
- The overall average booking lead time for vacation rentals in Broseley is 48 days.
- Guests book furthest in advance for stays during May (average 99 days), likely coinciding with peak travel demand or local events.
- The shortest booking windows occur for stays in February (average 18 days), indicating more last-minute travel plans during this time.
- Seasonally, Summer (66 days avg.) sees the longest lead times, while Winter (27 days avg.) has the shortest, reflecting typical travel planning cycles.
Recommendations for Hosts
- Use the overall average lead time (48 days) as a baseline for your pricing and availability strategy in Broseley.
- For May stays, consider implementing length-of-stay discounts or slightly higher rates for bookings made less than 99 days out to capitalize on advance planning.
- Target marketing efforts for the Summer season well in advance (at least 66 days) to capture early planners.
- Monitor your own booking lead times against these Broseley averages to identify opportunities for dynamic pricing adjustments.
Popular & Essential Airbnb Amenities in Broseley (2025)
Amenity Prevalence
Amenity Insights for Broseley
- Essential amenities in Broseley that guests expect include: Smoke alarm, TV, Free parking on premises, Wifi. Lacking these (any) could significantly impact bookings.
- Popular amenities like Heating, Kitchen, Essentials are common but not universal. Offering these can provide a competitive edge.
Recommendations for Hosts
- Ensure your listing includes all essential amenities for Broseley: Smoke alarm, TV, Free parking on premises, Wifi.
- Prioritize adding missing essentials: Free parking on premises, Wifi.
- Consider adding popular differentiators like Heating or Kitchen to increase appeal.
- Highlight unique or less common amenities you offer (e.g., hot tub, dedicated workspace, EV charger) in your listing description and photos.
- Regularly check competitor amenities in Broseley to stay competitive.
Broseley Airbnb Guest Demographics & Profile Analysis (2025)
Guest Profile Summary for Broseley
- The typical guest profile for Airbnb in Broseley consists of primarily domestic travelers (96%), often arriving from nearby England, typically belonging to the Post-2000s (Gen Z/Alpha) group (50%), primarily speaking English or French.
- Domestic travelers account for 95.9% of guests.
- Key international markets include United Kingdom (95.9%) and United States (1.4%).
- Top languages spoken are English (69.7%) followed by French (9.1%).
- A significant demographic segment is the Post-2000s (Gen Z/Alpha) group, representing 50% of guests.
Recommendations for Hosts
- Target domestic marketing efforts towards travelers from England and London.
- Tailor amenities and listing descriptions to appeal to the dominant Post-2000s (Gen Z/Alpha) demographic (e.g., highlight fast WiFi, smart home features, local guides).
- Highlight unique local experiences or amenities relevant to the primary guest profile.
- Consider seasonal promotions aligned with peak travel times for key origin markets.
Nearby Short-Term Rental Market Comparison
How does the Broseley Airbnb market stack up against its neighbors? Compare key performance metrics like average monthly revenue, ADR, and occupancy rates in surrounding areas to understand the broader regional STR landscape.
| Market | Active Properties | Monthly Revenue | Daily Rate | Avg. Occupancy |
|---|---|---|---|---|
| Englishcombe | 13 | $8,558 | $573.69 | 49% |
| Chew Magna | 14 | $6,649 | $399.59 | 46% |
| Lambourn | 11 | $6,081 | $669.47 | 28% |
| Long Sutton | 17 | $5,726 | $383.88 | 46% |
| Stoke St. Michael | 10 | $5,277 | $424.04 | 42% |
| Oldland Common | 13 | $5,093 | $355.47 | 43% |
| Crai | 20 | $4,799 | $371.85 | 46% |
| Dinton | 11 | $4,637 | $242.16 | 58% |
| Limpley Stoke | 10 | $4,598 | $523.47 | 52% |
| Flore | 10 | $4,534 | $347.03 | 40% |