Bristol Airbnb Market Analysis 2025: Short Term Rental Data & Vacation Rental Statistics in England, United Kingdom
Is Airbnb profitable in Bristol in 2025? Explore comprehensive Airbnb analytics for Bristol, England, United Kingdom to uncover income potential. This 2025 STR market report for Bristol, based on AirROI data from April 2024 to March 2025, reveals key trends in the bustling market of 1,678 active listings.
Whether you're considering an Airbnb investment in Bristol, optimizing your existing vacation rental, or exploring rental arbitrage opportunities, understanding the Bristol Airbnb data is crucial. Leveraging the low regulation environment is key to maximizing your short term rental income potential. Let's dive into the specifics.
Key Bristol Airbnb Performance Metrics Overview
Monthly Airbnb Revenue Variations & Income Potential in Bristol (2025)
Understanding the monthly revenue variations for Airbnb listings in Bristol is key to maximizing your short term rental income potential. Seasonality significantly impacts earnings. Our analysis, based on data from the past 12 months, shows that the peak revenue month for STRs in Bristol is typically May, while January often presents the lowest earnings, highlighting opportunities for strategic pricing adjustments during shoulder and low seasons. Explore the typical Airbnb income in Bristol across different performance tiers:
- Best-in-class properties (Top 10%) achieve $5,608+ monthly, often utilizing dynamic pricing and superior guest experiences.
- Strong performing properties (Top 25%) earn $3,716 or more, indicating effective management and desirable locations/amenities.
- Typical properties (Median) generate around $2,108 per month, representing the average market performance.
- Entry-level properties (Bottom 25%) see earnings around $1,068, often with potential for optimization.
Average Monthly Airbnb Earnings Trend in Bristol
Bristol Airbnb Occupancy Rate Trends (2025)
Maximize your bookings by understanding the Bristol STR occupancy trends. Seasonal demand shifts significantly influence how often properties are booked. Typically, Julysees the highest demand (peak season occupancy), while January experiences the lowest (low season). Effective strategies, like adjusting minimum stays or offering promotions, can boost occupancy during slower periods. Here's how different property tiers perform in Bristol:
- Best-in-class properties (Top 10%) achieve 87%+ occupancy, indicating high desirability and potentially optimized availability.
- Strong performing properties (Top 25%) maintain 73% or higher occupancy, suggesting good market fit and guest satisfaction.
- Typical properties (Median) have an occupancy rate around 53%.
- Entry-level properties (Bottom 25%) average 28% occupancy, potentially facing higher vacancy.
Average Monthly Occupancy Rate Trend in Bristol
Average Daily Rate (ADR) Airbnb Trends in Bristol (2025)
Effective short term rental pricing strategy in Bristol involves understanding monthly ADR fluctuations. The Average Daily Rate (ADR) for Airbnb in Bristol typically peaks in December and dips lowest during April. Leveraging Airbnb dynamic pricing tools or strategies based on this seasonality can significantly boost revenue. Here's a look at the typical nightly rates achieved:
- Best-in-class properties (Top 10%) command rates of $284+ per night, often due to premium features or locations.
- Strong performing properties (Top 25%) achieve nightly rates of $192 or more.
- Typical properties (Median) charge around $126 per night.
- Entry-level properties (Bottom 25%) earn around $75 per night.
Average Daily Rate (ADR) Trend by Month in Bristol
Get Live Bristol Market Intelligence 👇

Explore Real-time Analytics
Airbnb Seasonality Analysis & Trends in Bristol (2025)
Peak Season (May, July, June)
- Revenue averages $3,533 per month
- Occupancy rates average 54.2%
- Daily rates average $155
Shoulder Season
- Revenue averages $2,953 per month
- Occupancy maintains around 53.3%
- Daily rates hold near $162
Low Season (January, February, March)
- Revenue drops to average $2,127 per month
- Occupancy decreases to average 43.3%
- Daily rates adjust to average $167
Seasonality Insights for Bristol
- The Airbnb seasonality in Bristol shows moderate seasonality with distinct peak and low periods. While the sections above show seasonal averages, it's also insightful to look at the extremes:
- During the high season, the absolute peak month showcases Bristol's highest earning potential, with monthly revenues capable of climbing to $3,546, occupancy reaching a high of 61.3%, and ADRs peaking at $181.
- Conversely, the slowest single month of the year, typically falling within the low season, marks the market's lowest point. In this month, revenue might dip to $2,102, occupancy could drop to 40.9%, and ADRs may adjust down to $152.
- Understanding both the seasonal averages and these monthly peaks and troughs in revenue, occupancy, and ADR is crucial for maximizing your Airbnb profit potential in Bristol.
Seasonal Strategies for Maximizing Profit
- Peak Season: Maximize revenue through premium pricing and potentially longer minimum stays. Ensure high availability.
- Low Season: Offer competitive pricing, special promotions (e.g., extended stay discounts), and flexible cancellation policies. Target off-season travelers like remote workers or budget-conscious guests.
- Shoulder Seasons: Implement dynamic pricing that balances peak and low rates. Target weekend travelers or specific events. Offer slightly more flexible terms than peak season.
- Regularly analyze your own performance against these Bristol seasonality benchmarks and adjust your pricing and availability strategy accordingly.
Best Areas for Airbnb Investment in Bristol (2025)
Exploring the top neighborhoods for short-term rentals in Bristol? This section highlights key areas, outlining why they are attractive for hosts and guests, along with notable local attractions. Consider these locations based on your target guest profile and investment strategy.
| Neighborhood / Area | Why Host Here? (Target Guests & Appeal) | Key Attractions & Landmarks |
|---|---|---|
| Clifton | A picturesque area known for its Georgian architecture and the iconic Clifton Suspension Bridge. Popular with tourists seeking a scenic and cultural experience, with plenty of cafes and shops. | Clifton Suspension Bridge, Bristol Zoo Gardens, Clifton Village, Bristol Museum & Art Gallery, Bristol Observatory |
| Harbourside | A vibrant waterfront area perfect for those looking to enjoy the city's maritime history and lively atmosphere. Close to restaurants, bars, and attractions, it's a favorite for tourists. | M Shed Museum, Bristol Aquarium, SS Great Britain, Bristol Ferries, We the Curious Science Centre |
| Stokes Croft | Known for its bohemian vibe and street art, this area attracts a younger crowd and those interested in Bristol's creative scene. Excellent for trendy accommodations. | Street art, Bristol's independent shops, The Bristolian café, The Croft, The Canteen |
| Bedminster | A diverse neighborhood with a mix of old and new culture. Known for its markets and local events, it offers a more authentic Bristol experience. | North Street, East Street Market, Bedminster Farmers Market, The Tobacco Factory, Vauxhall Park |
| North Street | A bustling street filled with unique shops and eateries, ideal for those looking to experience the local life in Bristol. A great spot for visitors seeking a weekend getaway. | The Tobacco Factory Theatre, Viva Brazil, The Hen & Chicken, The Beer Emporium, The Old Bookshop |
| Redland | A charming suburb known for its parks and community feel. It's a great location for families and professionals, with easy access to the city center. | Durdham Downs, Redland Green, St John's Church, The Victoria Park, The White Lion Bar |
| City Centre | The commercial heart of Bristol with major shopping, dining, and entertainment. Popular with business travelers and tourists alike, it offers convenience and accessibility. | Cabot Circus, Bristol Shopping Quarter, St. Nicholas Market, Bristol Cathedral, Bristol Hippodrome |
| Westbury-on-Trym | A suburban village feel while still in the city. Attractive to families and those wanting a quieter lifestyle but within reach of the city amenities. | Westbury Village, Canford Park, Brockley Combe, The Greenway Centre, The Old Sow |
Understanding Airbnb License Requirements & STR Laws in Bristol (2025)
While Bristol, England, United Kingdom currently shows low STR regulations, specific Airbnb license requirements might still exist or change. Always verify the latest short term rental regulations and Airbnb license requirements directly with local government authorities for Bristol to ensure full compliance before hosting.
(Source: AirROI data, 2025, based on 0% licensed listings)
Top Performing Airbnb Properties in Bristol (2025)
Benchmark your potential! Explore examples of top-performing Airbnb properties in Bristolbased on Trailing Twelve Month (TTM) revenue. Analyze their characteristics, revenue, occupancy rate, and ADR to understand what drives success in this market.
higgihaus 7 Bed Sleeps up to 18 Big Groups
Entire Place • 7 bedrooms
higgihaus 3a 3b 8 Bed Big Hip Groups
Entire Place • 8 bedrooms

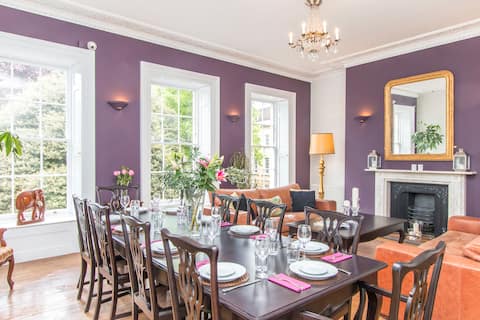
Entire Mansion 14 en suite bedrooms sleeps 34
Entire Place • 14 bedrooms
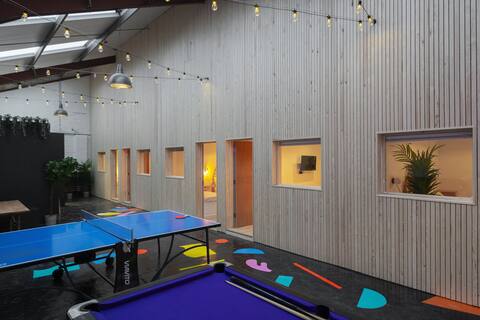
CoalShed - Exclusive Use - Sleep up to 16guests.
Entire Place • 5 bedrooms
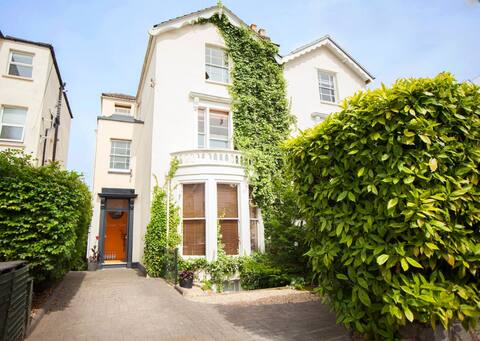
Georgian Townhouse, 3 Berkeley Square, Clifton
Entire Place • 7 bedrooms

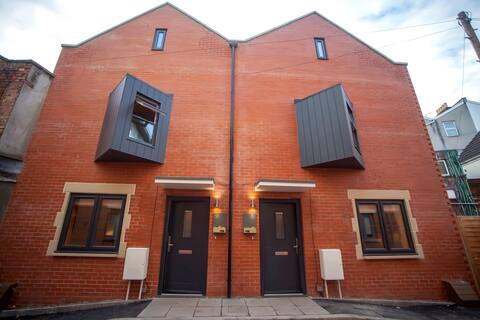
Redland Apartments- Group: Sleeps 12 with Parking
Entire Place • 5 bedrooms
Note: Performance varies based on location, size, amenities, seasonality, and management quality. Data reflects the past 12 months.
Top Performing Airbnb Hosts in Bristol (2025)
Learn from the best! This table showcases top-performing Airbnb hosts in Bristol based on the number of properties managed and estimated total revenue over the past year. Analyze their scale and performance metrics.
| Host Name | Properties | Grossing Revenue | Stay Reviews | Avg Rating |
|---|---|---|---|---|
| Hopewell | 128 | $3,128,600 | 6089 | 4.35/5.0 |
| Bespoke Cultural Escapes | 42 | $2,289,211 | 3882 | 4.88/5.0 |
| Luke | 16 | $1,770,172 | 713 | 4.82/5.0 |
| Your Apartment | 48 | $1,294,916 | 1136 | 4.35/5.0 |
| Pass The Property | 22 | $753,913 | 228 | 2.92/5.0 |
| Prescott Apartments | 21 | $743,522 | 205 | 3.34/5.0 |
| Emma | 9 | $721,445 | 263 | 4.72/5.0 |
| Mint Stays | 18 | $646,541 | 99 | 2.58/5.0 |
| Connor | 7 | $590,645 | 970 | 4.83/5.0 |
| Tina | 4 | $444,464 | 377 | 4.93/5.0 |
Analyzing the strategies of top hosts, such as their property selection, pricing, and guest communication, can offer valuable lessons for optimizing your own Airbnb operations in Bristol.
Dive Deeper: Advanced Bristol STR Market Data (2025)
Ready to unlock more insights? AirROI provides access to advanced metrics and comprehensive Airbnb data for Bristol. Explore detailed analytics beyond this report to refine your investment strategy, optimize pricing, and maximize your vacation rental profits.
Explore Advanced MetricsBristol Short-Term Rental Market Composition (2025): Property & Room Types
Room Type Distribution
Property Type Distribution
Market Composition Insights for Bristol
- The Bristol Airbnb market composition is heavily skewed towards Entire Home/Apt listings, which make up 72.2% of the 1,678 active rentals. This indicates strong guest preference for privacy and space.
- Looking at the property type distribution in Bristol, Apartment/Condo properties are the most common (55.1%), reflecting the local real estate landscape.
- Houses represent a significant 39.5% portion, catering likely to families or larger groups.
- Smaller segments like hotel/boutique, others, outdoor/unique, unique stays (combined 5.4%) offer potential for unique stay experiences.
Bristol Airbnb Room Capacity Analysis (2025): Bedroom Distribution
Distribution of Listings by Number of Bedrooms
Room Capacity Insights for Bristol
- The dominant room capacity in Bristol is 1 bedroom listings, making up 37% of the market. This suggests a strong demand for properties suitable for couples or solo travelers.
- Together, 1 bedroom and 2 bedrooms properties represent 60.2% of the active Airbnb listings in Bristol, indicating a high concentration in these sizes.
Bristol Vacation Rental Guest Capacity Trends (2025)
Distribution of Listings by Guest Capacity
Guest Capacity Insights for Bristol
- The most common guest capacity trend in Bristol vacation rentals is listings accommodating 2 guests (28.3%). This suggests the primary traveler segment is likely couples or solo travelers.
- Properties designed for 2 guests and 4 guests dominate the Bristol STR market, accounting for 50.2% of listings.
- 19.0% of properties accommodate 6+ guests, serving the market segment for larger families or group travel in Bristol.
- On average, properties in Bristol are equipped to host 3.1 guests.
Bristol Airbnb Booking Patterns (2025): Available vs. Booked Days
Available Days Distribution
Booked Days Distribution
Booking Pattern Insights for Bristol
- The most common availability pattern in Bristol falls within the 181-270 days range, representing 31.3% of listings. This suggests many properties have significant open periods on their calendars.
- Approximately 60.4% of listings show high availability (181+ days open annually), indicating potential for increased bookings or specific owner usage patterns.
- For booked days, the 91-180 days range is most frequent in Bristol (31.2%), reflecting common guest stay durations or potential owner blocking patterns.
- A notable 40.9% of properties secure long booking periods (181+ days booked per year), highlighting successful long-term rental strategies or significant owner usage.
Bristol Airbnb Minimum Stay Requirements Analysis
Distribution of Listings by Minimum Night Requirement
1 Night
419 listings
28% of total
2 Nights
532 listings
35.6% of total
3 Nights
137 listings
9.2% of total
4-6 Nights
87 listings
5.8% of total
7-29 Nights
93 listings
6.2% of total
30+ Nights
226 listings
15.1% of total
Key Insights
- The most prevalent minimum stay requirement in Bristol is 2 Nights, adopted by 35.6% of listings. This highlights the market's preference for shorter, flexible bookings.
- A strong majority (63.6%) of the Bristol Airbnb data shows acceptance of very short stays (1-2 nights), indicating a dynamic, high-turnover market.
- A significant segment (15.1%) caters to monthly stays (30+ nights) in Bristol, pointing to opportunities in the extended-stay market.
Recommendations
- Align with the market by considering a 2 Nights minimum stay, as 35.6% of Bristol hosts use this setting.
- If feasible, allowing 1-night stays, especially midweek or during low season, could capture last-minute bookings, as only 28% currently do.
- Explore offering discounts for stays of 30+ nights to attract the 15.1% of the market seeking extended stays.
- Adjust minimum nights based on seasonality – potentially shorter during low season and longer during peak demand periods in Bristol.
Bristol Airbnb Cancellation Policy Trends Analysis (2025)
Super Strict 30 Days
3 listings
0.2% of total
Non-refundable
2 listings
0.1% of total
Super Strict 60 Days
18 listings
1.2% of total
Refundable
8 listings
0.5% of total
Flexible
273 listings
18.7% of total
Moderate
489 listings
33.4% of total
Firm
244 listings
16.7% of total
Strict
425 listings
29.1% of total
Cancellation Policy Insights for Bristol
- The prevailing Airbnb cancellation policy trend in Bristol is Moderate, used by 33.4% of listings.
- There's a relatively balanced mix between guest-friendly (52.1%) and stricter (45.8%) policies, offering choices for different guest needs.
Recommendations for Hosts
- Consider adopting a Moderate policy to align with the 33.4% market standard in Bristol.
- Regularly review your cancellation policy against competitors and market demand shifts in Bristol.
Bristol STR Booking Lead Time Analysis (2025)
Average Booking Lead Time by Month
Booking Lead Time Insights for Bristol
- The overall average booking lead time for vacation rentals in Bristol is 43 days.
- Guests book furthest in advance for stays during June (average 62 days), likely coinciding with peak travel demand or local events.
- The shortest booking windows occur for stays in February (average 33 days), indicating more last-minute travel plans during this time.
- Seasonally, Summer (58 days avg.) sees the longest lead times, while Winter (38 days avg.) has the shortest, reflecting typical travel planning cycles.
Recommendations for Hosts
- Use the overall average lead time (43 days) as a baseline for your pricing and availability strategy in Bristol.
- For June stays, consider implementing length-of-stay discounts or slightly higher rates for bookings made less than 62 days out to capitalize on advance planning.
- Target marketing efforts for the Summer season well in advance (at least 58 days) to capture early planners.
- Monitor your own booking lead times against these Bristol averages to identify opportunities for dynamic pricing adjustments.
Popular & Essential Airbnb Amenities in Bristol (2025)
Amenity Prevalence
Amenity Insights for Bristol
- Essential amenities in Bristol that guests expect include: Wifi, Smoke alarm, Heating. Lacking these (any) could significantly impact bookings.
- Popular amenities like Hot water, Kitchen, Essentials are common but not universal. Offering these can provide a competitive edge.
Recommendations for Hosts
- Ensure your listing includes all essential amenities for Bristol: Wifi, Smoke alarm, Heating.
- Prioritize adding missing essentials: Wifi, Smoke alarm, Heating.
- Consider adding popular differentiators like Hot water or Kitchen to increase appeal.
- Highlight unique or less common amenities you offer (e.g., hot tub, dedicated workspace, EV charger) in your listing description and photos.
- Regularly check competitor amenities in Bristol to stay competitive.
Bristol Airbnb Guest Demographics & Profile Analysis (2025)
Guest Profile Summary for Bristol
- The typical guest profile for Airbnb in Bristol consists of primarily domestic travelers (78%), often arriving from nearby England, typically belonging to the Post-2000s (Gen Z/Alpha) group (50%), primarily speaking English or French.
- Domestic travelers account for 77.7% of guests.
- Key international markets include United Kingdom (77.7%) and United States (3.8%).
- Top languages spoken are English (59.3%) followed by French (9.9%).
- A significant demographic segment is the Post-2000s (Gen Z/Alpha) group, representing 50% of guests.
Recommendations for Hosts
- Target domestic marketing efforts towards travelers from England and London.
- Tailor amenities and listing descriptions to appeal to the dominant Post-2000s (Gen Z/Alpha) demographic (e.g., highlight fast WiFi, smart home features, local guides).
- Highlight unique local experiences or amenities relevant to the primary guest profile.
- Consider seasonal promotions aligned with peak travel times for key origin markets.
Nearby Short-Term Rental Market Comparison
How does the Bristol Airbnb market stack up against its neighbors? Compare key performance metrics like average monthly revenue, ADR, and occupancy rates in surrounding areas to understand the broader regional STR landscape.
| Market | Active Properties | Monthly Revenue | Daily Rate | Avg. Occupancy |
|---|---|---|---|---|
| Englishcombe | 13 | $8,558 | $573.69 | 49% |
| Chew Magna | 14 | $6,649 | $399.59 | 46% |
| Lambourn | 11 | $6,081 | $669.47 | 28% |
| Long Sutton | 17 | $5,726 | $383.88 | 46% |
| Stoke St. Michael | 10 | $5,277 | $424.04 | 42% |
| Winsham | 10 | $5,154 | $484.22 | 52% |
| Oldland Common | 13 | $5,093 | $355.47 | 43% |
| Crai | 20 | $4,799 | $371.85 | 46% |
| Dinton | 11 | $4,637 | $242.16 | 58% |
| Limpley Stoke | 10 | $4,598 | $523.47 | 52% |