Bowness-on-Solway Airbnb Market Analysis 2025: Short Term Rental Data & Vacation Rental Statistics in England, United Kingdom
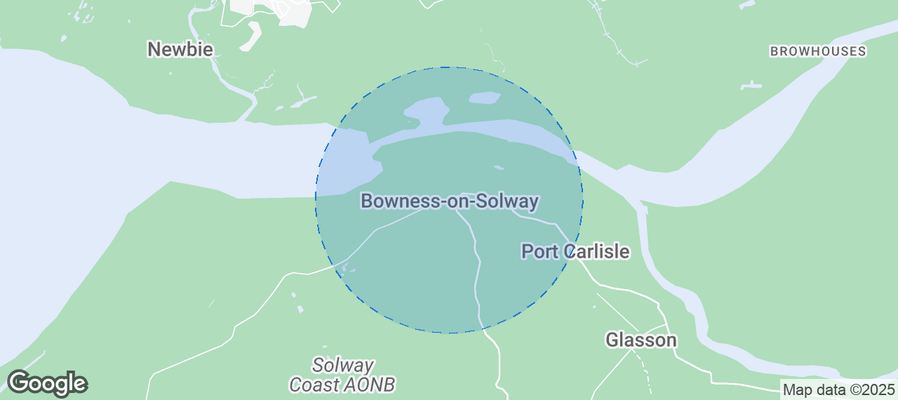
Is Airbnb profitable in Bowness-on-Solway in 2025? Explore comprehensive Airbnb analytics for Bowness-on-Solway, England, United Kingdom to uncover income potential. This 2025 STR market report for Bowness-on-Solway, based on AirROI data from April 2024 to March 2025, reveals key trends in the niche market of 20 active listings.
Whether you're considering an Airbnb investment in Bowness-on-Solway, optimizing your existing vacation rental, or exploring rental arbitrage opportunities, understanding the Bowness-on-Solway Airbnb data is crucial. Leveraging the low regulation environment is key to maximizing your short term rental income potential. Let's dive into the specifics.
Key Bowness-on-Solway Airbnb Performance Metrics Overview
Monthly Airbnb Revenue Variations & Income Potential in Bowness-on-Solway (2025)
Understanding the monthly revenue variations for Airbnb listings in Bowness-on-Solway is key to maximizing your short term rental income potential. Seasonality significantly impacts earnings. Our analysis, based on data from the past 12 months, shows that the peak revenue month for STRs in Bowness-on-Solway is typically August, while March often presents the lowest earnings, highlighting opportunities for strategic pricing adjustments during shoulder and low seasons. Explore the typical Airbnb income in Bowness-on-Solway across different performance tiers:
- Best-in-class properties (Top 10%) achieve $1,334+ monthly, often utilizing dynamic pricing and superior guest experiences.
- Strong performing properties (Top 25%) earn $972 or more, indicating effective management and desirable locations/amenities.
- Typical properties (Median) generate around $687 per month, representing the average market performance.
- Entry-level properties (Bottom 25%) see earnings around $451, often with potential for optimization.
Average Monthly Airbnb Earnings Trend in Bowness-on-Solway
Bowness-on-Solway Airbnb Occupancy Rate Trends (2025)
Maximize your bookings by understanding the Bowness-on-Solway STR occupancy trends. Seasonal demand shifts significantly influence how often properties are booked. Typically, Augustsees the highest demand (peak season occupancy), while March experiences the lowest (low season). Effective strategies, like adjusting minimum stays or offering promotions, can boost occupancy during slower periods. Here's how different property tiers perform in Bowness-on-Solway:
- Best-in-class properties (Top 10%) achieve 32%+ occupancy, indicating high desirability and potentially optimized availability.
- Strong performing properties (Top 25%) maintain 25% or higher occupancy, suggesting good market fit and guest satisfaction.
- Typical properties (Median) have an occupancy rate around 18%.
- Entry-level properties (Bottom 25%) average 13% occupancy, potentially facing higher vacancy.
Average Monthly Occupancy Rate Trend in Bowness-on-Solway
Average Daily Rate (ADR) Airbnb Trends in Bowness-on-Solway (2025)
Effective short term rental pricing strategy in Bowness-on-Solway involves understanding monthly ADR fluctuations. The Average Daily Rate (ADR) for Airbnb in Bowness-on-Solway typically peaks in July and dips lowest during March. Leveraging Airbnb dynamic pricing tools or strategies based on this seasonality can significantly boost revenue. Here's a look at the typical nightly rates achieved:
- Best-in-class properties (Top 10%) command rates of $216+ per night, often due to premium features or locations.
- Strong performing properties (Top 25%) achieve nightly rates of $155 or more.
- Typical properties (Median) charge around $125 per night.
- Entry-level properties (Bottom 25%) earn around $112 per night.
Average Daily Rate (ADR) Trend by Month in Bowness-on-Solway
Get Live Bowness-on-Solway Market Intelligence 👇
Explore Real-time Analytics
Airbnb Seasonality Analysis & Trends in Bowness-on-Solway (2025)
Peak Season (August, July, June)
- Revenue averages $1,115 per month
- Occupancy rates average 29.0%
- Daily rates average $144
Shoulder Season
- Revenue averages $774 per month
- Occupancy maintains around 20.4%
- Daily rates hold near $132
Low Season (January, March, October)
- Revenue drops to average $352 per month
- Occupancy decreases to average 9.8%
- Daily rates adjust to average $128
Seasonality Insights for Bowness-on-Solway
- The Airbnb seasonality in Bowness-on-Solway shows highly seasonal trends requiring careful strategy. While the sections above show seasonal averages, it's also insightful to look at the extremes:
- During the high season, the absolute peak month showcases Bowness-on-Solway's highest earning potential, with monthly revenues capable of climbing to $1,233, occupancy reaching a high of 32.8%, and ADRs peaking at $145.
- Conversely, the slowest single month of the year, typically falling within the low season, marks the market's lowest point. In this month, revenue might dip to $245, occupancy could drop to 7.4%, and ADRs may adjust down to $118.
- Understanding both the seasonal averages and these monthly peaks and troughs in revenue, occupancy, and ADR is crucial for maximizing your Airbnb profit potential in Bowness-on-Solway.
Seasonal Strategies for Maximizing Profit
- Peak Season: Maximize revenue through premium pricing and potentially longer minimum stays. Ensure high availability.
- Low Season: Offer competitive pricing, special promotions (e.g., extended stay discounts), and flexible cancellation policies. Target off-season travelers like remote workers or budget-conscious guests.
- Shoulder Seasons: Implement dynamic pricing that balances peak and low rates. Target weekend travelers or specific events. Offer slightly more flexible terms than peak season.
- Regularly analyze your own performance against these Bowness-on-Solway seasonality benchmarks and adjust your pricing and availability strategy accordingly.
Best Areas for Airbnb Investment in Bowness-on-Solway (2025)
Exploring the top neighborhoods for short-term rentals in Bowness-on-Solway? This section highlights key areas, outlining why they are attractive for hosts and guests, along with notable local attractions. Consider these locations based on your target guest profile and investment strategy.
| Neighborhood / Area | Why Host Here? (Target Guests & Appeal) | Key Attractions & Landmarks |
|---|---|---|
| Bowness-on-Solway Village | Charming historic village located at the northern end of Hadrian's Wall. Offers unique historical experiences and scenic views of the Solway Firth, attracting visitors interested in history and nature. | Hadrian's Wall, Solway Firth, Bowness-on-Solway Nature Reserve, Bowness Farm Shop, Historic pubs and restaurants |
| Denton Hall | A peaceful area with beautiful countryside surroundings, perfect for walkers and nature lovers. Its proximity to Hadrian's Wall makes it an attractive spot for visitors looking for outdoor adventures. | Hadrian's Wall Path, Cycle routes, Denton Hall, Scenic countryside walks, Wildlife spotting |
| Bowness Dunes | This area features stunning sand dunes and beaches along the Solway coast, ideal for beach-goers and nature enthusiasts, providing a relaxing escape from urban life. | Bowness Dunes, Solway Coastal Path, Birdwatching, Picnic spots, Seaside activities |
| Glencross | A rural area known for its scenic landscapes and tranquility. A great retreat for guests looking for peaceful getaways and outdoor activities such as hiking and fishing. | Scenic views, Outdoor activities, Nature trails, Local wildlife, Rural charm |
| Burgh-by-Sands | A quaint village with historical significance, featuring local historic sites and charming rural England vibes. Perfect for travelers interested in agriculture and local culture. | St. Michael's Church, Historical landmarks, Farm shops, Countryside walks, Local festivals |
| Carlisle | The nearest city providing urban amenities and attractions. Visitors can enjoy shopping, dining, and cultural experiences with easy access to Bowness-on-Solway. | Carlisle Castle, Tullie House Museum, Carlisle Cathedral, Shopping centers, Local restaurants |
| Silloth-on-Solway | A seaside town that offers a mix of beach activities and stunning views of the Solway Firth, making it popular for family holidays and seaside enjoyment. | Silloth Beach, Giant's Trail, Golf course, Local parks, Water sports |
| Abbeytown | A small village known for its friendly community and historic sites. Offers a nice atmosphere for short-term stays focused on relaxation and countryside experiences. | Abbey ruins, Local pubs, Countryside walks, Community events, Rural heritage |
Understanding Airbnb License Requirements & STR Laws in Bowness-on-Solway (2025)
While Bowness-on-Solway, England, United Kingdom currently shows low STR regulations, specific Airbnb license requirements might still exist or change. Always verify the latest short term rental regulations and Airbnb license requirements directly with local government authorities for Bowness-on-Solway to ensure full compliance before hosting.
(Source: AirROI data, 2025, finding no licensed listings among those analyzed)
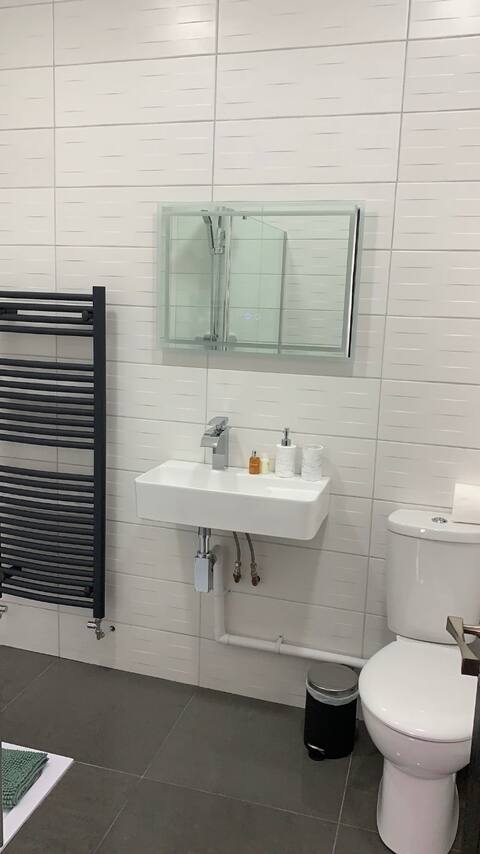
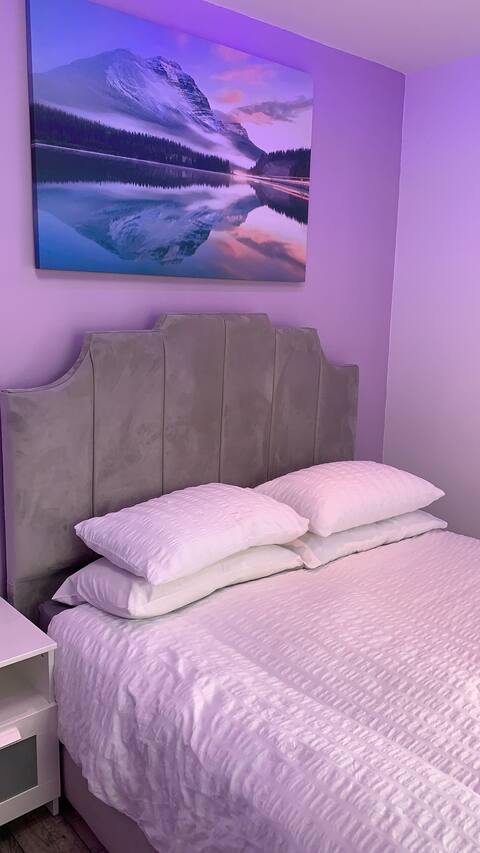
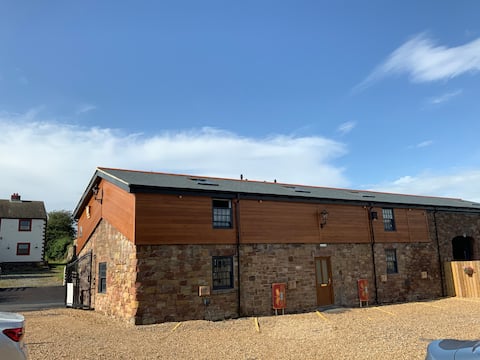
Top Performing Airbnb Properties in Bowness-on-Solway (2025)
Benchmark your potential! Explore examples of top-performing Airbnb properties in Bowness-on-Solwaybased on Trailing Twelve Month (TTM) revenue. Analyze their characteristics, revenue, occupancy rate, and ADR to understand what drives success in this market.
En-suite Family Room with breakfast (sleeps 4)
Private Room • N/A
Tulip - Family Room - Bed & Breakfast
Private Room • N/A
Haaf Netters Rest
Entire Place • 1 bedroom

Family Room - Sleeps 5 - Bed & Breakfast
Private Room • 1 bedroom

Tiberius Claudius Ceaser Augustus Germanicus Suite
Entire Place • N/A
Hannah's Hide The Garrison Campsite Hadrians Wall
Entire Place • N/A
Note: Performance varies based on location, size, amenities, seasonality, and management quality. Data reflects the past 12 months.
Top Performing Airbnb Hosts in Bowness-on-Solway (2025)
Learn from the best! This table showcases top-performing Airbnb hosts in Bowness-on-Solway based on the number of properties managed and estimated total revenue over the past year. Analyze their scale and performance metrics.
| Host Name | Properties | Grossing Revenue | Stay Reviews | Avg Rating |
|---|---|---|---|---|
| Stella | 19 | $154,083 | 713 | 4.26/5.0 |
| Host #124017842 | 1 | $3,654 | 0 | 0.00/5.0 |
Analyzing the strategies of top hosts, such as their property selection, pricing, and guest communication, can offer valuable lessons for optimizing your own Airbnb operations in Bowness-on-Solway.
Dive Deeper: Advanced Bowness-on-Solway STR Market Data (2025)
Ready to unlock more insights? AirROI provides access to advanced metrics and comprehensive Airbnb data for Bowness-on-Solway. Explore detailed analytics beyond this report to refine your investment strategy, optimize pricing, and maximize your vacation rental profits.
Explore Advanced MetricsBowness-on-Solway Short-Term Rental Market Composition (2025): Property & Room Types
Room Type Distribution
Property Type Distribution
Market Composition Insights for Bowness-on-Solway
- The Bowness-on-Solway Airbnb market composition is heavily skewed towards Entire Home/Apt listings, which make up 45% of the 20 active rentals. This indicates strong guest preference for privacy and space.
- However, a notable 45% share for Private Rooms suggests opportunities for budget-conscious travelers or hosts renting out spare rooms.
- Looking at the property type distribution in Bowness-on-Solway, Hotel/Boutique properties are the most common (55%), reflecting the local real estate landscape.
- The presence of 55% Hotel/Boutique listings indicates integration with traditional hospitality.
Bowness-on-Solway Airbnb Room Capacity Analysis (2025): Bedroom Distribution
Distribution of Listings by Number of Bedrooms
Room Capacity Insights for Bowness-on-Solway
- The dominant room capacity in Bowness-on-Solway is 1 bedroom listings, making up 40% of the market. This suggests a strong demand for properties suitable for couples or solo travelers.
- Together, 1 bedroom and 3 bedrooms properties represent 45.0% of the active Airbnb listings in Bowness-on-Solway, indicating a high concentration in these sizes.
- Listings with 3+ bedrooms (5.0%) represent a smaller niche, potentially indicating an underserved market for larger group accommodations in Bowness-on-Solway.
Bowness-on-Solway Vacation Rental Guest Capacity Trends (2025)
Distribution of Listings by Guest Capacity
Guest Capacity Insights for Bowness-on-Solway
- The most common guest capacity trend in Bowness-on-Solway vacation rentals is listings accommodating 2 guests (30%). This suggests the primary traveler segment is likely couples or solo travelers.
- Properties designed for 2 guests and 3 guests dominate the Bowness-on-Solway STR market, accounting for 50.0% of listings.
- On average, properties in Bowness-on-Solway are equipped to host 1.8 guests.
Bowness-on-Solway Airbnb Booking Patterns (2025): Available vs. Booked Days
Available Days Distribution
Booked Days Distribution
Booking Pattern Insights for Bowness-on-Solway
- The most common availability pattern in Bowness-on-Solway falls within the 271-366 days range, representing 90% of listings. This suggests many properties have significant open periods on their calendars.
- Approximately 100.0% of listings show high availability (181+ days open annually), indicating potential for increased bookings or specific owner usage patterns.
- For booked days, the 31-90 days range is most frequent in Bowness-on-Solway (80%), reflecting common guest stay durations or potential owner blocking patterns.
Bowness-on-Solway Airbnb Minimum Stay Requirements Analysis
Distribution of Listings by Minimum Night Requirement
1 Night
19 listings
95% of total
2 Nights
1 listings
5% of total
Key Insights
- The most prevalent minimum stay requirement in Bowness-on-Solway is 1 Night, adopted by 95% of listings. This highlights the market's preference for shorter, flexible bookings.
- A strong majority (100.0%) of the Bowness-on-Solway Airbnb data shows acceptance of very short stays (1-2 nights), indicating a dynamic, high-turnover market.
Recommendations
- Align with the market by considering a 1 Night minimum stay, as 95% of Bowness-on-Solway hosts use this setting.
- Adjust minimum nights based on seasonality – potentially shorter during low season and longer during peak demand periods in Bowness-on-Solway.
Bowness-on-Solway Airbnb Cancellation Policy Trends Analysis (2025)
Moderate
9 listings
50% of total
Strict
9 listings
50% of total
Cancellation Policy Insights for Bowness-on-Solway
- The prevailing Airbnb cancellation policy trend in Bowness-on-Solway is Moderate, used by 50% of listings.
- There's a relatively balanced mix between guest-friendly (50.0%) and stricter (50.0%) policies, offering choices for different guest needs.
Recommendations for Hosts
- Consider adopting a Moderate policy to align with the 50% market standard in Bowness-on-Solway.
- With 50% using Strict terms, this is a viable option in Bowness-on-Solway, particularly for high-value properties or during peak demand periods.
- Regularly review your cancellation policy against competitors and market demand shifts in Bowness-on-Solway.
Bowness-on-Solway STR Booking Lead Time Analysis (2025)
Average Booking Lead Time by Month
Booking Lead Time Insights for Bowness-on-Solway
- The overall average booking lead time for vacation rentals in Bowness-on-Solway is 57 days.
- Guests book furthest in advance for stays during May (average 103 days), likely coinciding with peak travel demand or local events.
- The shortest booking windows occur for stays in December (average 30 days), indicating more last-minute travel plans during this time.
- Seasonally, Spring (77 days avg.) sees the longest lead times, while Fall (42 days avg.) has the shortest, reflecting typical travel planning cycles.
Recommendations for Hosts
- Use the overall average lead time (57 days) as a baseline for your pricing and availability strategy in Bowness-on-Solway.
- For May stays, consider implementing length-of-stay discounts or slightly higher rates for bookings made less than 103 days out to capitalize on advance planning.
- Target marketing efforts for the Spring season well in advance (at least 77 days) to capture early planners.
- Monitor your own booking lead times against these Bowness-on-Solway averages to identify opportunities for dynamic pricing adjustments.
Popular & Essential Airbnb Amenities in Bowness-on-Solway (2025)
Amenity Prevalence
Amenity Insights for Bowness-on-Solway
- Essential amenities in Bowness-on-Solway that guests expect include: Free parking on premises, Wifi, Essentials, Gym, Smoke alarm. Lacking these (any) could significantly impact bookings.
- Popular amenities like Hot water, TV, Carbon monoxide alarm are common but not universal. Offering these can provide a competitive edge.
Recommendations for Hosts
- Ensure your listing includes all essential amenities for Bowness-on-Solway: Free parking on premises, Wifi, Essentials, Gym, Smoke alarm.
- Prioritize adding missing essentials: Gym, Smoke alarm.
- Consider adding popular differentiators like Hot water or TV to increase appeal.
- Highlight unique or less common amenities you offer (e.g., hot tub, dedicated workspace, EV charger) in your listing description and photos.
- Regularly check competitor amenities in Bowness-on-Solway to stay competitive.
Bowness-on-Solway Airbnb Guest Demographics & Profile Analysis (2025)
Guest Profile Summary for Bowness-on-Solway
- The typical guest profile for Airbnb in Bowness-on-Solway consists of primarily domestic travelers (78%), often arriving from nearby England, typically belonging to the Post-2000s (Gen Z/Alpha) group (50%), primarily speaking English or German.
- Domestic travelers account for 78.0% of guests.
- Key international markets include United Kingdom (78%) and Germany (3.7%).
- Top languages spoken are English (68.5%) followed by German (8.2%).
- A significant demographic segment is the Post-2000s (Gen Z/Alpha) group, representing 50% of guests.
Recommendations for Hosts
- Target domestic marketing efforts towards travelers from England and Newcastle upon Tyne.
- Tailor amenities and listing descriptions to appeal to the dominant Post-2000s (Gen Z/Alpha) demographic (e.g., highlight fast WiFi, smart home features, local guides).
- Highlight unique local experiences or amenities relevant to the primary guest profile.
- Consider seasonal promotions aligned with peak travel times for key origin markets.
Nearby Short-Term Rental Market Comparison
How does the Bowness-on-Solway Airbnb market stack up against its neighbors? Compare key performance metrics like average monthly revenue, ADR, and occupancy rates in surrounding areas to understand the broader regional STR landscape.
| Market | Active Properties | Monthly Revenue | Daily Rate | Avg. Occupancy |
|---|---|---|---|---|
| Galston | 11 | $7,951 | $676.77 | 46% |
| Gorebridge | 12 | $6,209 | $493.62 | 54% |
| Cartmel Fell | 17 | $4,719 | $331.68 | 52% |
| Casterton | 11 | $4,578 | $300.82 | 51% |
| Cark | 11 | $4,540 | $885.21 | 31% |
| City of Edinburgh | 4,312 | $4,528 | $274.67 | 61% |
| Eglwys-bach | 16 | $4,413 | $315.23 | 52% |
| Waverton | 16 | $4,358 | $444.20 | 33% |
| Watermillock | 16 | $4,281 | $274.03 | 50% |
| Kielder | 12 | $4,215 | $329.21 | 53% |