Borough of Wyre Airbnb Market Analysis 2025: Short Term Rental Data & Vacation Rental Statistics in England, United Kingdom
Is Airbnb profitable in Borough of Wyre in 2025? Explore comprehensive Airbnb analytics for Borough of Wyre, England, United Kingdom to uncover income potential. This 2025 STR market report for Borough of Wyre, based on AirROI data from April 2024 to March 2025, reveals key trends in the market of 215 active listings.
Whether you're considering an Airbnb investment in Borough of Wyre, optimizing your existing vacation rental, or exploring rental arbitrage opportunities, understanding the Borough of Wyre Airbnb data is crucial. Leveraging the low regulation environment is key to maximizing your short term rental income potential. Let's dive into the specifics.
Key Borough of Wyre Airbnb Performance Metrics Overview
Monthly Airbnb Revenue Variations & Income Potential in Borough of Wyre (2025)
Understanding the monthly revenue variations for Airbnb listings in Borough of Wyre is key to maximizing your short term rental income potential. Seasonality significantly impacts earnings. Our analysis, based on data from the past 12 months, shows that the peak revenue month for STRs in Borough of Wyre is typically August, while March often presents the lowest earnings, highlighting opportunities for strategic pricing adjustments during shoulder and low seasons. Explore the typical Airbnb income in Borough of Wyre across different performance tiers:
- Best-in-class properties (Top 10%) achieve $6,036+ monthly, often utilizing dynamic pricing and superior guest experiences.
- Strong performing properties (Top 25%) earn $3,845 or more, indicating effective management and desirable locations/amenities.
- Typical properties (Median) generate around $2,207 per month, representing the average market performance.
- Entry-level properties (Bottom 25%) see earnings around $1,089, often with potential for optimization.
Average Monthly Airbnb Earnings Trend in Borough of Wyre
Borough of Wyre Airbnb Occupancy Rate Trends (2025)
Maximize your bookings by understanding the Borough of Wyre STR occupancy trends. Seasonal demand shifts significantly influence how often properties are booked. Typically, Augustsees the highest demand (peak season occupancy), while March experiences the lowest (low season). Effective strategies, like adjusting minimum stays or offering promotions, can boost occupancy during slower periods. Here's how different property tiers perform in Borough of Wyre:
- Best-in-class properties (Top 10%) achieve 83%+ occupancy, indicating high desirability and potentially optimized availability.
- Strong performing properties (Top 25%) maintain 65% or higher occupancy, suggesting good market fit and guest satisfaction.
- Typical properties (Median) have an occupancy rate around 41%.
- Entry-level properties (Bottom 25%) average 20% occupancy, potentially facing higher vacancy.
Average Monthly Occupancy Rate Trend in Borough of Wyre
Average Daily Rate (ADR) Airbnb Trends in Borough of Wyre (2025)
Effective short term rental pricing strategy in Borough of Wyre involves understanding monthly ADR fluctuations. The Average Daily Rate (ADR) for Airbnb in Borough of Wyre typically peaks in December and dips lowest during April. Leveraging Airbnb dynamic pricing tools or strategies based on this seasonality can significantly boost revenue. Here's a look at the typical nightly rates achieved:
- Best-in-class properties (Top 10%) command rates of $321+ per night, often due to premium features or locations.
- Strong performing properties (Top 25%) achieve nightly rates of $225 or more.
- Typical properties (Median) charge around $159 per night.
- Entry-level properties (Bottom 25%) earn around $120 per night.
Average Daily Rate (ADR) Trend by Month in Borough of Wyre
Get Live Borough of Wyre Market Intelligence 👇

Explore Real-time Analytics
Airbnb Seasonality Analysis & Trends in Borough of Wyre (2025)
Peak Season (August, July, May)
- Revenue averages $3,450 per month
- Occupancy rates average 50.3%
- Daily rates average $202
Shoulder Season
- Revenue averages $2,863 per month
- Occupancy maintains around 43.6%
- Daily rates hold near $202
Low Season (January, February, March)
- Revenue drops to average $2,170 per month
- Occupancy decreases to average 36.8%
- Daily rates adjust to average $204
Seasonality Insights for Borough of Wyre
- The Airbnb seasonality in Borough of Wyre shows moderate seasonality with distinct peak and low periods. While the sections above show seasonal averages, it's also insightful to look at the extremes:
- During the high season, the absolute peak month showcases Borough of Wyre's highest earning potential, with monthly revenues capable of climbing to $3,680, occupancy reaching a high of 54.2%, and ADRs peaking at $215.
- Conversely, the slowest single month of the year, typically falling within the low season, marks the market's lowest point. In this month, revenue might dip to $2,064, occupancy could drop to 34.8%, and ADRs may adjust down to $194.
- Understanding both the seasonal averages and these monthly peaks and troughs in revenue, occupancy, and ADR is crucial for maximizing your Airbnb profit potential in Borough of Wyre.
Seasonal Strategies for Maximizing Profit
- Peak Season: Maximize revenue through premium pricing and potentially longer minimum stays. Ensure high availability.
- Low Season: Offer competitive pricing, special promotions (e.g., extended stay discounts), and flexible cancellation policies. Target off-season travelers like remote workers or budget-conscious guests.
- Shoulder Seasons: Implement dynamic pricing that balances peak and low rates. Target weekend travelers or specific events. Offer slightly more flexible terms than peak season.
- Regularly analyze your own performance against these Borough of Wyre seasonality benchmarks and adjust your pricing and availability strategy accordingly.
Best Areas for Airbnb Investment in Borough of Wyre (2025)
Exploring the top neighborhoods for short-term rentals in Borough of Wyre? This section highlights key areas, outlining why they are attractive for hosts and guests, along with notable local attractions. Consider these locations based on your target guest profile and investment strategy.
| Neighborhood / Area | Why Host Here? (Target Guests & Appeal) | Key Attractions & Landmarks |
|---|---|---|
| Cleveleys | A charming seaside town known for its picturesque promenade and family-friendly beaches. Cleveleys attracts visitors looking for a relaxing coastal getaway with various local attractions. | Cleveleys Beach, The Promenade, Thornton Cleveleys, Maritime Festival, The Cleveleys Plaza |
| Fleetwood | A historic port town with a rich maritime heritage and lovely coastal views. Fleetwood is popular with families and tourists seeking outdoor activities and great local seafood. | Fleetwood Market, Freeport Fleetwood, Fleetwood Beach, Marine Hall, Wyre Light |
| Lytham St Annes | A beautiful coastal destination known for its stunning beaches, golf courses, and charming town center. Appeals to a mix of families and golf enthusiasts. | Lytham Green, St Anne's Pier, Royal Lytham & St Annes Golf Club, Lytham Windmill, The Lowther Pavilion |
| Poulton-le-Fylde | A quaint market town with a vibrant community, historic buildings, and charming streets. It attracts visitors interested in local culture and amenities. | Poulton Market, St Chad's Church, The Market Hall, Poulton's Miniature Village, The Factory |
| Wyre Estuary Country Park | A beautiful natural park that offers scenic views and outdoor activities. Great for nature lovers and those looking to escape the city for a while. | Nature Trails, Bird Watching, Cycling Routes, Picnic Areas, Wyre Estuary |
| Thornton | A suburban area with easy access to nearby attractions and a good local community. Ideal for visitors wanting tranquility while being close to the coast. | Thornton Park, Saint Tydfil's Church, Local Shops, Parks, Community Events |
| Great Eccleston | A picturesque village that offers a glimpse into rural life in Lancashire. Ideal for those seeking a peaceful retreat and local cuisine. | Great Eccleston Market, The Village Green, Local Pubs, Farmers' Markets, Countryside Walks |
| Blackpool (nearby) | Just a short distance away, Blackpool is famed for its entertainment and tourist attractions. Ideal for those looking for more vibrant nightlife and adventures. | Blackpool Tower, Blackpool Pleasure Beach, The Golden Mile, Sea Life Blackpool, Blackpool Illuminations |
Understanding Airbnb License Requirements & STR Laws in Borough of Wyre (2025)
While Borough of Wyre, England, United Kingdom currently shows low STR regulations, specific Airbnb license requirements might still exist or change. Always verify the latest short term rental regulations and Airbnb license requirements directly with local government authorities for Borough of Wyre to ensure full compliance before hosting.
(Source: AirROI data, 2025, finding no licensed listings among those analyzed)
Top Performing Airbnb Properties in Borough of Wyre (2025)
Benchmark your potential! Explore examples of top-performing Airbnb properties in Borough of Wyrebased on Trailing Twelve Month (TTM) revenue. Analyze their characteristics, revenue, occupancy rate, and ADR to understand what drives success in this market.

Coastal Escape 'The Hub' Beachfront Bliss house
Entire Place • 2 bedrooms
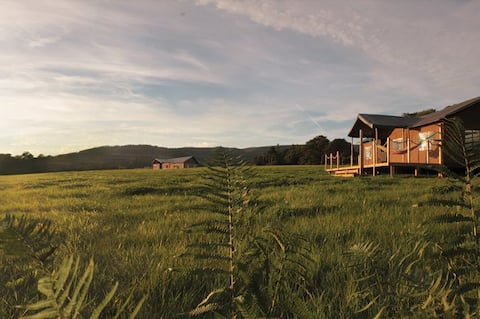
Bleasdale at Lantern and Larks
Entire Place • 15 bedrooms
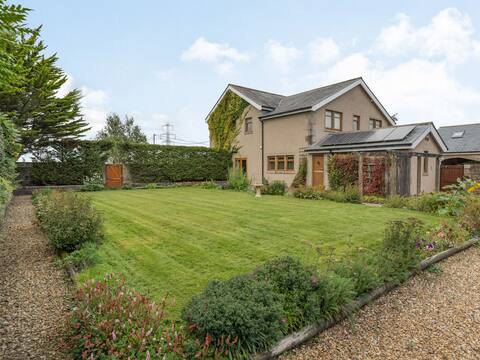
Highfield Cottage
Entire Place • 5 bedrooms

Brookside Cottage
Entire Place • 4 bedrooms
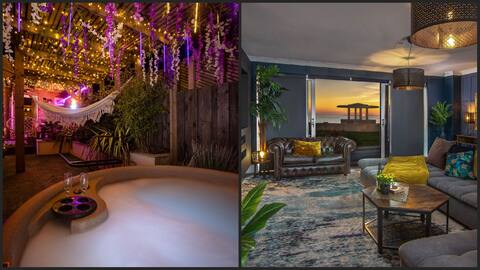
Seaside Serenity 'The Pad' Beach Retreat
Entire Place • 4 bedrooms
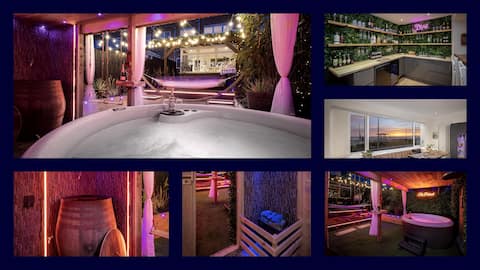
Seaside Oasis'The Retreat' Garden Spa & Hot Tub
Entire Place • 3 bedrooms
Note: Performance varies based on location, size, amenities, seasonality, and management quality. Data reflects the past 12 months.
Top Performing Airbnb Hosts in Borough of Wyre (2025)
Learn from the best! This table showcases top-performing Airbnb hosts in Borough of Wyre based on the number of properties managed and estimated total revenue over the past year. Analyze their scale and performance metrics.
| Host Name | Properties | Grossing Revenue | Stay Reviews | Avg Rating |
|---|---|---|---|---|
| Cottages | 20 | $804,628 | 145 | 4.04/5.0 |
| Laura Jane | 6 | $517,979 | 1637 | 4.96/5.0 |
| Adam | 8 | $400,977 | 237 | 4.30/5.0 |
| Host #290275086 | 5 | $187,208 | 0 | 0.00/5.0 |
| Gina | 4 | $161,265 | 274 | 3.65/5.0 |
| John | 2 | $155,191 | 207 | 4.91/5.0 |
| Charles Alexander Short Stay | 10 | $143,001 | 134 | 4.17/5.0 |
| Horse Park Hideaway | 2 | $113,247 | 136 | 4.94/5.0 |
| Peter | 3 | $97,727 | 294 | 4.90/5.0 |
| Jessica | 3 | $96,389 | 47 | 4.56/5.0 |
Analyzing the strategies of top hosts, such as their property selection, pricing, and guest communication, can offer valuable lessons for optimizing your own Airbnb operations in Borough of Wyre.
Dive Deeper: Advanced Borough of Wyre STR Market Data (2025)
Ready to unlock more insights? AirROI provides access to advanced metrics and comprehensive Airbnb data for Borough of Wyre. Explore detailed analytics beyond this report to refine your investment strategy, optimize pricing, and maximize your vacation rental profits.
Explore Advanced MetricsBorough of Wyre Short-Term Rental Market Composition (2025): Property & Room Types
Room Type Distribution
Property Type Distribution
Market Composition Insights for Borough of Wyre
- The Borough of Wyre Airbnb market composition is heavily skewed towards Entire Home/Apt listings, which make up 94.9% of the 215 active rentals. This indicates strong guest preference for privacy and space.
- Looking at the property type distribution in Borough of Wyre, House properties are the most common (49.3%), reflecting the local real estate landscape.
- Houses represent a significant 49.3% portion, catering likely to families or larger groups.
- Smaller segments like hotel/boutique, unique stays (combined 6.0%) offer potential for unique stay experiences.
Borough of Wyre Airbnb Room Capacity Analysis (2025): Bedroom Distribution
Distribution of Listings by Number of Bedrooms
Room Capacity Insights for Borough of Wyre
- The dominant room capacity in Borough of Wyre is 2 bedrooms listings, making up 31.2% of the market. This suggests a strong demand for properties suitable for couples or solo travelers.
- Together, 2 bedrooms and 1 bedroom properties represent 58.2% of the active Airbnb listings in Borough of Wyre, indicating a high concentration in these sizes.
- A significant 36.8% of listings offer 3+ bedrooms, catering to larger groups and families seeking more space in Borough of Wyre.
Borough of Wyre Vacation Rental Guest Capacity Trends (2025)
Distribution of Listings by Guest Capacity
Guest Capacity Insights for Borough of Wyre
- The most common guest capacity trend in Borough of Wyre vacation rentals is listings accommodating 4 guests (29.8%). This suggests the primary traveler segment is likely small families or groups.
- Properties designed for 4 guests and 6 guests dominate the Borough of Wyre STR market, accounting for 51.7% of listings.
- 41.0% of properties accommodate 6+ guests, serving the market segment for larger families or group travel in Borough of Wyre.
- On average, properties in Borough of Wyre are equipped to host 4.7 guests.
Borough of Wyre Airbnb Booking Patterns (2025): Available vs. Booked Days
Available Days Distribution
Booked Days Distribution
Booking Pattern Insights for Borough of Wyre
- The most common availability pattern in Borough of Wyre falls within the 271-366 days range, representing 33.5% of listings. This suggests many properties have significant open periods on their calendars.
- Approximately 63.3% of listings show high availability (181+ days open annually), indicating potential for increased bookings or specific owner usage patterns.
- For booked days, the 91-180 days range is most frequent in Borough of Wyre (30.7%), reflecting common guest stay durations or potential owner blocking patterns.
- A notable 36.8% of properties secure long booking periods (181+ days booked per year), highlighting successful long-term rental strategies or significant owner usage.
Borough of Wyre Airbnb Minimum Stay Requirements Analysis
Distribution of Listings by Minimum Night Requirement
1 Night
56 listings
28.1% of total
2 Nights
101 listings
50.8% of total
3 Nights
15 listings
7.5% of total
4-6 Nights
5 listings
2.5% of total
30+ Nights
22 listings
11.1% of total
Key Insights
- The most prevalent minimum stay requirement in Borough of Wyre is 2 Nights, adopted by 50.8% of listings. This highlights the market's preference for shorter, flexible bookings.
- A strong majority (78.9%) of the Borough of Wyre Airbnb data shows acceptance of very short stays (1-2 nights), indicating a dynamic, high-turnover market.
- A significant segment (11.1%) caters to monthly stays (30+ nights) in Borough of Wyre, pointing to opportunities in the extended-stay market.
Recommendations
- Align with the market by considering a 2 Nights minimum stay, as 50.8% of Borough of Wyre hosts use this setting.
- If feasible, allowing 1-night stays, especially midweek or during low season, could capture last-minute bookings, as only 28.1% currently do.
- Explore offering discounts for stays of 30+ nights to attract the 11.1% of the market seeking extended stays.
- Adjust minimum nights based on seasonality – potentially shorter during low season and longer during peak demand periods in Borough of Wyre.
Borough of Wyre Airbnb Cancellation Policy Trends Analysis (2025)
Super Strict 30 Days
3 listings
1.6% of total
Refundable
2 listings
1.1% of total
Super Strict 60 Days
20 listings
11% of total
Non-refundable
2 listings
1.1% of total
Flexible
34 listings
18.7% of total
Moderate
42 listings
23.1% of total
Firm
42 listings
23.1% of total
Strict
37 listings
20.3% of total
Cancellation Policy Insights for Borough of Wyre
- The prevailing Airbnb cancellation policy trend in Borough of Wyre is Moderate, used by 23.1% of listings.
- There's a relatively balanced mix between guest-friendly (41.8%) and stricter (43.4%) policies, offering choices for different guest needs.
Recommendations for Hosts
- Consider adopting a Moderate policy to align with the 23.1% market standard in Borough of Wyre.
- Regularly review your cancellation policy against competitors and market demand shifts in Borough of Wyre.
Borough of Wyre STR Booking Lead Time Analysis (2025)
Average Booking Lead Time by Month
Booking Lead Time Insights for Borough of Wyre
- The overall average booking lead time for vacation rentals in Borough of Wyre is 56 days.
- Guests book furthest in advance for stays during July (average 93 days), likely coinciding with peak travel demand or local events.
- The shortest booking windows occur for stays in February (average 43 days), indicating more last-minute travel plans during this time.
- Seasonally, Summer (82 days avg.) sees the longest lead times, while Winter (52 days avg.) has the shortest, reflecting typical travel planning cycles.
Recommendations for Hosts
- Use the overall average lead time (56 days) as a baseline for your pricing and availability strategy in Borough of Wyre.
- For July stays, consider implementing length-of-stay discounts or slightly higher rates for bookings made less than 93 days out to capitalize on advance planning.
- Target marketing efforts for the Summer season well in advance (at least 82 days) to capture early planners.
- Monitor your own booking lead times against these Borough of Wyre averages to identify opportunities for dynamic pricing adjustments.
Popular & Essential Airbnb Amenities in Borough of Wyre (2025)
Amenity Prevalence
Amenity Insights for Borough of Wyre
- Essential amenities in Borough of Wyre that guests expect include: Smoke alarm, TV, Heating. Lacking these (any) could significantly impact bookings.
- Popular amenities like Kitchen, Wifi, Cooking basics are common but not universal. Offering these can provide a competitive edge.
- Warning: Wifi is not universally provided but is considered essential globally. Ensure reliable Wifi is offered.
Recommendations for Hosts
- Ensure your listing includes all essential amenities for Borough of Wyre: Smoke alarm, TV, Heating.
- Prioritize adding missing essentials: Smoke alarm, TV, Heating.
- Consider adding popular differentiators like Kitchen or Wifi to increase appeal.
- Highlight unique or less common amenities you offer (e.g., hot tub, dedicated workspace, EV charger) in your listing description and photos.
- Regularly check competitor amenities in Borough of Wyre to stay competitive.
Borough of Wyre Airbnb Guest Demographics & Profile Analysis (2025)
Guest Profile Summary for Borough of Wyre
- The typical guest profile for Airbnb in Borough of Wyre consists of primarily domestic travelers (93%), often arriving from nearby England, typically belonging to the Post-2000s (Gen Z/Alpha) group (50%), primarily speaking English or French.
- Domestic travelers account for 92.7% of guests.
- Key international markets include United Kingdom (92.7%) and United States (2%).
- Top languages spoken are English (77.6%) followed by French (4.5%).
- A significant demographic segment is the Post-2000s (Gen Z/Alpha) group, representing 50% of guests.
Recommendations for Hosts
- Target domestic marketing efforts towards travelers from England and Manchester.
- Tailor amenities and listing descriptions to appeal to the dominant Post-2000s (Gen Z/Alpha) demographic (e.g., highlight fast WiFi, smart home features, local guides).
- Highlight unique local experiences or amenities relevant to the primary guest profile.
- Consider seasonal promotions aligned with peak travel times for key origin markets.
Nearby Short-Term Rental Market Comparison
How does the Borough of Wyre Airbnb market stack up against its neighbors? Compare key performance metrics like average monthly revenue, ADR, and occupancy rates in surrounding areas to understand the broader regional STR landscape.
| Market | Active Properties | Monthly Revenue | Daily Rate | Avg. Occupancy |
|---|---|---|---|---|
| Grinton | 14 | $5,456 | $365.05 | 51% |
| Cartmel Fell | 17 | $4,719 | $331.68 | 52% |
| Casterton | 11 | $4,578 | $300.82 | 51% |
| Cark | 11 | $4,540 | $885.21 | 31% |
| Flore | 10 | $4,534 | $347.03 | 40% |
| Abbeycwmhir | 10 | $4,502 | $259.19 | 49% |
| Craven Arms | 10 | $4,487 | $292.69 | 50% |
| Eglwys-bach | 16 | $4,413 | $315.23 | 52% |
| Waverton | 16 | $4,358 | $444.20 | 33% |
| Hayton | 13 | $4,333 | $239.53 | 60% |