Bellingham Airbnb Market Analysis 2025: Short Term Rental Data & Vacation Rental Statistics in England, United Kingdom
Is Airbnb profitable in Bellingham in 2025? Explore comprehensive Airbnb analytics for Bellingham, England, United Kingdom to uncover income potential. This 2025 STR market report for Bellingham, based on AirROI data from April 2024 to March 2025, reveals key trends in the niche market of 44 active listings.
Whether you're considering an Airbnb investment in Bellingham, optimizing your existing vacation rental, or exploring rental arbitrage opportunities, understanding the Bellingham Airbnb data is crucial. Leveraging the low regulation environment is key to maximizing your short term rental income potential. Let's dive into the specifics.
Key Bellingham Airbnb Performance Metrics Overview
Monthly Airbnb Revenue Variations & Income Potential in Bellingham (2025)
Understanding the monthly revenue variations for Airbnb listings in Bellingham is key to maximizing your short term rental income potential. Seasonality significantly impacts earnings. Our analysis, based on data from the past 12 months, shows that the peak revenue month for STRs in Bellingham is typically August, while February often presents the lowest earnings, highlighting opportunities for strategic pricing adjustments during shoulder and low seasons. Explore the typical Airbnb income in Bellingham across different performance tiers:
- Best-in-class properties (Top 10%) achieve $5,009+ monthly, often utilizing dynamic pricing and superior guest experiences.
- Strong performing properties (Top 25%) earn $3,175 or more, indicating effective management and desirable locations/amenities.
- Typical properties (Median) generate around $1,872 per month, representing the average market performance.
- Entry-level properties (Bottom 25%) see earnings around $1,103, often with potential for optimization.
Average Monthly Airbnb Earnings Trend in Bellingham
Bellingham Airbnb Occupancy Rate Trends (2025)
Maximize your bookings by understanding the Bellingham STR occupancy trends. Seasonal demand shifts significantly influence how often properties are booked. Typically, Augustsees the highest demand (peak season occupancy), while March experiences the lowest (low season). Effective strategies, like adjusting minimum stays or offering promotions, can boost occupancy during slower periods. Here's how different property tiers perform in Bellingham:
- Best-in-class properties (Top 10%) achieve 68%+ occupancy, indicating high desirability and potentially optimized availability.
- Strong performing properties (Top 25%) maintain 53% or higher occupancy, suggesting good market fit and guest satisfaction.
- Typical properties (Median) have an occupancy rate around 35%.
- Entry-level properties (Bottom 25%) average 19% occupancy, potentially facing higher vacancy.
Average Monthly Occupancy Rate Trend in Bellingham
Average Daily Rate (ADR) Airbnb Trends in Bellingham (2025)
Effective short term rental pricing strategy in Bellingham involves understanding monthly ADR fluctuations. The Average Daily Rate (ADR) for Airbnb in Bellingham typically peaks in August and dips lowest during March. Leveraging Airbnb dynamic pricing tools or strategies based on this seasonality can significantly boost revenue. Here's a look at the typical nightly rates achieved:
- Best-in-class properties (Top 10%) command rates of $329+ per night, often due to premium features or locations.
- Strong performing properties (Top 25%) achieve nightly rates of $246 or more.
- Typical properties (Median) charge around $166 per night.
- Entry-level properties (Bottom 25%) earn around $126 per night.
Average Daily Rate (ADR) Trend by Month in Bellingham
Get Live Bellingham Market Intelligence 👇

Explore Real-time Analytics
Airbnb Seasonality Analysis & Trends in Bellingham (2025)
Peak Season (August, July, June)
- Revenue averages $3,327 per month
- Occupancy rates average 49.2%
- Daily rates average $215
Shoulder Season
- Revenue averages $2,478 per month
- Occupancy maintains around 37.5%
- Daily rates hold near $205
Low Season (January, February, March)
- Revenue drops to average $1,575 per month
- Occupancy decreases to average 28.0%
- Daily rates adjust to average $191
Seasonality Insights for Bellingham
- The Airbnb seasonality in Bellingham shows highly seasonal trends requiring careful strategy. While the sections above show seasonal averages, it's also insightful to look at the extremes:
- During the high season, the absolute peak month showcases Bellingham's highest earning potential, with monthly revenues capable of climbing to $3,527, occupancy reaching a high of 53.4%, and ADRs peaking at $220.
- Conversely, the slowest single month of the year, typically falling within the low season, marks the market's lowest point. In this month, revenue might dip to $1,514, occupancy could drop to 27.3%, and ADRs may adjust down to $190.
- Understanding both the seasonal averages and these monthly peaks and troughs in revenue, occupancy, and ADR is crucial for maximizing your Airbnb profit potential in Bellingham.
Seasonal Strategies for Maximizing Profit
- Peak Season: Maximize revenue through premium pricing and potentially longer minimum stays. Ensure high availability.
- Low Season: Offer competitive pricing, special promotions (e.g., extended stay discounts), and flexible cancellation policies. Target off-season travelers like remote workers or budget-conscious guests.
- Shoulder Seasons: Implement dynamic pricing that balances peak and low rates. Target weekend travelers or specific events. Offer slightly more flexible terms than peak season.
- Regularly analyze your own performance against these Bellingham seasonality benchmarks and adjust your pricing and availability strategy accordingly.
Best Areas for Airbnb Investment in Bellingham (2025)
Exploring the top neighborhoods for short-term rentals in Bellingham? This section highlights key areas, outlining why they are attractive for hosts and guests, along with notable local attractions. Consider these locations based on your target guest profile and investment strategy.
| Neighborhood / Area | Why Host Here? (Target Guests & Appeal) | Key Attractions & Landmarks |
|---|---|---|
| Fairhaven | A picturesque historic district with waterfront views, charming shops, and eateries. Ideal for guests seeking a tranquil retreat close to nature and local culture. | Fairhaven Village Inn, Boulevard Park, Fairhaven Park, Westerly Park, Wailuku Drive, Fairhaven Fish and Chips |
| Bellingham Bay | A stunning coastal area perfect for outdoor enthusiasts and vacationers looking for waterfront adventures, including boating, fishing, and hiking. | Bellingham Bay, Bellingham Cruise Terminal, Squalicum Harbor, Bellingham Marina, Larrabee State Park, Fairhaven Fish Market |
| Downtown Bellingham | The heart of Bellingham with a vibrant arts scene, diverse dining options, and local shops. Great for travelers wanting to experience urban life. | Whatcom Museum, Bellingham Theatre Guild, Depot Market Square, Zuanich Point Park, The Mount Baker Theatre, Local breweries and cafes |
| West Bellingham | A quaint area with a community feel, surrounded by parks and trails, ideal for families and those seeking a quieter stay near urban amenities. | Lake Padden Park, Bellingham Railway Museum, Hiking trails, Bellingham Golf and Country Club, Bellingham Farmers Market, Nearby schools and educational facilities |
| Lynden | A charming nearby town with a strong Dutch heritage, perfect for guests looking for a unique small-town experience with cultural festivals and activities. | Lynden Pioneer Museum, Jansen Art Center, Lynden Waterpark, Dutch Village Market, Lynden Performing Arts Guild, Nearby farms and scenic countryside |
| Lake Whatcom | A serene area perfect for nature lovers, offering recreational activities like swimming, kayaking, and hiking around the lake and forested areas. | Lake Whatcom Park, Bloedel Donovan Park, West Beach, Whatcom Lake, Nearby hiking trails, Boating and fishing opportunities |
| Chuckanut Drive | Scenic byway with breathtaking views, ideal for guests wanting to explore the natural beauty of the region while enjoying local cuisine. | Chuckanut Bay, Scottish Highlands |
| Geneva | A peaceful community situated by the lake, offering a rustic retreat experience, great for families and travelers looking for relaxation. | Ferndale Riverwalk Trail, Geneva Community Center, Bayside Park, Nearby hiking and nature trails, Local artisan shops, Wooded areas for walks and exploration |
Understanding Airbnb License Requirements & STR Laws in Bellingham (2025)
While Bellingham, England, United Kingdom currently shows low STR regulations, specific Airbnb license requirements might still exist or change. Always verify the latest short term rental regulations and Airbnb license requirements directly with local government authorities for Bellingham to ensure full compliance before hosting.
(Source: AirROI data, 2025, finding no licensed listings among those analyzed)
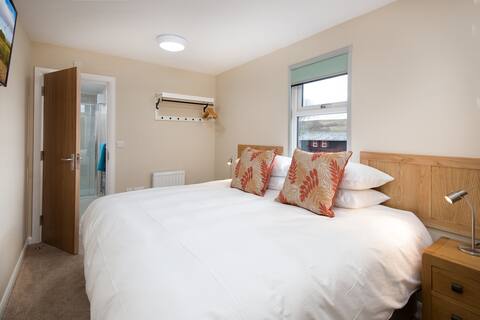
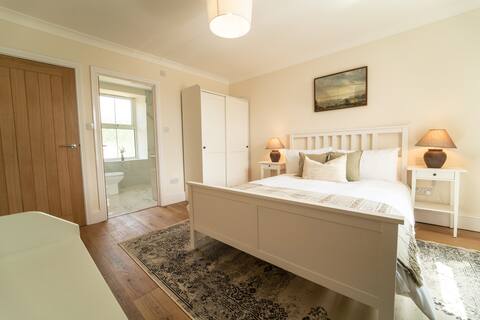
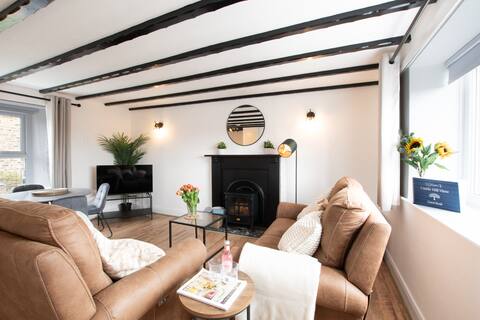
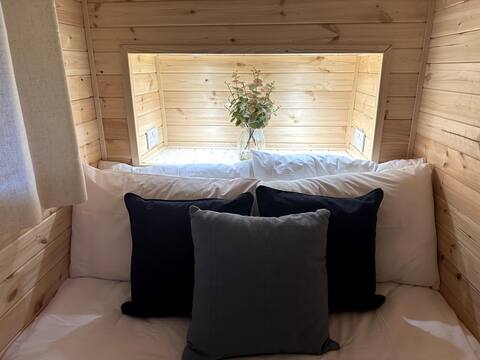
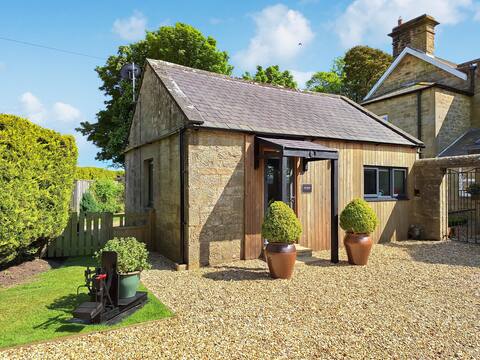
Top Performing Airbnb Properties in Bellingham (2025)
Benchmark your potential! Explore examples of top-performing Airbnb properties in Bellinghambased on Trailing Twelve Month (TTM) revenue. Analyze their characteristics, revenue, occupancy rate, and ADR to understand what drives success in this market.
Brown Rigg Guest Rooms - Bellingham
Entire Place • 6 bedrooms
Foundry Farm House 4 bedroom
Entire Place • 4 bedrooms
Northern Hideaways, Castle View
Entire Place • 2 bedrooms

Hareshaw House - Modern 3 bedroom bungalow.
Entire Place • 3 bedrooms
Foundry Farm Arch
Entire Place • 1 bedroom
The Studio at Westfield
Entire Place • 1 bedroom
Note: Performance varies based on location, size, amenities, seasonality, and management quality. Data reflects the past 12 months.
Top Performing Airbnb Hosts in Bellingham (2025)
Learn from the best! This table showcases top-performing Airbnb hosts in Bellingham based on the number of properties managed and estimated total revenue over the past year. Analyze their scale and performance metrics.
| Host Name | Properties | Grossing Revenue | Stay Reviews | Avg Rating |
|---|---|---|---|---|
| Foundry Farm Holidays | 4 | $208,956 | 402 | 4.87/5.0 |
| Susan | 7 | $181,310 | 187 | 4.90/5.0 |
| Wooden Star Cottages | 9 | $148,952 | 553 | 4.89/5.0 |
| Chris | 2 | $110,785 | 23 | 4.88/5.0 |
| Rachel | 2 | $62,673 | 167 | 4.98/5.0 |
| Cottages | 2 | $57,784 | 18 | 4.69/5.0 |
| Hexham Holiday | 1 | $55,306 | 30 | 4.77/5.0 |
| Margaret | 1 | $38,681 | 9 | 5.00/5.0 |
| Diane | 1 | $38,184 | 97 | 4.99/5.0 |
| Graham | 2 | $37,795 | 16 | 4.38/5.0 |
Analyzing the strategies of top hosts, such as their property selection, pricing, and guest communication, can offer valuable lessons for optimizing your own Airbnb operations in Bellingham.
Dive Deeper: Advanced Bellingham STR Market Data (2025)
Ready to unlock more insights? AirROI provides access to advanced metrics and comprehensive Airbnb data for Bellingham. Explore detailed analytics beyond this report to refine your investment strategy, optimize pricing, and maximize your vacation rental profits.
Explore Advanced MetricsBellingham Short-Term Rental Market Composition (2025): Property & Room Types
Room Type Distribution
Property Type Distribution
Market Composition Insights for Bellingham
- The Bellingham Airbnb market composition is heavily skewed towards Entire Home/Apt listings, which make up 86.4% of the 44 active rentals. This indicates strong guest preference for privacy and space.
- Looking at the property type distribution in Bellingham, House properties are the most common (63.6%), reflecting the local real estate landscape.
- Houses represent a significant 63.6% portion, catering likely to families or larger groups.
- The presence of 9.1% Hotel/Boutique listings indicates integration with traditional hospitality.
- Smaller segments like outdoor/unique (combined 4.5%) offer potential for unique stay experiences.
Bellingham Airbnb Room Capacity Analysis (2025): Bedroom Distribution
Distribution of Listings by Number of Bedrooms
Room Capacity Insights for Bellingham
- The dominant room capacity in Bellingham is 1 bedroom listings, making up 36.4% of the market. This suggests a strong demand for properties suitable for couples or solo travelers.
- Together, 1 bedroom and 2 bedrooms properties represent 63.7% of the active Airbnb listings in Bellingham, indicating a high concentration in these sizes.
- A significant 31.7% of listings offer 3+ bedrooms, catering to larger groups and families seeking more space in Bellingham.
Bellingham Vacation Rental Guest Capacity Trends (2025)
Distribution of Listings by Guest Capacity
Guest Capacity Insights for Bellingham
- The most common guest capacity trend in Bellingham vacation rentals is listings accommodating 2 guests (29.5%). This suggests the primary traveler segment is likely couples or solo travelers.
- Properties designed for 2 guests and 4 guests dominate the Bellingham STR market, accounting for 54.5% of listings.
- 34.1% of properties accommodate 6+ guests, serving the market segment for larger families or group travel in Bellingham.
- On average, properties in Bellingham are equipped to host 4.1 guests.
Bellingham Airbnb Booking Patterns (2025): Available vs. Booked Days
Available Days Distribution
Booked Days Distribution
Booking Pattern Insights for Bellingham
- The most common availability pattern in Bellingham falls within the 181-270 days range, representing 56.8% of listings. This suggests many properties have significant open periods on their calendars.
- Approximately 81.8% of listings show high availability (181+ days open annually), indicating potential for increased bookings or specific owner usage patterns.
- For booked days, the 91-180 days range is most frequent in Bellingham (52.3%), reflecting common guest stay durations or potential owner blocking patterns.
- A notable 22.8% of properties secure long booking periods (181+ days booked per year), highlighting successful long-term rental strategies or significant owner usage.
Bellingham Airbnb Minimum Stay Requirements Analysis
Distribution of Listings by Minimum Night Requirement
1 Night
15 listings
34.9% of total
2 Nights
15 listings
34.9% of total
3 Nights
4 listings
9.3% of total
30+ Nights
9 listings
20.9% of total
Key Insights
- The most prevalent minimum stay requirement in Bellingham is 1 Night, adopted by 34.9% of listings. This highlights the market's preference for shorter, flexible bookings.
- A strong majority (69.8%) of the Bellingham Airbnb data shows acceptance of very short stays (1-2 nights), indicating a dynamic, high-turnover market.
- A significant segment (20.9%) caters to monthly stays (30+ nights) in Bellingham, pointing to opportunities in the extended-stay market.
Recommendations
- Align with the market by considering a 1 Night minimum stay, as 34.9% of Bellingham hosts use this setting.
- Explore offering discounts for stays of 30+ nights to attract the 20.9% of the market seeking extended stays.
- Adjust minimum nights based on seasonality – potentially shorter during low season and longer during peak demand periods in Bellingham.
Bellingham Airbnb Cancellation Policy Trends Analysis (2025)
Refundable
2 listings
4.5% of total
Super Strict 60 Days
2 listings
4.5% of total
Flexible
9 listings
20.5% of total
Moderate
11 listings
25% of total
Firm
10 listings
22.7% of total
Strict
10 listings
22.7% of total
Cancellation Policy Insights for Bellingham
- The prevailing Airbnb cancellation policy trend in Bellingham is Moderate, used by 25% of listings.
- There's a relatively balanced mix between guest-friendly (45.5%) and stricter (45.4%) policies, offering choices for different guest needs.
Recommendations for Hosts
- Consider adopting a Moderate policy to align with the 25% market standard in Bellingham.
- Regularly review your cancellation policy against competitors and market demand shifts in Bellingham.
Bellingham STR Booking Lead Time Analysis (2025)
Average Booking Lead Time by Month
Booking Lead Time Insights for Bellingham
- The overall average booking lead time for vacation rentals in Bellingham is 68 days.
- Guests book furthest in advance for stays during July (average 105 days), likely coinciding with peak travel demand or local events.
- The shortest booking windows occur for stays in February (average 40 days), indicating more last-minute travel plans during this time.
- Seasonally, Summer (88 days avg.) sees the longest lead times, while Winter (65 days avg.) has the shortest, reflecting typical travel planning cycles.
Recommendations for Hosts
- Use the overall average lead time (68 days) as a baseline for your pricing and availability strategy in Bellingham.
- For July stays, consider implementing length-of-stay discounts or slightly higher rates for bookings made less than 105 days out to capitalize on advance planning.
- Target marketing efforts for the Summer season well in advance (at least 88 days) to capture early planners.
- Monitor your own booking lead times against these Bellingham averages to identify opportunities for dynamic pricing adjustments.
Popular & Essential Airbnb Amenities in Bellingham (2025)
Amenity Prevalence
Amenity Insights for Bellingham
- Essential amenities in Bellingham that guests expect include: Wifi, Heating, TV. Lacking these (any) could significantly impact bookings.
- Popular amenities like Bed linens, Hot water, Kitchen are common but not universal. Offering these can provide a competitive edge.
Recommendations for Hosts
- Ensure your listing includes all essential amenities for Bellingham: Wifi, Heating, TV.
- Prioritize adding missing essentials: TV.
- Consider adding popular differentiators like Bed linens or Hot water to increase appeal.
- Highlight unique or less common amenities you offer (e.g., hot tub, dedicated workspace, EV charger) in your listing description and photos.
- Regularly check competitor amenities in Bellingham to stay competitive.
Bellingham Airbnb Guest Demographics & Profile Analysis (2025)
Guest Profile Summary for Bellingham
- The typical guest profile for Airbnb in Bellingham consists of primarily domestic travelers (95%), often arriving from nearby England, typically belonging to the Post-2000s (Gen Z/Alpha) group (50%), primarily speaking English or French.
- Domestic travelers account for 95.4% of guests.
- Key international markets include United Kingdom (95.4%) and United States (1.1%).
- Top languages spoken are English (74.6%) followed by French (6.7%).
- A significant demographic segment is the Post-2000s (Gen Z/Alpha) group, representing 50% of guests.
Recommendations for Hosts
- Target domestic marketing efforts towards travelers from England and Newcastle upon Tyne.
- Tailor amenities and listing descriptions to appeal to the dominant Post-2000s (Gen Z/Alpha) demographic (e.g., highlight fast WiFi, smart home features, local guides).
- Highlight unique local experiences or amenities relevant to the primary guest profile.
- Consider seasonal promotions aligned with peak travel times for key origin markets.
Nearby Short-Term Rental Market Comparison
How does the Bellingham Airbnb market stack up against its neighbors? Compare key performance metrics like average monthly revenue, ADR, and occupancy rates in surrounding areas to understand the broader regional STR landscape.
| Market | Active Properties | Monthly Revenue | Daily Rate | Avg. Occupancy |
|---|---|---|---|---|
| Gorebridge | 12 | $6,209 | $493.62 | 54% |
| Bridge of Cally | 16 | $5,839 | $566.24 | 50% |
| Grinton | 14 | $5,456 | $365.05 | 51% |
| Cartmel Fell | 17 | $4,719 | $331.68 | 52% |
| Casterton | 11 | $4,578 | $300.82 | 51% |
| Cark | 11 | $4,540 | $885.21 | 31% |
| City of Edinburgh | 4,312 | $4,528 | $274.67 | 61% |
| Kenmore | 10 | $4,507 | $430.34 | 41% |
| Waverton | 16 | $4,358 | $444.20 | 33% |
| Hayton | 13 | $4,333 | $239.53 | 60% |