Beetham Airbnb Market Analysis 2025: Short Term Rental Data & Vacation Rental Statistics in England, United Kingdom
Is Airbnb profitable in Beetham in 2025? Explore comprehensive Airbnb analytics for Beetham, England, United Kingdom to uncover income potential. This 2025 STR market report for Beetham, based on AirROI data from April 2024 to March 2025, reveals key trends in the niche market of 18 active listings.
Whether you're considering an Airbnb investment in Beetham, optimizing your existing vacation rental, or exploring rental arbitrage opportunities, understanding the Beetham Airbnb data is crucial. Leveraging the low regulation environment is key to maximizing your short term rental income potential. Let's dive into the specifics.
Key Beetham Airbnb Performance Metrics Overview
Monthly Airbnb Revenue Variations & Income Potential in Beetham (2025)
Understanding the monthly revenue variations for Airbnb listings in Beetham is key to maximizing your short term rental income potential. Seasonality significantly impacts earnings. Our analysis, based on data from the past 12 months, shows that the peak revenue month for STRs in Beetham is typically August, while January often presents the lowest earnings, highlighting opportunities for strategic pricing adjustments during shoulder and low seasons. Explore the typical Airbnb income in Beetham across different performance tiers:
- Best-in-class properties (Top 10%) achieve $4,665+ monthly, often utilizing dynamic pricing and superior guest experiences.
- Strong performing properties (Top 25%) earn $3,193 or more, indicating effective management and desirable locations/amenities.
- Typical properties (Median) generate around $2,183 per month, representing the average market performance.
- Entry-level properties (Bottom 25%) see earnings around $1,087, often with potential for optimization.
Average Monthly Airbnb Earnings Trend in Beetham
Beetham Airbnb Occupancy Rate Trends (2025)
Maximize your bookings by understanding the Beetham STR occupancy trends. Seasonal demand shifts significantly influence how often properties are booked. Typically, Julysees the highest demand (peak season occupancy), while January experiences the lowest (low season). Effective strategies, like adjusting minimum stays or offering promotions, can boost occupancy during slower periods. Here's how different property tiers perform in Beetham:
- Best-in-class properties (Top 10%) achieve 81%+ occupancy, indicating high desirability and potentially optimized availability.
- Strong performing properties (Top 25%) maintain 67% or higher occupancy, suggesting good market fit and guest satisfaction.
- Typical properties (Median) have an occupancy rate around 45%.
- Entry-level properties (Bottom 25%) average 23% occupancy, potentially facing higher vacancy.
Average Monthly Occupancy Rate Trend in Beetham
Average Daily Rate (ADR) Airbnb Trends in Beetham (2025)
Effective short term rental pricing strategy in Beetham involves understanding monthly ADR fluctuations. The Average Daily Rate (ADR) for Airbnb in Beetham typically peaks in October and dips lowest during March. Leveraging Airbnb dynamic pricing tools or strategies based on this seasonality can significantly boost revenue. Here's a look at the typical nightly rates achieved:
- Best-in-class properties (Top 10%) command rates of $233+ per night, often due to premium features or locations.
- Strong performing properties (Top 25%) achieve nightly rates of $202 or more.
- Typical properties (Median) charge around $158 per night.
- Entry-level properties (Bottom 25%) earn around $121 per night.
Average Daily Rate (ADR) Trend by Month in Beetham
Get Live Beetham Market Intelligence 👇

Explore Real-time Analytics
Airbnb Seasonality Analysis & Trends in Beetham (2025)
Peak Season (August, July, May)
- Revenue averages $2,883 per month
- Occupancy rates average 51.7%
- Daily rates average $166
Shoulder Season
- Revenue averages $2,354 per month
- Occupancy maintains around 46.8%
- Daily rates hold near $163
Low Season (January, February, March)
- Revenue drops to average $1,788 per month
- Occupancy decreases to average 38.5%
- Daily rates adjust to average $155
Seasonality Insights for Beetham
- The Airbnb seasonality in Beetham shows moderate seasonality with distinct peak and low periods. While the sections above show seasonal averages, it's also insightful to look at the extremes:
- During the high season, the absolute peak month showcases Beetham's highest earning potential, with monthly revenues capable of climbing to $3,138, occupancy reaching a high of 54.4%, and ADRs peaking at $168.
- Conversely, the slowest single month of the year, typically falling within the low season, marks the market's lowest point. In this month, revenue might dip to $1,686, occupancy could drop to 34.3%, and ADRs may adjust down to $152.
- Understanding both the seasonal averages and these monthly peaks and troughs in revenue, occupancy, and ADR is crucial for maximizing your Airbnb profit potential in Beetham.
Seasonal Strategies for Maximizing Profit
- Peak Season: Maximize revenue through premium pricing and potentially longer minimum stays. Ensure high availability.
- Low Season: Offer competitive pricing, special promotions (e.g., extended stay discounts), and flexible cancellation policies. Target off-season travelers like remote workers or budget-conscious guests.
- Shoulder Seasons: Implement dynamic pricing that balances peak and low rates. Target weekend travelers or specific events. Offer slightly more flexible terms than peak season.
- Regularly analyze your own performance against these Beetham seasonality benchmarks and adjust your pricing and availability strategy accordingly.
Best Areas for Airbnb Investment in Beetham (2025)
Exploring the top neighborhoods for short-term rentals in Beetham? This section highlights key areas, outlining why they are attractive for hosts and guests, along with notable local attractions. Consider these locations based on your target guest profile and investment strategy.
| Neighborhood / Area | Why Host Here? (Target Guests & Appeal) | Key Attractions & Landmarks |
|---|---|---|
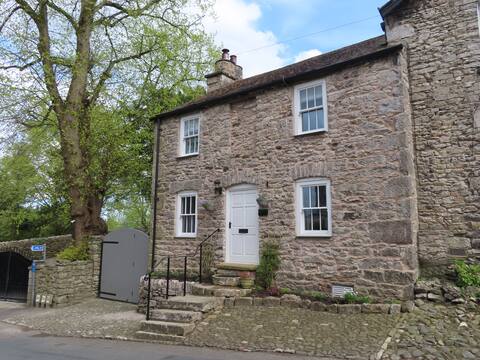
| Beetham Village | A picturesque village with charming landscapes and a tranquil atmosphere, appealing to travelers seeking a peaceful retreat. | St. Michael's Church, The Beetham Hall, The Heron Corn Mill, Beautiful walking trails, Nearby countryside |
| Milnthorpe | A nearby market town with a vibrant community and local shops, providing a local experience for guests. | Local shops and markets, The River Kent, Milnthorpe Square, Haven of wildlife at nearby estates, St. Thomas' Church |
| Arnside | Known for its stunning views of the coastline and Arnside Knott, making it a popular destination for nature lovers and walkers. | Arnside Pier, Silverdale and Arnside AONB, Walking trails, Local cafes, Historic buildings and village |
| Kirkby Lonsdale | A charming town with historical significance and beautiful scenery, great for travelers interested in history and nature. | Devil's Bridge, Kirkby Lonsdale Market, St Mary’s Church, Ruskin’s View, Nearby Ingleton Waterfalls |
| Windermere | A popular tourist hotspot in the Lake District, known for its lake and outdoor activities. | Lake Windermere, Bowness-on-Windermere, Windermere Jetty Museum, Boat excursions, Hiking paths |
| Grange-over-Sands | A beautiful seaside town with a relaxed atmosphere, ideal for guests looking to enjoy coastal walks and quaint shops. | Grange-over-Sands promenade, Local gardens, Holker Hall and Gardens, Nearby areas of natural beauty, Walking trails along the coast |
| Sedbergh | A quiet market town known for its bookshops and access to the Yorkshire Dales, appealing to visitors seeking a rural getaway. | Sedbergh School, The Howgill Fells, Local bookstores, Cowgill Chapel, Quaint architecture |
| Silverdale | A charming village close to the coast and surrounded by natural beauty, attracting guests who appreciate nature and tranquility. | Silverdale Golf Club, RSPB Leighton Moss, Walking trails, Coastal scenery, Local artisan shops |
Understanding Airbnb License Requirements & STR Laws in Beetham (2025)
While Beetham, England, United Kingdom currently shows low STR regulations, specific Airbnb license requirements might still exist or change. Always verify the latest short term rental regulations and Airbnb license requirements directly with local government authorities for Beetham to ensure full compliance before hosting.
(Source: AirROI data, 2025, finding no licensed listings among those analyzed)
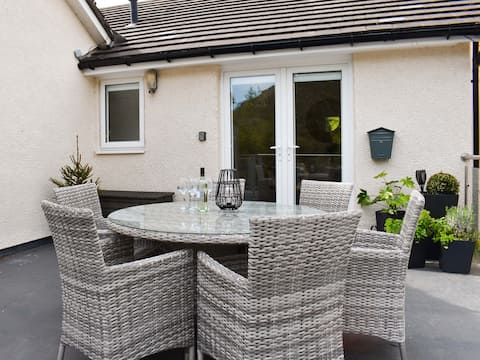
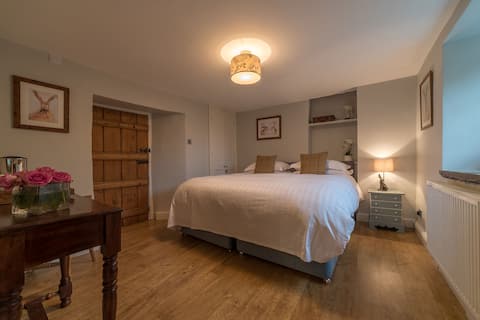
Top Performing Airbnb Properties in Beetham (2025)
Benchmark your potential! Explore examples of top-performing Airbnb properties in Beethambased on Trailing Twelve Month (TTM) revenue. Analyze their characteristics, revenue, occupancy rate, and ADR to understand what drives success in this market.

Pool House-with private heated pool and HotTub
Entire Place • N/A
Church View Cottage, Beetham
Entire Place • 2 bedrooms
Dunlin Haven
Entire Place • 3 bedrooms

Farmhouse Lodge
Entire Place • 1 bedroom
Hale Green Farmhouse (Breakfast included)
Private Room • 1 bedroom

Watersedge Retreat, views, sunsets, dogs welcome
Entire Place • 2 bedrooms
Note: Performance varies based on location, size, amenities, seasonality, and management quality. Data reflects the past 12 months.
Top Performing Airbnb Hosts in Beetham (2025)
Learn from the best! This table showcases top-performing Airbnb hosts in Beetham based on the number of properties managed and estimated total revenue over the past year. Analyze their scale and performance metrics.
| Host Name | Properties | Grossing Revenue | Stay Reviews | Avg Rating |
|---|---|---|---|---|
| Angela | 2 | $76,429 | 408 | 5.00/5.0 |
| Cottages | 3 | $76,393 | 15 | 3.30/5.0 |
| Jules | 2 | $58,630 | 251 | 4.91/5.0 |
| Kathleen | 1 | $58,299 | 147 | 4.94/5.0 |
| Claire | 1 | $52,267 | 121 | 5.00/5.0 |
| Pure Leisure | 3 | $29,332 | 81 | 4.61/5.0 |
| Robert | 1 | $29,249 | 166 | 4.67/5.0 |
| Jon | 1 | $28,832 | 132 | 4.93/5.0 |
| Peter Richard Donovan | 1 | $24,214 | 178 | 4.94/5.0 |
| Inno Hospitality | 2 | $21,590 | 118 | 4.47/5.0 |
Analyzing the strategies of top hosts, such as their property selection, pricing, and guest communication, can offer valuable lessons for optimizing your own Airbnb operations in Beetham.
Dive Deeper: Advanced Beetham STR Market Data (2025)
Ready to unlock more insights? AirROI provides access to advanced metrics and comprehensive Airbnb data for Beetham. Explore detailed analytics beyond this report to refine your investment strategy, optimize pricing, and maximize your vacation rental profits.
Explore Advanced MetricsBeetham Short-Term Rental Market Composition (2025): Property & Room Types
Room Type Distribution
Property Type Distribution
Market Composition Insights for Beetham
- The Beetham Airbnb market composition is heavily skewed towards Entire Home/Apt listings, which make up 77.8% of the 18 active rentals. This indicates strong guest preference for privacy and space.
- Looking at the property type distribution in Beetham, House properties are the most common (55.6%), reflecting the local real estate landscape.
- Houses represent a significant 55.6% portion, catering likely to families or larger groups.
- The presence of 22.2% Hotel/Boutique listings indicates integration with traditional hospitality.
Beetham Airbnb Room Capacity Analysis (2025): Bedroom Distribution
Distribution of Listings by Number of Bedrooms
Room Capacity Insights for Beetham
- The dominant room capacity in Beetham is 1 bedroom listings, making up 38.9% of the market. This suggests a strong demand for properties suitable for couples or solo travelers.
- Together, 1 bedroom and 2 bedrooms properties represent 66.7% of the active Airbnb listings in Beetham, indicating a high concentration in these sizes.
Beetham Vacation Rental Guest Capacity Trends (2025)
Distribution of Listings by Guest Capacity
Guest Capacity Insights for Beetham
- The most common guest capacity trend in Beetham vacation rentals is listings accommodating 2 guests (50%). This suggests the primary traveler segment is likely couples or solo travelers.
- Properties designed for 2 guests and 4 guests dominate the Beetham STR market, accounting for 83.3% of listings.
- A significant 50.0% of listings cater specifically to 1-2 guests, highlighting strong demand from couples and solo travelers in Beetham.
- 16.7% of properties accommodate 6+ guests, serving the market segment for larger families or group travel in Beetham.
- On average, properties in Beetham are equipped to host 3.3 guests.
Beetham Airbnb Booking Patterns (2025): Available vs. Booked Days
Available Days Distribution
Booked Days Distribution
Booking Pattern Insights for Beetham
- The most common availability pattern in Beetham falls within the 181-270 days range, representing 33.3% of listings. This suggests many properties have significant open periods on their calendars.
- Approximately 61.1% of listings show high availability (181+ days open annually), indicating potential for increased bookings or specific owner usage patterns.
- For booked days, the 91-180 days range is most frequent in Beetham (38.9%), reflecting common guest stay durations or potential owner blocking patterns.
- A notable 38.9% of properties secure long booking periods (181+ days booked per year), highlighting successful long-term rental strategies or significant owner usage.
Beetham Airbnb Minimum Stay Requirements Analysis
Distribution of Listings by Minimum Night Requirement
1 Night
8 listings
44.4% of total
2 Nights
4 listings
22.2% of total
3 Nights
5 listings
27.8% of total
30+ Nights
1 listings
5.6% of total
Key Insights
- The most prevalent minimum stay requirement in Beetham is 1 Night, adopted by 44.4% of listings. This highlights the market's preference for shorter, flexible bookings.
- A strong majority (66.6%) of the Beetham Airbnb data shows acceptance of very short stays (1-2 nights), indicating a dynamic, high-turnover market.
Recommendations
- Align with the market by considering a 1 Night minimum stay, as 44.4% of Beetham hosts use this setting.
- Explore offering discounts for stays of 30+ nights to attract the 5.6% of the market seeking extended stays.
- Adjust minimum nights based on seasonality – potentially shorter during low season and longer during peak demand periods in Beetham.
Beetham Airbnb Cancellation Policy Trends Analysis (2025)
Super Strict 60 Days
2 listings
11.8% of total
Flexible
2 listings
11.8% of total
Moderate
6 listings
35.3% of total
Firm
1 listings
5.9% of total
Strict
6 listings
35.3% of total
Cancellation Policy Insights for Beetham
- The prevailing Airbnb cancellation policy trend in Beetham is Moderate, used by 35.3% of listings.
- There's a relatively balanced mix between guest-friendly (47.1%) and stricter (41.2%) policies, offering choices for different guest needs.
Recommendations for Hosts
- Consider adopting a Moderate policy to align with the 35.3% market standard in Beetham.
- With 35.3% using Strict terms, this is a viable option in Beetham, particularly for high-value properties or during peak demand periods.
- Regularly review your cancellation policy against competitors and market demand shifts in Beetham.
Beetham STR Booking Lead Time Analysis (2025)
Average Booking Lead Time by Month
Booking Lead Time Insights for Beetham
- The overall average booking lead time for vacation rentals in Beetham is 59 days.
- Guests book furthest in advance for stays during December (average 99 days), likely coinciding with peak travel demand or local events.
- The shortest booking windows occur for stays in October (average 44 days), indicating more last-minute travel plans during this time.
- Seasonally, Winter (71 days avg.) sees the longest lead times, while Fall (51 days avg.) has the shortest, reflecting typical travel planning cycles.
Recommendations for Hosts
- Use the overall average lead time (59 days) as a baseline for your pricing and availability strategy in Beetham.
- For December stays, consider implementing length-of-stay discounts or slightly higher rates for bookings made less than 99 days out to capitalize on advance planning.
- Target marketing efforts for the Winter season well in advance (at least 71 days) to capture early planners.
- Monitor your own booking lead times against these Beetham averages to identify opportunities for dynamic pricing adjustments.
Popular & Essential Airbnb Amenities in Beetham (2025)
Amenity Prevalence
Amenity Insights for Beetham
- Popular amenities like Free parking on premises, Wifi, Heating are common but not universal. Offering these can provide a competitive edge.
- Warning: Wifi is not universally provided but is considered essential globally. Ensure reliable Wifi is offered.
Recommendations for Hosts
- Consider adding popular differentiators like Free parking on premises or Wifi to increase appeal.
- Highlight unique or less common amenities you offer (e.g., hot tub, dedicated workspace, EV charger) in your listing description and photos.
- Regularly check competitor amenities in Beetham to stay competitive.
Beetham Airbnb Guest Demographics & Profile Analysis (2025)
Guest Profile Summary for Beetham
- The typical guest profile for Airbnb in Beetham consists of primarily domestic travelers (91%), often arriving from nearby England, typically belonging to the Post-2000s (Gen Z/Alpha) group (50%), primarily speaking English or French.
- Domestic travelers account for 91.3% of guests.
- Key international markets include United Kingdom (91.3%) and United States (3.6%).
- Top languages spoken are English (75.2%) followed by French (7.6%).
- A significant demographic segment is the Post-2000s (Gen Z/Alpha) group, representing 50% of guests.
Recommendations for Hosts
- Target domestic marketing efforts towards travelers from England and Manchester.
- Tailor amenities and listing descriptions to appeal to the dominant Post-2000s (Gen Z/Alpha) demographic (e.g., highlight fast WiFi, smart home features, local guides).
- Highlight unique local experiences or amenities relevant to the primary guest profile.
- Consider seasonal promotions aligned with peak travel times for key origin markets.
Nearby Short-Term Rental Market Comparison
How does the Beetham Airbnb market stack up against its neighbors? Compare key performance metrics like average monthly revenue, ADR, and occupancy rates in surrounding areas to understand the broader regional STR landscape.
| Market | Active Properties | Monthly Revenue | Daily Rate | Avg. Occupancy |
|---|---|---|---|---|
| Gorebridge | 12 | $6,209 | $493.62 | 54% |
| Grinton | 14 | $5,456 | $365.05 | 51% |
| Cartmel Fell | 17 | $4,719 | $331.68 | 52% |
| Casterton | 11 | $4,578 | $300.82 | 51% |
| Cark | 11 | $4,540 | $885.21 | 31% |
| City of Edinburgh | 4,312 | $4,528 | $274.67 | 61% |
| Eglwys-bach | 16 | $4,413 | $315.23 | 52% |
| Waverton | 16 | $4,358 | $444.20 | 33% |
| Hayton | 13 | $4,333 | $239.53 | 60% |
| Watermillock | 16 | $4,281 | $274.03 | 50% |