Batheaston Airbnb Market Analysis 2025: Short Term Rental Data & Vacation Rental Statistics in England, United Kingdom
Is Airbnb profitable in Batheaston in 2025? Explore comprehensive Airbnb analytics for Batheaston, England, United Kingdom to uncover income potential. This 2025 STR market report for Batheaston, based on AirROI data from April 2024 to March 2025, reveals key trends in the niche market of 27 active listings.
Whether you're considering an Airbnb investment in Batheaston, optimizing your existing vacation rental, or exploring rental arbitrage opportunities, understanding the Batheaston Airbnb data is crucial. Leveraging the low regulation environment is key to maximizing your short term rental income potential. Let's dive into the specifics.
Key Batheaston Airbnb Performance Metrics Overview
Monthly Airbnb Revenue Variations & Income Potential in Batheaston (2025)
Understanding the monthly revenue variations for Airbnb listings in Batheaston is key to maximizing your short term rental income potential. Seasonality significantly impacts earnings. Our analysis, based on data from the past 12 months, shows that the peak revenue month for STRs in Batheaston is typically August, while January often presents the lowest earnings, highlighting opportunities for strategic pricing adjustments during shoulder and low seasons. Explore the typical Airbnb income in Batheaston across different performance tiers:
- Best-in-class properties (Top 10%) achieve $6,691+ monthly, often utilizing dynamic pricing and superior guest experiences.
- Strong performing properties (Top 25%) earn $4,001 or more, indicating effective management and desirable locations/amenities.
- Typical properties (Median) generate around $2,441 per month, representing the average market performance.
- Entry-level properties (Bottom 25%) see earnings around $1,492, often with potential for optimization.
Average Monthly Airbnb Earnings Trend in Batheaston
Batheaston Airbnb Occupancy Rate Trends (2025)
Maximize your bookings by understanding the Batheaston STR occupancy trends. Seasonal demand shifts significantly influence how often properties are booked. Typically, Julysees the highest demand (peak season occupancy), while February experiences the lowest (low season). Effective strategies, like adjusting minimum stays or offering promotions, can boost occupancy during slower periods. Here's how different property tiers perform in Batheaston:
- Best-in-class properties (Top 10%) achieve 84%+ occupancy, indicating high desirability and potentially optimized availability.
- Strong performing properties (Top 25%) maintain 66% or higher occupancy, suggesting good market fit and guest satisfaction.
- Typical properties (Median) have an occupancy rate around 42%.
- Entry-level properties (Bottom 25%) average 23% occupancy, potentially facing higher vacancy.
Average Monthly Occupancy Rate Trend in Batheaston
Average Daily Rate (ADR) Airbnb Trends in Batheaston (2025)
Effective short term rental pricing strategy in Batheaston involves understanding monthly ADR fluctuations. The Average Daily Rate (ADR) for Airbnb in Batheaston typically peaks in August and dips lowest during January. Leveraging Airbnb dynamic pricing tools or strategies based on this seasonality can significantly boost revenue. Here's a look at the typical nightly rates achieved:
- Best-in-class properties (Top 10%) command rates of $513+ per night, often due to premium features or locations.
- Strong performing properties (Top 25%) achieve nightly rates of $261 or more.
- Typical properties (Median) charge around $175 per night.
- Entry-level properties (Bottom 25%) earn around $133 per night.
Average Daily Rate (ADR) Trend by Month in Batheaston
Get Live Batheaston Market Intelligence 👇

Explore Real-time Analytics
Airbnb Seasonality Analysis & Trends in Batheaston (2025)
Peak Season (August, May, July)
- Revenue averages $5,195 per month
- Occupancy rates average 59.9%
- Daily rates average $288
Shoulder Season
- Revenue averages $3,197 per month
- Occupancy maintains around 42.9%
- Daily rates hold near $277
Low Season (January, February, March)
- Revenue drops to average $2,129 per month
- Occupancy decreases to average 39.0%
- Daily rates adjust to average $259
Seasonality Insights for Batheaston
- The Airbnb seasonality in Batheaston shows highly seasonal trends requiring careful strategy. While the sections above show seasonal averages, it's also insightful to look at the extremes:
- During the high season, the absolute peak month showcases Batheaston's highest earning potential, with monthly revenues capable of climbing to $5,411, occupancy reaching a high of 62.8%, and ADRs peaking at $294.
- Conversely, the slowest single month of the year, typically falling within the low season, marks the market's lowest point. In this month, revenue might dip to $2,073, occupancy could drop to 36.6%, and ADRs may adjust down to $255.
- Understanding both the seasonal averages and these monthly peaks and troughs in revenue, occupancy, and ADR is crucial for maximizing your Airbnb profit potential in Batheaston.
Seasonal Strategies for Maximizing Profit
- Peak Season: Maximize revenue through premium pricing and potentially longer minimum stays. Ensure high availability.
- Low Season: Offer competitive pricing, special promotions (e.g., extended stay discounts), and flexible cancellation policies. Target off-season travelers like remote workers or budget-conscious guests.
- Shoulder Seasons: Implement dynamic pricing that balances peak and low rates. Target weekend travelers or specific events. Offer slightly more flexible terms than peak season.
- Regularly analyze your own performance against these Batheaston seasonality benchmarks and adjust your pricing and availability strategy accordingly.
Best Areas for Airbnb Investment in Batheaston (2025)
Exploring the top neighborhoods for short-term rentals in Batheaston? This section highlights key areas, outlining why they are attractive for hosts and guests, along with notable local attractions. Consider these locations based on your target guest profile and investment strategy.
| Neighborhood / Area | Why Host Here? (Target Guests & Appeal) | Key Attractions & Landmarks |
|---|---|---|
| Bath City Centre | The heart of Bath, known for its Roman Baths and Georgian architecture. A popular tourist destination with high foot traffic and numerous attractions. | Roman Baths, Bath Abbey, Royal Crescent, The Circus, Thermae Bath Spa, Pulteney Bridge |
| Lansdown | A residential area just north of the city centre, offering beautiful views and close proximity to parks and the Lansdown Hill. Attractive to families and those seeking a quieter stay. | Lansdown Crescent, Claverton Down, Bath Racecourse, Hedgemead Park, Bath Golf Club |
| Widcombe | A charming neighborhood with a mix of historic and modern homes, known for its quaint streets and close distance to the city center. Popular among visitors looking for a local experience. | Widcombe Parade, The Botanical Gardens, The Approach Golf Course, Kennet and Avon Canal |
| Bear Flat | A family-friendly area with a village feel, featuring a range of amenities and easy access to Bath's attractions, making it a great option for longer stays. | Bear Flat shops, Local pubs, Victoria Park, Green Park Station |
| Twerton | A more affordable area with a mix of local community and access to public transport, appealing to budget travelers and those looking for home-like settings. | Twerton Park, Local shops, Community centers |
| Newbridge | A quiet residential area with family homes and green spaces, suitable for guests looking for tranquility while being a short drive or bus ride from Bath's attractions. | Newbridge Park, Local parks, Keynsham River Walk |
| Southdown | A residential suburb with various types of accommodations and local amenities, great for families and visitors looking for a relaxed environment. | Southdown Park, Whitchurch Village, Shops and cafes |
| Weston | An area known for its scenic views and proximity to countryside walks, appealing to nature lovers and those seeking a peaceful retreat close to Bath. | Weston All Saints School, Local parks, Garden centers, Walking trails |
Understanding Airbnb License Requirements & STR Laws in Batheaston (2025)
While Batheaston, England, United Kingdom currently shows low STR regulations, specific Airbnb license requirements might still exist or change. Always verify the latest short term rental regulations and Airbnb license requirements directly with local government authorities for Batheaston to ensure full compliance before hosting.
(Source: AirROI data, 2025, finding no licensed listings among those analyzed)
Top Performing Airbnb Properties in Batheaston (2025)
Benchmark your potential! Explore examples of top-performing Airbnb properties in Batheastonbased on Trailing Twelve Month (TTM) revenue. Analyze their characteristics, revenue, occupancy rate, and ADR to understand what drives success in this market.
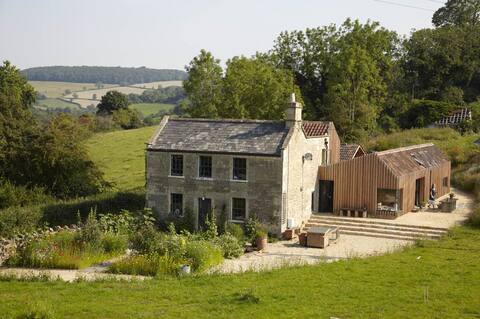
Design awarded house nr Bath
Entire Place • 6 bedrooms
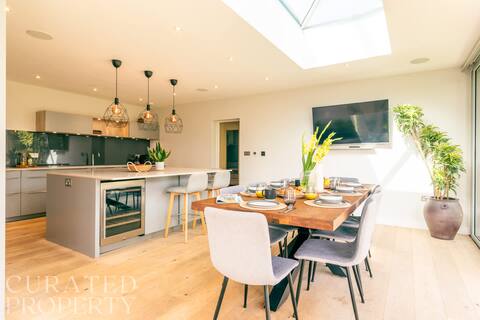
Luxury Home with Garden, Gym & Roof Terrace!
Entire Place • 5 bedrooms
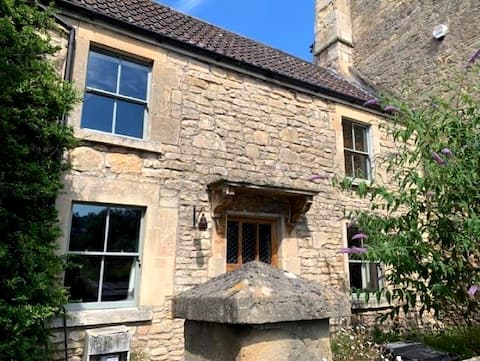
Charming cottage in the country just outside Bath
Entire Place • 3 bedrooms
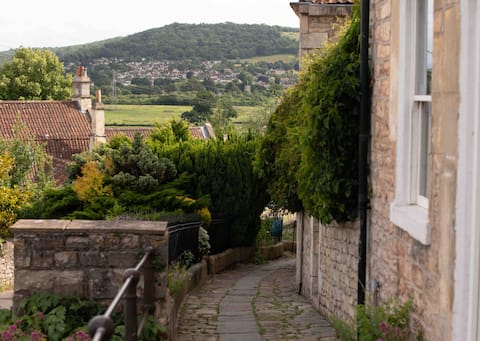
Cosy 2BD Cottage wIth beautiful views nr Bath
Entire Place • 2 bedrooms
The Hay Trailer
Entire Place • 1 bedroom
Luxurious 2 Bedroom Flat - Garden & Parking Bath
Entire Place • 2 bedrooms
Note: Performance varies based on location, size, amenities, seasonality, and management quality. Data reflects the past 12 months.
Top Performing Airbnb Hosts in Batheaston (2025)
Learn from the best! This table showcases top-performing Airbnb hosts in Batheaston based on the number of properties managed and estimated total revenue over the past year. Analyze their scale and performance metrics.
| Host Name | Properties | Grossing Revenue | Stay Reviews | Avg Rating |
|---|---|---|---|---|
| Starfall Farm Ltd | 1 | $124,482 | 24 | 4.25/5.0 |
| Curated | 1 | $92,842 | 54 | 4.80/5.0 |
| Sophie | 2 | $77,847 | 874 | 4.87/5.0 |
| Simon | 1 | $43,143 | 181 | 4.86/5.0 |
| Lynn | 2 | $42,499 | 23 | 4.96/5.0 |
| Maggie | 1 | $41,690 | 63 | 4.87/5.0 |
| Steve | 1 | $37,128 | 25 | 4.72/5.0 |
| Tavis | 2 | $35,729 | 88 | 4.97/5.0 |
| Janice | 1 | $30,875 | 183 | 4.99/5.0 |
| Caroline | 1 | $26,187 | 246 | 4.88/5.0 |
Analyzing the strategies of top hosts, such as their property selection, pricing, and guest communication, can offer valuable lessons for optimizing your own Airbnb operations in Batheaston.
Dive Deeper: Advanced Batheaston STR Market Data (2025)
Ready to unlock more insights? AirROI provides access to advanced metrics and comprehensive Airbnb data for Batheaston. Explore detailed analytics beyond this report to refine your investment strategy, optimize pricing, and maximize your vacation rental profits.
Explore Advanced MetricsBatheaston Short-Term Rental Market Composition (2025): Property & Room Types
Room Type Distribution
Property Type Distribution
Market Composition Insights for Batheaston
- The Batheaston Airbnb market composition is heavily skewed towards Entire Home/Apt listings, which make up 92.6% of the 27 active rentals. This indicates strong guest preference for privacy and space.
- Looking at the property type distribution in Batheaston, House properties are the most common (66.7%), reflecting the local real estate landscape.
- Houses represent a significant 66.7% portion, catering likely to families or larger groups.
- The presence of 11.1% Hotel/Boutique listings indicates integration with traditional hospitality.
Batheaston Airbnb Room Capacity Analysis (2025): Bedroom Distribution
Distribution of Listings by Number of Bedrooms
Room Capacity Insights for Batheaston
- The dominant room capacity in Batheaston is 1 bedroom listings, making up 48.1% of the market. This suggests a strong demand for properties suitable for couples or solo travelers.
- Together, 1 bedroom and 3 bedrooms properties represent 62.9% of the active Airbnb listings in Batheaston, indicating a high concentration in these sizes.
- A significant 29.6% of listings offer 3+ bedrooms, catering to larger groups and families seeking more space in Batheaston.
Batheaston Vacation Rental Guest Capacity Trends (2025)
Distribution of Listings by Guest Capacity
Guest Capacity Insights for Batheaston
- The most common guest capacity trend in Batheaston vacation rentals is listings accommodating 2 guests (37%). This suggests the primary traveler segment is likely couples or solo travelers.
- Properties designed for 2 guests and 8+ guests dominate the Batheaston STR market, accounting for 51.8% of listings.
- 29.6% of properties accommodate 6+ guests, serving the market segment for larger families or group travel in Batheaston.
- On average, properties in Batheaston are equipped to host 4.0 guests.
Batheaston Airbnb Booking Patterns (2025): Available vs. Booked Days
Available Days Distribution
Booked Days Distribution
Booking Pattern Insights for Batheaston
- The most common availability pattern in Batheaston falls within the 271-366 days range, representing 40.7% of listings. This suggests many properties have significant open periods on their calendars.
- Approximately 74.0% of listings show high availability (181+ days open annually), indicating potential for increased bookings or specific owner usage patterns.
- For booked days, the 91-180 days range is most frequent in Batheaston (40.7%), reflecting common guest stay durations or potential owner blocking patterns.
- A notable 25.9% of properties secure long booking periods (181+ days booked per year), highlighting successful long-term rental strategies or significant owner usage.
Batheaston Airbnb Minimum Stay Requirements Analysis
Distribution of Listings by Minimum Night Requirement
1 Night
1 listings
4.2% of total
2 Nights
17 listings
70.8% of total
4-6 Nights
2 listings
8.3% of total
30+ Nights
4 listings
16.7% of total
Key Insights
- The most prevalent minimum stay requirement in Batheaston is 2 Nights, adopted by 70.8% of listings. This highlights the market's preference for shorter, flexible bookings.
- A strong majority (75.0%) of the Batheaston Airbnb data shows acceptance of very short stays (1-2 nights), indicating a dynamic, high-turnover market.
- A significant segment (16.7%) caters to monthly stays (30+ nights) in Batheaston, pointing to opportunities in the extended-stay market.
Recommendations
- Align with the market by considering a 2 Nights minimum stay, as 70.8% of Batheaston hosts use this setting.
- If feasible, allowing 1-night stays, especially midweek or during low season, could capture last-minute bookings, as only 4.2% currently do.
- A 2-night minimum appears standard (70.8%). Consider this for weekends or peak periods.
- Explore offering discounts for stays of 30+ nights to attract the 16.7% of the market seeking extended stays.
- Adjust minimum nights based on seasonality – potentially shorter during low season and longer during peak demand periods in Batheaston.
Batheaston Airbnb Cancellation Policy Trends Analysis (2025)
Flexible
5 listings
19.2% of total
Moderate
5 listings
19.2% of total
Firm
2 listings
7.7% of total
Strict
14 listings
53.8% of total
Cancellation Policy Insights for Batheaston
- The prevailing Airbnb cancellation policy trend in Batheaston is Strict, used by 53.8% of listings.
- A majority (61.5%) of hosts in Batheaston utilize Firm or Strict policies, indicating a market where hosts prioritize booking security.
Recommendations for Hosts
- Consider adopting a Strict policy to align with the 53.8% market standard in Batheaston.
- With 53.8% using Strict terms, this is a viable option in Batheaston, particularly for high-value properties or during peak demand periods.
- Regularly review your cancellation policy against competitors and market demand shifts in Batheaston.
Batheaston STR Booking Lead Time Analysis (2025)
Average Booking Lead Time by Month
Booking Lead Time Insights for Batheaston
- The overall average booking lead time for vacation rentals in Batheaston is 67 days.
- Guests book furthest in advance for stays during July (average 100 days), likely coinciding with peak travel demand or local events.
- The shortest booking windows occur for stays in February (average 50 days), indicating more last-minute travel plans during this time.
- Seasonally, Summer (83 days avg.) sees the longest lead times, while Winter (64 days avg.) has the shortest, reflecting typical travel planning cycles.
Recommendations for Hosts
- Use the overall average lead time (67 days) as a baseline for your pricing and availability strategy in Batheaston.
- For July stays, consider implementing length-of-stay discounts or slightly higher rates for bookings made less than 100 days out to capitalize on advance planning.
- Target marketing efforts for the Summer season well in advance (at least 83 days) to capture early planners.
- Monitor your own booking lead times against these Batheaston averages to identify opportunities for dynamic pricing adjustments.
Popular & Essential Airbnb Amenities in Batheaston (2025)
Amenity Prevalence
Amenity Insights for Batheaston
- Essential amenities in Batheaston that guests expect include: Heating, Carbon monoxide alarm, Wifi, Smoke alarm, Hot water. Lacking these (any) could significantly impact bookings.
- Popular amenities like Hangers, Hair dryer, Bed linens are common but not universal. Offering these can provide a competitive edge.
Recommendations for Hosts
- Ensure your listing includes all essential amenities for Batheaston: Heating, Carbon monoxide alarm, Wifi, Smoke alarm, Hot water.
- Prioritize adding missing essentials: Smoke alarm, Hot water.
- Consider adding popular differentiators like Hangers or Hair dryer to increase appeal.
- Highlight unique or less common amenities you offer (e.g., hot tub, dedicated workspace, EV charger) in your listing description and photos.
- Regularly check competitor amenities in Batheaston to stay competitive.
Batheaston Airbnb Guest Demographics & Profile Analysis (2025)
Guest Profile Summary for Batheaston
- The typical guest profile for Airbnb in Batheaston consists of primarily domestic travelers (82%), often arriving from nearby England, typically belonging to the Post-2000s (Gen Z/Alpha) group (50%), primarily speaking English or French.
- Domestic travelers account for 82.1% of guests.
- Key international markets include United Kingdom (82.1%) and United States (7.2%).
- Top languages spoken are English (70.9%) followed by French (7.8%).
- A significant demographic segment is the Post-2000s (Gen Z/Alpha) group, representing 50% of guests.
Recommendations for Hosts
- Target domestic marketing efforts towards travelers from England and London.
- Tailor amenities and listing descriptions to appeal to the dominant Post-2000s (Gen Z/Alpha) demographic (e.g., highlight fast WiFi, smart home features, local guides).
- Highlight unique local experiences or amenities relevant to the primary guest profile.
- Consider seasonal promotions aligned with peak travel times for key origin markets.
Nearby Short-Term Rental Market Comparison
How does the Batheaston Airbnb market stack up against its neighbors? Compare key performance metrics like average monthly revenue, ADR, and occupancy rates in surrounding areas to understand the broader regional STR landscape.
| Market | Active Properties | Monthly Revenue | Daily Rate | Avg. Occupancy |
|---|---|---|---|---|
| Englishcombe | 13 | $8,558 | $573.69 | 49% |
| Chew Magna | 14 | $6,649 | $399.59 | 46% |
| Lambourn | 11 | $6,081 | $669.47 | 28% |
| Long Sutton | 17 | $5,726 | $383.88 | 46% |
| Stoke St. Michael | 10 | $5,277 | $424.04 | 42% |
| Winsham | 10 | $5,154 | $484.22 | 52% |
| Oldland Common | 13 | $5,093 | $355.47 | 43% |
| Crai | 20 | $4,799 | $371.85 | 46% |
| Dinton | 11 | $4,637 | $242.16 | 58% |
| Limpley Stoke | 10 | $4,598 | $523.47 | 52% |