Arun Airbnb Market Analysis 2025: Short Term Rental Data & Vacation Rental Statistics in England, United Kingdom
Is Airbnb profitable in Arun in 2025? Explore comprehensive Airbnb analytics for Arun, England, United Kingdom to uncover income potential. This 2025 STR market report for Arun, based on AirROI data from April 2024 to March 2025, reveals key trends in the market of 627 active listings.
Whether you're considering an Airbnb investment in Arun, optimizing your existing vacation rental, or exploring rental arbitrage opportunities, understanding the Arun Airbnb data is crucial. Leveraging the low regulation environment is key to maximizing your short term rental income potential. Let's dive into the specifics.
Key Arun Airbnb Performance Metrics Overview
Monthly Airbnb Revenue Variations & Income Potential in Arun (2025)
Understanding the monthly revenue variations for Airbnb listings in Arun is key to maximizing your short term rental income potential. Seasonality significantly impacts earnings. Our analysis, based on data from the past 12 months, shows that the peak revenue month for STRs in Arun is typically August, while January often presents the lowest earnings, highlighting opportunities for strategic pricing adjustments during shoulder and low seasons. Explore the typical Airbnb income in Arun across different performance tiers:
- Best-in-class properties (Top 10%) achieve $6,740+ monthly, often utilizing dynamic pricing and superior guest experiences.
- Strong performing properties (Top 25%) earn $3,873 or more, indicating effective management and desirable locations/amenities.
- Typical properties (Median) generate around $2,086 per month, representing the average market performance.
- Entry-level properties (Bottom 25%) see earnings around $985, often with potential for optimization.
Average Monthly Airbnb Earnings Trend in Arun
Arun Airbnb Occupancy Rate Trends (2025)
Maximize your bookings by understanding the Arun STR occupancy trends. Seasonal demand shifts significantly influence how often properties are booked. Typically, Augustsees the highest demand (peak season occupancy), while March experiences the lowest (low season). Effective strategies, like adjusting minimum stays or offering promotions, can boost occupancy during slower periods. Here's how different property tiers perform in Arun:
- Best-in-class properties (Top 10%) achieve 81%+ occupancy, indicating high desirability and potentially optimized availability.
- Strong performing properties (Top 25%) maintain 61% or higher occupancy, suggesting good market fit and guest satisfaction.
- Typical properties (Median) have an occupancy rate around 39%.
- Entry-level properties (Bottom 25%) average 20% occupancy, potentially facing higher vacancy.
Average Monthly Occupancy Rate Trend in Arun
Average Daily Rate (ADR) Airbnb Trends in Arun (2025)
Effective short term rental pricing strategy in Arun involves understanding monthly ADR fluctuations. The Average Daily Rate (ADR) for Airbnb in Arun typically peaks in July and dips lowest during March. Leveraging Airbnb dynamic pricing tools or strategies based on this seasonality can significantly boost revenue. Here's a look at the typical nightly rates achieved:
- Best-in-class properties (Top 10%) command rates of $464+ per night, often due to premium features or locations.
- Strong performing properties (Top 25%) achieve nightly rates of $259 or more.
- Typical properties (Median) charge around $163 per night.
- Entry-level properties (Bottom 25%) earn around $106 per night.
Average Daily Rate (ADR) Trend by Month in Arun
Get Live Arun Market Intelligence 👇

Explore Real-time Analytics
Airbnb Seasonality Analysis & Trends in Arun (2025)
Peak Season (August, July, June)
- Revenue averages $4,166 per month
- Occupancy rates average 52.2%
- Daily rates average $245
Shoulder Season
- Revenue averages $3,014 per month
- Occupancy maintains around 41.7%
- Daily rates hold near $232
Low Season (January, February, March)
- Revenue drops to average $2,108 per month
- Occupancy decreases to average 33.4%
- Daily rates adjust to average $220
Seasonality Insights for Arun
- The Airbnb seasonality in Arun shows highly seasonal trends requiring careful strategy. While the sections above show seasonal averages, it's also insightful to look at the extremes:
- During the high season, the absolute peak month showcases Arun's highest earning potential, with monthly revenues capable of climbing to $4,693, occupancy reaching a high of 59.3%, and ADRs peaking at $249.
- Conversely, the slowest single month of the year, typically falling within the low season, marks the market's lowest point. In this month, revenue might dip to $2,033, occupancy could drop to 31.3%, and ADRs may adjust down to $219.
- Understanding both the seasonal averages and these monthly peaks and troughs in revenue, occupancy, and ADR is crucial for maximizing your Airbnb profit potential in Arun.
Seasonal Strategies for Maximizing Profit
- Peak Season: Maximize revenue through premium pricing and potentially longer minimum stays. Ensure high availability.
- Low Season: Offer competitive pricing, special promotions (e.g., extended stay discounts), and flexible cancellation policies. Target off-season travelers like remote workers or budget-conscious guests.
- Shoulder Seasons: Implement dynamic pricing that balances peak and low rates. Target weekend travelers or specific events. Offer slightly more flexible terms than peak season.
- Regularly analyze your own performance against these Arun seasonality benchmarks and adjust your pricing and availability strategy accordingly.
Best Areas for Airbnb Investment in Arun (2025)
Exploring the top neighborhoods for short-term rentals in Arun? This section highlights key areas, outlining why they are attractive for hosts and guests, along with notable local attractions. Consider these locations based on your target guest profile and investment strategy.
| Neighborhood / Area | Why Host Here? (Target Guests & Appeal) | Key Attractions & Landmarks |
|---|---|---|
| Arundel | Historic market town known for its medieval castle and stunning scenery. Perfect for guests looking for a quaint, picturesque English experience with access to nature and heritage sites. | Arundel Castle, Arundel Wetland Centre, St Nicholas Church, The Black Rabbit, Arundel Museum |
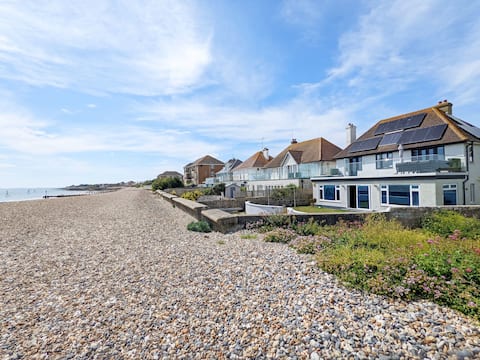
| Littlehampton | Seaside town with beautiful beaches and a family-friendly atmosphere. Ideal for families and beach lovers seeking relaxation and water activities. | Littlehampton Beach, East Beach Cafe, The Look and Sea Centre, Harbour Park, Littlehampton Marina |
| Bognor Regis | Popular seaside resort known for its sandy beaches and mild climate. A great destination for tourists seeking traditional British seaside experiences and family fun. | Bognor Regis Beach, Hotham Park, Butlins Bognor Regis, Pallant House Gallery, Royal British Legion Club |
| Pulborough | Quaint village located in rural West Sussex offering scenic countryside views. Attracts guests looking for tranquility and outdoor activities such as hiking and cycling. | Pulborough Brooks RSPB, St Mary's Church, South Downs National Park, The Vineyards, River Arun |
| Worthing | Coastal town with a vibrant arts scene and great shops. A lesser-known gem that provides a blend of culture, beach access, and scenic walks. | Worthing Pier, The Pavilion, Museum and Art Gallery, East Beach, Splashpoint Leisure Centre |
| Steyning | Charming medieval town nestled at the foot of the South Downs. Perfect for visitors looking for a historic atmosphere and outdoor activities. | Steyning Grammar School, St Andrew and St Cuthman Church, Steyning Museum, South Downs Way, The River Adur |
| Amberley | Picture-postcard village famous for its chalk cliffs and scenic countryside. A delight for nature lovers and those wanting to escape to the countryside. | Amberley Museum, South Downs National Park, Amberley Castle, River Arun, The Old Town |
| Henfield | Lovely village with a strong community feel, surrounded by countryside. An ideal base for exploring the hamlets and villages of Sussex. | Henfield Museum, St Peter's Church, Henfield Common, The Henfield Haven, The River Adur |
Understanding Airbnb License Requirements & STR Laws in Arun (2025)
While Arun, England, United Kingdom currently shows low STR regulations, specific Airbnb license requirements might still exist or change. Always verify the latest short term rental regulations and Airbnb license requirements directly with local government authorities for Arun to ensure full compliance before hosting.
(Source: AirROI data, 2025, finding no licensed listings among those analyzed)
Top Performing Airbnb Properties in Arun (2025)
Benchmark your potential! Explore examples of top-performing Airbnb properties in Arunbased on Trailing Twelve Month (TTM) revenue. Analyze their characteristics, revenue, occupancy rate, and ADR to understand what drives success in this market.
Beach View
Entire Place • 5 bedrooms
SEASONG, LUXURY ON THE BEACH HSE FOR 12 & HOT TUB
Entire Place • 6 bedrooms
Garden View - Aldingbourne
Entire Place • 1 bedroom
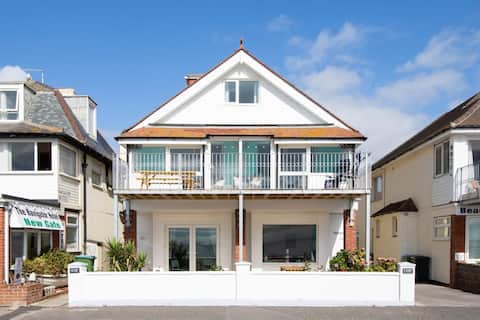
Beautiful Beachfront House wth Balcony & Sea Views
Entire Place • 10 bedrooms

Stunning Large House Near Beach
Entire Place • 8 bedrooms
5* luxury 16 person beach house
Entire Place • 8 bedrooms
Note: Performance varies based on location, size, amenities, seasonality, and management quality. Data reflects the past 12 months.
Top Performing Airbnb Hosts in Arun (2025)
Learn from the best! This table showcases top-performing Airbnb hosts in Arun based on the number of properties managed and estimated total revenue over the past year. Analyze their scale and performance metrics.
| Host Name | Properties | Grossing Revenue | Stay Reviews | Avg Rating |
|---|---|---|---|---|
| Henry Adams Holiday Cottages | 30 | $1,440,825 | 303 | 3.00/5.0 |
| Cottages | 28 | $757,950 | 157 | 3.05/5.0 |
| Fresh Air Holidays | 7 | $555,564 | 540 | 4.77/5.0 |
| Jack | 5 | $512,945 | 774 | 4.96/5.0 |
| Laura | 14 | $469,880 | 488 | 4.87/5.0 |
| Emma | 2 | $377,599 | 117 | 5.00/5.0 |
| Emma | 11 | $318,147 | 652 | 4.96/5.0 |
| The Butler Getaway Group | 4 | $223,283 | 362 | 4.91/5.0 |
| Matt And Adrian | 6 | $217,403 | 202 | 4.86/5.0 |
| Jo | 5 | $216,945 | 129 | 4.92/5.0 |
Analyzing the strategies of top hosts, such as their property selection, pricing, and guest communication, can offer valuable lessons for optimizing your own Airbnb operations in Arun.
Dive Deeper: Advanced Arun STR Market Data (2025)
Ready to unlock more insights? AirROI provides access to advanced metrics and comprehensive Airbnb data for Arun. Explore detailed analytics beyond this report to refine your investment strategy, optimize pricing, and maximize your vacation rental profits.
Explore Advanced MetricsArun Short-Term Rental Market Composition (2025): Property & Room Types
Room Type Distribution
Property Type Distribution
Market Composition Insights for Arun
- The Arun Airbnb market composition is heavily skewed towards Entire Home/Apt listings, which make up 79.7% of the 627 active rentals. This indicates strong guest preference for privacy and space.
- Looking at the property type distribution in Arun, House properties are the most common (57.4%), reflecting the local real estate landscape.
- Houses represent a significant 57.4% portion, catering likely to families or larger groups.
- The presence of 6.9% Hotel/Boutique listings indicates integration with traditional hospitality.
- Smaller segments like unique stays (combined 3.3%) offer potential for unique stay experiences.
Arun Airbnb Room Capacity Analysis (2025): Bedroom Distribution
Distribution of Listings by Number of Bedrooms
Room Capacity Insights for Arun
- The dominant room capacity in Arun is 1 bedroom listings, making up 34.9% of the market. This suggests a strong demand for properties suitable for couples or solo travelers.
- Together, 1 bedroom and 2 bedrooms properties represent 57.7% of the active Airbnb listings in Arun, indicating a high concentration in these sizes.
- A significant 26.7% of listings offer 3+ bedrooms, catering to larger groups and families seeking more space in Arun.
Arun Vacation Rental Guest Capacity Trends (2025)
Distribution of Listings by Guest Capacity
Guest Capacity Insights for Arun
- The most common guest capacity trend in Arun vacation rentals is listings accommodating 2 guests (27.8%). This suggests the primary traveler segment is likely couples or solo travelers.
- Properties designed for 2 guests and 4 guests dominate the Arun STR market, accounting for 50.4% of listings.
- 26.4% of properties accommodate 6+ guests, serving the market segment for larger families or group travel in Arun.
- On average, properties in Arun are equipped to host 3.7 guests.
Arun Airbnb Booking Patterns (2025): Available vs. Booked Days
Available Days Distribution
Booked Days Distribution
Booking Pattern Insights for Arun
- The most common availability pattern in Arun falls within the 271-366 days range, representing 37.5% of listings. This suggests many properties have significant open periods on their calendars.
- Approximately 71.3% of listings show high availability (181+ days open annually), indicating potential for increased bookings or specific owner usage patterns.
- For booked days, the 91-180 days range is most frequent in Arun (34%), reflecting common guest stay durations or potential owner blocking patterns.
- A notable 30.3% of properties secure long booking periods (181+ days booked per year), highlighting successful long-term rental strategies or significant owner usage.
Arun Airbnb Minimum Stay Requirements Analysis
Distribution of Listings by Minimum Night Requirement
1 Night
174 listings
29.5% of total
2 Nights
208 listings
35.3% of total
3 Nights
79 listings
13.4% of total
4-6 Nights
26 listings
4.4% of total
7-29 Nights
6 listings
1% of total
30+ Nights
96 listings
16.3% of total
Key Insights
- The most prevalent minimum stay requirement in Arun is 2 Nights, adopted by 35.3% of listings. This highlights the market's preference for shorter, flexible bookings.
- A strong majority (64.8%) of the Arun Airbnb data shows acceptance of very short stays (1-2 nights), indicating a dynamic, high-turnover market.
- A significant segment (16.3%) caters to monthly stays (30+ nights) in Arun, pointing to opportunities in the extended-stay market.
Recommendations
- Align with the market by considering a 2 Nights minimum stay, as 35.3% of Arun hosts use this setting.
- If feasible, allowing 1-night stays, especially midweek or during low season, could capture last-minute bookings, as only 29.5% currently do.
- Explore offering discounts for stays of 30+ nights to attract the 16.3% of the market seeking extended stays.
- Adjust minimum nights based on seasonality – potentially shorter during low season and longer during peak demand periods in Arun.
Arun Airbnb Cancellation Policy Trends Analysis (2025)
Super Strict 30 Days
17 listings
3% of total
Super Strict 60 Days
27 listings
4.8% of total
Refundable
1 listings
0.2% of total
Non-refundable
5 listings
0.9% of total
Flexible
110 listings
19.7% of total
Moderate
158 listings
28.3% of total
Firm
124 listings
22.2% of total
Strict
117 listings
20.9% of total
Cancellation Policy Insights for Arun
- The prevailing Airbnb cancellation policy trend in Arun is Moderate, used by 28.3% of listings.
- There's a relatively balanced mix between guest-friendly (48.0%) and stricter (43.1%) policies, offering choices for different guest needs.
Recommendations for Hosts
- Consider adopting a Moderate policy to align with the 28.3% market standard in Arun.
- Regularly review your cancellation policy against competitors and market demand shifts in Arun.
Arun STR Booking Lead Time Analysis (2025)
Average Booking Lead Time by Month
Booking Lead Time Insights for Arun
- The overall average booking lead time for vacation rentals in Arun is 57 days.
- Guests book furthest in advance for stays during July (average 106 days), likely coinciding with peak travel demand or local events.
- The shortest booking windows occur for stays in February (average 40 days), indicating more last-minute travel plans during this time.
- Seasonally, Summer (84 days avg.) sees the longest lead times, while Winter (50 days avg.) has the shortest, reflecting typical travel planning cycles.
Recommendations for Hosts
- Use the overall average lead time (57 days) as a baseline for your pricing and availability strategy in Arun.
- For July stays, consider implementing length-of-stay discounts or slightly higher rates for bookings made less than 106 days out to capitalize on advance planning.
- Target marketing efforts for the Summer season well in advance (at least 84 days) to capture early planners.
- Monitor your own booking lead times against these Arun averages to identify opportunities for dynamic pricing adjustments.
Popular & Essential Airbnb Amenities in Arun (2025)
Amenity Prevalence
Amenity Insights for Arun
- Essential amenities in Arun that guests expect include: Smoke alarm, Wifi, Heating. Lacking these (any) could significantly impact bookings.
- Popular amenities like TV, Hot water, Essentials are common but not universal. Offering these can provide a competitive edge.
Recommendations for Hosts
- Ensure your listing includes all essential amenities for Arun: Smoke alarm, Wifi, Heating.
- Prioritize adding missing essentials: Smoke alarm, Wifi, Heating.
- Consider adding popular differentiators like TV or Hot water to increase appeal.
- Highlight unique or less common amenities you offer (e.g., hot tub, dedicated workspace, EV charger) in your listing description and photos.
- Regularly check competitor amenities in Arun to stay competitive.
Arun Airbnb Guest Demographics & Profile Analysis (2025)
Guest Profile Summary for Arun
- The typical guest profile for Airbnb in Arun consists of primarily domestic travelers (88%), often arriving from nearby England, typically belonging to the Post-2000s (Gen Z/Alpha) group (50%), primarily speaking English or French.
- Domestic travelers account for 88.3% of guests.
- Key international markets include United Kingdom (88.3%) and United States (2.6%).
- Top languages spoken are English (66.8%) followed by French (8.9%).
- A significant demographic segment is the Post-2000s (Gen Z/Alpha) group, representing 50% of guests.
Recommendations for Hosts
- Target domestic marketing efforts towards travelers from England and London.
- Tailor amenities and listing descriptions to appeal to the dominant Post-2000s (Gen Z/Alpha) demographic (e.g., highlight fast WiFi, smart home features, local guides).
- Highlight unique local experiences or amenities relevant to the primary guest profile.
- Consider seasonal promotions aligned with peak travel times for key origin markets.
Nearby Short-Term Rental Market Comparison
How does the Arun Airbnb market stack up against its neighbors? Compare key performance metrics like average monthly revenue, ADR, and occupancy rates in surrounding areas to understand the broader regional STR landscape.
| Market | Active Properties | Monthly Revenue | Daily Rate | Avg. Occupancy |
|---|---|---|---|---|
| Dorney | 12 | $8,335 | $622.48 | 45% |
| Lambourn | 11 | $6,081 | $669.47 | 28% |
| City of Westminster | 1,327 | $6,043 | $486.66 | 52% |
| La Poterie-Cap-d'Antifer | 11 | $5,076 | $293.95 | 55% |
| Wraysbury | 14 | $4,719 | $396.18 | 46% |
| Old Windsor | 22 | $4,655 | $347.12 | 54% |
| Dinton | 11 | $4,637 | $242.16 | 58% |
| Kintbury | 12 | $4,015 | $250.13 | 54% |
| Nettlestone | 26 | $3,980 | $391.99 | 42% |
| Cotswold District | 1,829 | $3,905 | $362.83 | 44% |