Allhallows Airbnb Market Analysis 2025: Short Term Rental Data & Vacation Rental Statistics in England, United Kingdom
Is Airbnb profitable in Allhallows in 2025? Explore comprehensive Airbnb analytics for Allhallows, England, United Kingdom to uncover income potential. This 2025 STR market report for Allhallows, based on AirROI data from April 2024 to March 2025, reveals key trends in the niche market of 21 active listings.
Whether you're considering an Airbnb investment in Allhallows, optimizing your existing vacation rental, or exploring rental arbitrage opportunities, understanding the Allhallows Airbnb data is crucial. Leveraging the low regulation environment is key to maximizing your short term rental income potential. Let's dive into the specifics.
Key Allhallows Airbnb Performance Metrics Overview
Monthly Airbnb Revenue Variations & Income Potential in Allhallows (2025)
Understanding the monthly revenue variations for Airbnb listings in Allhallows is key to maximizing your short term rental income potential. Seasonality significantly impacts earnings. Our analysis, based on data from the past 12 months, shows that the peak revenue month for STRs in Allhallows is typically May, while September often presents the lowest earnings, highlighting opportunities for strategic pricing adjustments during shoulder and low seasons. Explore the typical Airbnb income in Allhallows across different performance tiers:
- Best-in-class properties (Top 10%) achieve $8,465+ monthly, often utilizing dynamic pricing and superior guest experiences.
- Strong performing properties (Top 25%) earn $3,675 or more, indicating effective management and desirable locations/amenities.
- Typical properties (Median) generate around $2,009 per month, representing the average market performance.
- Entry-level properties (Bottom 25%) see earnings around $720, often with potential for optimization.
Average Monthly Airbnb Earnings Trend in Allhallows
Allhallows Airbnb Occupancy Rate Trends (2025)
Maximize your bookings by understanding the Allhallows STR occupancy trends. Seasonal demand shifts significantly influence how often properties are booked. Typically, Augustsees the highest demand (peak season occupancy), while March experiences the lowest (low season). Effective strategies, like adjusting minimum stays or offering promotions, can boost occupancy during slower periods. Here's how different property tiers perform in Allhallows:
- Best-in-class properties (Top 10%) achieve 76%+ occupancy, indicating high desirability and potentially optimized availability.
- Strong performing properties (Top 25%) maintain 52% or higher occupancy, suggesting good market fit and guest satisfaction.
- Typical properties (Median) have an occupancy rate around 30%.
- Entry-level properties (Bottom 25%) average 17% occupancy, potentially facing higher vacancy.
Average Monthly Occupancy Rate Trend in Allhallows
Average Daily Rate (ADR) Airbnb Trends in Allhallows (2025)
Effective short term rental pricing strategy in Allhallows involves understanding monthly ADR fluctuations. The Average Daily Rate (ADR) for Airbnb in Allhallows typically peaks in August and dips lowest during January. Leveraging Airbnb dynamic pricing tools or strategies based on this seasonality can significantly boost revenue. Here's a look at the typical nightly rates achieved:
- Best-in-class properties (Top 10%) command rates of $367+ per night, often due to premium features or locations.
- Strong performing properties (Top 25%) achieve nightly rates of $195 or more.
- Typical properties (Median) charge around $125 per night.
- Entry-level properties (Bottom 25%) earn around $106 per night.
Average Daily Rate (ADR) Trend by Month in Allhallows
Get Live Allhallows Market Intelligence 👇

Explore Real-time Analytics
Airbnb Seasonality Analysis & Trends in Allhallows (2025)
Peak Season (May, April, July)
- Revenue averages $4,776 per month
- Occupancy rates average 42.5%
- Daily rates average $229
Shoulder Season
- Revenue averages $3,051 per month
- Occupancy maintains around 37.2%
- Daily rates hold near $201
Low Season (March, September, November)
- Revenue drops to average $1,833 per month
- Occupancy decreases to average 32.4%
- Daily rates adjust to average $199
Seasonality Insights for Allhallows
- The Airbnb seasonality in Allhallows shows highly seasonal trends requiring careful strategy. While the sections above show seasonal averages, it's also insightful to look at the extremes:
- During the high season, the absolute peak month showcases Allhallows's highest earning potential, with monthly revenues capable of climbing to $5,704, occupancy reaching a high of 53.7%, and ADRs peaking at $235.
- Conversely, the slowest single month of the year, typically falling within the low season, marks the market's lowest point. In this month, revenue might dip to $1,363, occupancy could drop to 25.6%, and ADRs may adjust down to $171.
- Understanding both the seasonal averages and these monthly peaks and troughs in revenue, occupancy, and ADR is crucial for maximizing your Airbnb profit potential in Allhallows.
Seasonal Strategies for Maximizing Profit
- Peak Season: Maximize revenue through premium pricing and potentially longer minimum stays. Ensure high availability.
- Low Season: Offer competitive pricing, special promotions (e.g., extended stay discounts), and flexible cancellation policies. Target off-season travelers like remote workers or budget-conscious guests.
- Shoulder Seasons: Implement dynamic pricing that balances peak and low rates. Target weekend travelers or specific events. Offer slightly more flexible terms than peak season.
- Regularly analyze your own performance against these Allhallows seasonality benchmarks and adjust your pricing and availability strategy accordingly.
Best Areas for Airbnb Investment in Allhallows (2025)
Exploring the top neighborhoods for short-term rentals in Allhallows? This section highlights key areas, outlining why they are attractive for hosts and guests, along with notable local attractions. Consider these locations based on your target guest profile and investment strategy.
| Neighborhood / Area | Why Host Here? (Target Guests & Appeal) | Key Attractions & Landmarks |
|---|---|---|
| Allhallows Beach | A picturesque coastal area attracting visitors for its serene beaches and proximity to nature reserves. Ideal for families and couples looking for quiet beach retreats and outdoor activities. | Allhallows Beach, Medway Marshes Nature Reserve, Richborough Fort, Shorne Woods Country Park, Gillingham Marina |
| Rochester | Historic town with a rich cultural heritage, featuring Dickensian influences. Popular with tourists interested in history, literature, and architecture. | Rochester Castle, Dickens World, Rochester Cathedral, Eastgate House, The Castle Gardens |
| Chatham | A vibrant town with a rich maritime history and cultural attractions. It offers a dynamic mix of shopping, dining, and entertainment options. | Chatham Historic Dockyard, Fort Amherst, Medway High Street, Pentagon Shopping Centre |
| Strood | Conveniently located with access to both the countryside and urban life, Strood is ideal for visitors exploring the Medway area. | Strood station, Riverside Country Park, Fort Pitt |
| Gillingham | A growing town with strong transport links and a variety of amenities. Appeal to both business travelers and leisure visitors. | Gillingham Marina, Medway Park, Gillingham Golf Club, Riverside Country Park |
| Minster-on-Sea | A quieter coastal village on Sheppey Island, perfect for visitors wanting peace and natural beauty, with easy access to beaches. | Minster Abbey, Shellness Beach, Sheerness Beach, Sheppey Heritage Centre |
| Sittingbourne | An emerging destination with a mix of modern and traditional offerings. Visitors enjoy its local attractions and connections to London. | Sittingbourne Railway, Milton Creek Country Park, The Forum Shopping Centre, Sittingbourne Heritage Museum |
| Rainham | Charming village located close to the River Medway, offering historic sites and a friendly community atmosphere. Great for peaceful retreats. | Rainham Hall, Riverside Country Park, Medway Marshes |
Understanding Airbnb License Requirements & STR Laws in Allhallows (2025)
While Allhallows, England, United Kingdom currently shows low STR regulations, specific Airbnb license requirements might still exist or change. Always verify the latest short term rental regulations and Airbnb license requirements directly with local government authorities for Allhallows to ensure full compliance before hosting.
(Source: AirROI data, 2025, finding no licensed listings among those analyzed)
Top Performing Airbnb Properties in Allhallows (2025)
Benchmark your potential! Explore examples of top-performing Airbnb properties in Allhallowsbased on Trailing Twelve Month (TTM) revenue. Analyze their characteristics, revenue, occupancy rate, and ADR to understand what drives success in this market.
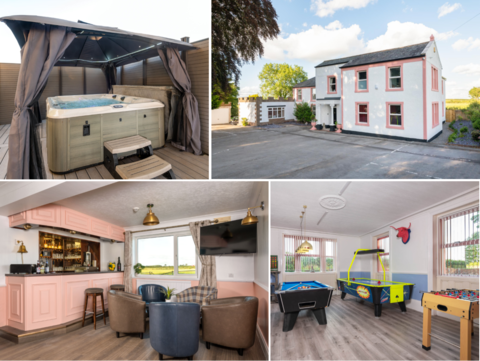
Big Pink House | 15+ | Hot Tub | Games Room
Entire Place • 9 bedrooms

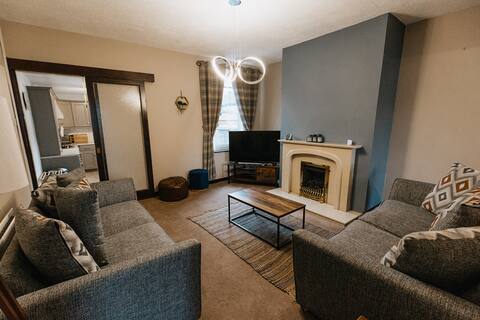
Whitehall Pele Tower
Entire Place • 4 bedrooms

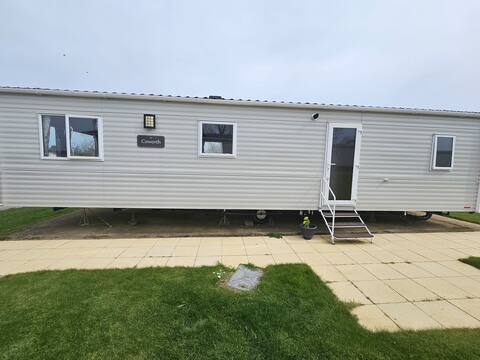
6 Berth - 2 Bedroom 2023edition Caravan at Haven
Entire Place • 2 bedrooms
3 Bed Accommodation in Cumbria with Amazing Views
Entire Place • 3 bedrooms
Caravan kent coast Holiday park
Entire Place • 2 bedrooms

Honeypot Haven Holiday Home
Entire Place • 3 bedrooms
Note: Performance varies based on location, size, amenities, seasonality, and management quality. Data reflects the past 12 months.
Top Performing Airbnb Hosts in Allhallows (2025)
Learn from the best! This table showcases top-performing Airbnb hosts in Allhallows based on the number of properties managed and estimated total revenue over the past year. Analyze their scale and performance metrics.
| Host Name | Properties | Grossing Revenue | Stay Reviews | Avg Rating |
|---|---|---|---|---|
| Lorna | 1 | $136,145 | 16 | 4.81/5.0 |
| Cottages | 1 | $63,342 | 10 | 4.60/5.0 |
| David | 1 | $35,308 | 27 | 4.96/5.0 |
| Ben | 1 | $34,727 | 18 | 4.72/5.0 |
| Danielle | 1 | $27,025 | 25 | 4.68/5.0 |
| Tyler | 1 | $26,025 | 10 | 5.00/5.0 |
| Terri | 1 | $22,123 | 3 | 4.67/5.0 |
| Laura | 1 | $19,607 | 25 | 4.96/5.0 |
| Host #365106672 | 1 | $18,485 | 0 | 0.00/5.0 |
| Host #148665421 | 1 | $18,334 | 3 | 3.33/5.0 |
Analyzing the strategies of top hosts, such as their property selection, pricing, and guest communication, can offer valuable lessons for optimizing your own Airbnb operations in Allhallows.
Dive Deeper: Advanced Allhallows STR Market Data (2025)
Ready to unlock more insights? AirROI provides access to advanced metrics and comprehensive Airbnb data for Allhallows. Explore detailed analytics beyond this report to refine your investment strategy, optimize pricing, and maximize your vacation rental profits.
Explore Advanced MetricsAllhallows Short-Term Rental Market Composition (2025): Property & Room Types
Room Type Distribution
Property Type Distribution
Market Composition Insights for Allhallows
- The Allhallows Airbnb market composition is heavily skewed towards Entire Home/Apt listings, which make up 95.2% of the 21 active rentals. This indicates strong guest preference for privacy and space.
- Looking at the property type distribution in Allhallows, House properties are the most common (61.9%), reflecting the local real estate landscape.
- Houses represent a significant 61.9% portion, catering likely to families or larger groups.
Allhallows Airbnb Room Capacity Analysis (2025): Bedroom Distribution
Distribution of Listings by Number of Bedrooms
Room Capacity Insights for Allhallows
- The dominant room capacity in Allhallows is 2 bedrooms listings, making up 52.4% of the market. This suggests a strong demand for properties suitable for couples or solo travelers.
- Together, 2 bedrooms and 3 bedrooms properties represent 85.7% of the active Airbnb listings in Allhallows, indicating a high concentration in these sizes.
- A significant 42.9% of listings offer 3+ bedrooms, catering to larger groups and families seeking more space in Allhallows.
Allhallows Vacation Rental Guest Capacity Trends (2025)
Distribution of Listings by Guest Capacity
Guest Capacity Insights for Allhallows
- The most common guest capacity trend in Allhallows vacation rentals is listings accommodating 6 guests (52.4%). This suggests the primary traveler segment is likely larger groups.
- Properties designed for 6 guests and 4 guests dominate the Allhallows STR market, accounting for 76.2% of listings.
- 66.7% of properties accommodate 6+ guests, serving the market segment for larger families or group travel in Allhallows.
- On average, properties in Allhallows are equipped to host 5.4 guests.
Allhallows Airbnb Booking Patterns (2025): Available vs. Booked Days
Available Days Distribution
Booked Days Distribution
Booking Pattern Insights for Allhallows
- The most common availability pattern in Allhallows falls within the 181-270 days range, representing 42.9% of listings. This suggests many properties have significant open periods on their calendars.
- Approximately 81.0% of listings show high availability (181+ days open annually), indicating potential for increased bookings or specific owner usage patterns.
- For booked days, the 91-180 days range is most frequent in Allhallows (38.1%), reflecting common guest stay durations or potential owner blocking patterns.
- A notable 23.8% of properties secure long booking periods (181+ days booked per year), highlighting successful long-term rental strategies or significant owner usage.
Allhallows Airbnb Minimum Stay Requirements Analysis
Distribution of Listings by Minimum Night Requirement
1 Night
6 listings
31.6% of total
2 Nights
8 listings
42.1% of total
3 Nights
4 listings
21.1% of total
30+ Nights
1 listings
5.3% of total
Key Insights
- The most prevalent minimum stay requirement in Allhallows is 2 Nights, adopted by 42.1% of listings. This highlights the market's preference for shorter, flexible bookings.
- A strong majority (73.7%) of the Allhallows Airbnb data shows acceptance of very short stays (1-2 nights), indicating a dynamic, high-turnover market.
Recommendations
- Align with the market by considering a 2 Nights minimum stay, as 42.1% of Allhallows hosts use this setting.
- Explore offering discounts for stays of 30+ nights to attract the 5.3% of the market seeking extended stays.
- Adjust minimum nights based on seasonality – potentially shorter during low season and longer during peak demand periods in Allhallows.
Allhallows Airbnb Cancellation Policy Trends Analysis (2025)
Super Strict 60 Days
1 listings
6.3% of total
Flexible
3 listings
18.8% of total
Moderate
6 listings
37.5% of total
Firm
4 listings
25% of total
Strict
2 listings
12.5% of total
Cancellation Policy Insights for Allhallows
- The prevailing Airbnb cancellation policy trend in Allhallows is Moderate, used by 37.5% of listings.
- There's a relatively balanced mix between guest-friendly (56.3%) and stricter (37.5%) policies, offering choices for different guest needs.
Recommendations for Hosts
- Consider adopting a Moderate policy to align with the 37.5% market standard in Allhallows.
- Using a Strict policy might deter some guests, as only 12.5% of listings use it. Evaluate if potential revenue protection outweighs possible lower booking rates.
- Regularly review your cancellation policy against competitors and market demand shifts in Allhallows.
Allhallows STR Booking Lead Time Analysis (2025)
Average Booking Lead Time by Month
Booking Lead Time Insights for Allhallows
- The overall average booking lead time for vacation rentals in Allhallows is 54 days.
- Guests book furthest in advance for stays during January (average 93 days), likely coinciding with peak travel demand or local events.
- The shortest booking windows occur for stays in September (average 30 days), indicating more last-minute travel plans during this time.
- Seasonally, Winter (78 days avg.) sees the longest lead times, while Spring (46 days avg.) has the shortest, reflecting typical travel planning cycles.
Recommendations for Hosts
- Use the overall average lead time (54 days) as a baseline for your pricing and availability strategy in Allhallows.
- For January stays, consider implementing length-of-stay discounts or slightly higher rates for bookings made less than 93 days out to capitalize on advance planning.
- Target marketing efforts for the Winter season well in advance (at least 78 days) to capture early planners.
- Monitor your own booking lead times against these Allhallows averages to identify opportunities for dynamic pricing adjustments.
Popular & Essential Airbnb Amenities in Allhallows (2025)
Amenity Prevalence
Amenity Insights for Allhallows
- Essential amenities in Allhallows that guests expect include: Smoke alarm, Kitchen, Carbon monoxide alarm, Free parking on premises, TV. Lacking these (any) could significantly impact bookings.
- Popular amenities like Heating, Hot water, Refrigerator are common but not universal. Offering these can provide a competitive edge.
- Warning: Wifi is not universally provided but is considered essential globally. Ensure reliable Wifi is offered.
Recommendations for Hosts
- Ensure your listing includes all essential amenities for Allhallows: Smoke alarm, Kitchen, Carbon monoxide alarm, Free parking on premises, TV.
- Prioritize adding missing essentials: Carbon monoxide alarm, Free parking on premises, TV.
- Consider adding popular differentiators like Heating or Hot water to increase appeal.
- Highlight unique or less common amenities you offer (e.g., hot tub, dedicated workspace, EV charger) in your listing description and photos.
- Regularly check competitor amenities in Allhallows to stay competitive.
Allhallows Airbnb Guest Demographics & Profile Analysis (2025)
Guest Profile Summary for Allhallows
- The typical guest profile for Airbnb in Allhallows consists of primarily domestic travelers (92%), often arriving from nearby England, typically belonging to the Post-2000s (Gen Z/Alpha) group (50%), primarily speaking English or German.
- Domestic travelers account for 92.1% of guests.
- Key international markets include United Kingdom (92.1%) and Australia (3.4%).
- Top languages spoken are English (74.5%) followed by German (3.9%).
- A significant demographic segment is the Post-2000s (Gen Z/Alpha) group, representing 50% of guests.
Recommendations for Hosts
- Target domestic marketing efforts towards travelers from England and London.
- Tailor amenities and listing descriptions to appeal to the dominant Post-2000s (Gen Z/Alpha) demographic (e.g., highlight fast WiFi, smart home features, local guides).
- Highlight unique local experiences or amenities relevant to the primary guest profile.
- Consider seasonal promotions aligned with peak travel times for key origin markets.
Nearby Short-Term Rental Market Comparison
How does the Allhallows Airbnb market stack up against its neighbors? Compare key performance metrics like average monthly revenue, ADR, and occupancy rates in surrounding areas to understand the broader regional STR landscape.
| Market | Active Properties | Monthly Revenue | Daily Rate | Avg. Occupancy |
|---|---|---|---|---|
| Englishcombe | 13 | $8,558 | $573.69 | 49% |
| Dorney | 12 | $8,335 | $622.48 | 45% |
| Chew Magna | 14 | $6,649 | $399.59 | 46% |
| Lambourn | 11 | $6,081 | $669.47 | 28% |
| City of Westminster | 1,327 | $6,043 | $486.66 | 52% |
| Long Sutton | 17 | $5,726 | $383.88 | 46% |
| Stoke St. Michael | 10 | $5,277 | $424.04 | 42% |
| Oldland Common | 13 | $5,093 | $355.47 | 43% |
| Wraysbury | 14 | $4,719 | $396.18 | 46% |
| Stamford Bridge | 11 | $4,669 | $410.14 | 38% |