Tropea Airbnb Market Analysis 2025: Short Term Rental Data & Vacation Rental Statistics in Vibo Valentia, Italy
Is Airbnb profitable in Tropea in 2025? Explore comprehensive Airbnb analytics for Tropea, Vibo Valentia, Italy to uncover income potential. This 2025 STR market report for Tropea, based on AirROI data from April 2024 to March 2025, reveals key trends in the market of 404 active listings.
Whether you're considering an Airbnb investment in Tropea, optimizing your existing vacation rental, or exploring rental arbitrage opportunities, understanding the Tropea Airbnb data is crucial. Navigating the high regulation landscape is key to maximizing your short term rental income potential. Let's dive into the specifics.
Key Tropea Airbnb Performance Metrics Overview
Monthly Airbnb Revenue Variations & Income Potential in Tropea (2025)
Understanding the monthly revenue variations for Airbnb listings in Tropea is key to maximizing your short term rental income potential. Seasonality significantly impacts earnings. Our analysis, based on data from the past 12 months, shows that the peak revenue month for STRs in Tropea is typically August, while December often presents the lowest earnings, highlighting opportunities for strategic pricing adjustments during shoulder and low seasons. Explore the typical Airbnb income in Tropea across different performance tiers:
- Best-in-class properties (Top 10%) achieve $3,658+ monthly, often utilizing dynamic pricing and superior guest experiences.
- Strong performing properties (Top 25%) earn $2,265 or more, indicating effective management and desirable locations/amenities.
- Typical properties (Median) generate around $1,270 per month, representing the average market performance.
- Entry-level properties (Bottom 25%) see earnings around $624, often with potential for optimization.
Average Monthly Airbnb Earnings Trend in Tropea
Tropea Airbnb Occupancy Rate Trends (2025)
Maximize your bookings by understanding the Tropea STR occupancy trends. Seasonal demand shifts significantly influence how often properties are booked. Typically, Augustsees the highest demand (peak season occupancy), while December experiences the lowest (low season). Effective strategies, like adjusting minimum stays or offering promotions, can boost occupancy during slower periods. Here's how different property tiers perform in Tropea:
- Best-in-class properties (Top 10%) achieve 74%+ occupancy, indicating high desirability and potentially optimized availability.
- Strong performing properties (Top 25%) maintain 55% or higher occupancy, suggesting good market fit and guest satisfaction.
- Typical properties (Median) have an occupancy rate around 33%.
- Entry-level properties (Bottom 25%) average 14% occupancy, potentially facing higher vacancy.
Average Monthly Occupancy Rate Trend in Tropea
Average Daily Rate (ADR) Airbnb Trends in Tropea (2025)
Effective short term rental pricing strategy in Tropea involves understanding monthly ADR fluctuations. The Average Daily Rate (ADR) for Airbnb in Tropea typically peaks in August and dips lowest during November. Leveraging Airbnb dynamic pricing tools or strategies based on this seasonality can significantly boost revenue. Here's a look at the typical nightly rates achieved:
- Best-in-class properties (Top 10%) command rates of $233+ per night, often due to premium features or locations.
- Strong performing properties (Top 25%) achieve nightly rates of $161 or more.
- Typical properties (Median) charge around $111 per night.
- Entry-level properties (Bottom 25%) earn around $81 per night.
Average Daily Rate (ADR) Trend by Month in Tropea
Get Live Tropea Market Intelligence 👇

Explore Real-time Analytics
Airbnb Seasonality Analysis & Trends in Tropea (2025)
Peak Season (August, July, September)
- Revenue averages $2,944 per month
- Occupancy rates average 54.5%
- Daily rates average $158
Shoulder Season
- Revenue averages $1,574 per month
- Occupancy maintains around 35.0%
- Daily rates hold near $135
Low Season (January, March, December)
- Revenue drops to average $728 per month
- Occupancy decreases to average 22.6%
- Daily rates adjust to average $134
Seasonality Insights for Tropea
- The Airbnb seasonality in Tropea shows highly seasonal trends requiring careful strategy. While the sections above show seasonal averages, it's also insightful to look at the extremes:
- During the high season, the absolute peak month showcases Tropea's highest earning potential, with monthly revenues capable of climbing to $3,515, occupancy reaching a high of 57.8%, and ADRs peaking at $172.
- Conversely, the slowest single month of the year, typically falling within the low season, marks the market's lowest point. In this month, revenue might dip to $555, occupancy could drop to 17.9%, and ADRs may adjust down to $129.
- Understanding both the seasonal averages and these monthly peaks and troughs in revenue, occupancy, and ADR is crucial for maximizing your Airbnb profit potential in Tropea.
Seasonal Strategies for Maximizing Profit
- Peak Season: Maximize revenue through premium pricing and potentially longer minimum stays. Ensure high availability.
- Low Season: Offer competitive pricing, special promotions (e.g., extended stay discounts), and flexible cancellation policies. Target off-season travelers like remote workers or budget-conscious guests.
- Shoulder Seasons: Implement dynamic pricing that balances peak and low rates. Target weekend travelers or specific events. Offer slightly more flexible terms than peak season.
- Regularly analyze your own performance against these Tropea seasonality benchmarks and adjust your pricing and availability strategy accordingly.
Best Areas for Airbnb Investment in Tropea (2025)
Exploring the top neighborhoods for short-term rentals in Tropea? This section highlights key areas, outlining why they are attractive for hosts and guests, along with notable local attractions. Consider these locations based on your target guest profile and investment strategy.
| Neighborhood / Area | Why Host Here? (Target Guests & Appeal) | Key Attractions & Landmarks |
|---|---|---|
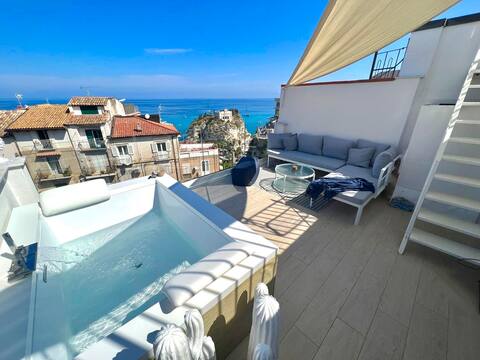
| Old Town Tropea | The historic center with charming streets, stunning views of the Tyrrhenian Sea, and a rich cultural heritage. Ideal for tourists looking to explore local architecture and history. | Tropea Beach, Santa Maria dell'Isola, Piazza Ercole, Cathedral of Tropea, Historical buildings, Restaurants and gelaterias |
| Marina di Tropea | A beautiful coastal area with lovely beaches and waterfront dining. Perfect for families and beach lovers seeking relaxation and sun. | Tropea Marina, Marina di Tropea Beach, water sports activities, restaurants with sea views, seaside promenade |
| Capo Vaticano | Known for its stunning cliffs and crystal-clear waters, it is a popular destination for visitors looking for beautiful landscapes and tranquility. | Capo Vaticano Beach, Baia di Grotticelle, lighthouse, hiking trails, snorkeling and diving spots |
| Pizzo Calabro | A nearby coastal town famous for its Tartufo ice cream and beautiful beaches. Attracts those wanting to explore more of Calabria's coastal charm. | Pizzo Beach, Piazza della Repubblica, Castello Murat, Tartufo di Pizzo, historical sites |
| Vibo Marina | A lively marina with a vibrant atmosphere and access to boat trips and excursions. Appeals to tourists looking for active experiences on the water. | Vibo Marina Port, beach clubs, water activities, fish market, restaurants with fresh seafood |
| Serra San Bruno | An inland town known for its Byzantine heritage and beautiful nature. Ideal for visitors interested in culture and outdoor activities. | Certosa di Serra San Bruno, hiking paths, natural parks, local festivals, historic architecture |
| San Nicola da Crissa | A quaint village offering authentic Calabrian culture and scenic views. Good for tourists seeking a peaceful retreat from busy tourist spots. | local craftsmanship, hiking trails, cultural events, traditional cuisine, scenic landscapes |
| Zungri | Famous for its cave dwellings and stunning views, it attracts adventure-seekers and those interested in rural tourism. | Cave Dwelling, hiking paths, natural scenery, local cuisine, historical sites |
Understanding Airbnb License Requirements & STR Laws in Tropea (2025)
Yes, Tropea, Vibo Valentia, Italy enforces high STR regulations. Obtaining a license and ensuring compliance is almost certainly required according to current 2025 STR laws. Always verify the latest short term rental regulations and Airbnb license requirements directly with local government authorities for Tropea to ensure full compliance before hosting.
(Source: AirROI data, 2025, based on 49% licensed listings)
Top Performing Airbnb Properties in Tropea (2025)
Benchmark your potential! Explore examples of top-performing Airbnb properties in Tropeabased on Trailing Twelve Month (TTM) revenue. Analyze their characteristics, revenue, occupancy rate, and ADR to understand what drives success in this market.

Arcobaleno Tropea"GUEST HOUSE"per 10 persone(+2)
Entire Place • 4 bedrooms
Luxury in the heart of Tropea-Residenza Aqualaguna
Entire Place • 2 bedrooms

Admirari carved into the rock overlooking the sea
Entire Place • 2 bedrooms
Central Exclusive Loft in Tropea
Entire Place • 2 bedrooms

Serenità Tropea Vista Mar
Entire Place • 3 bedrooms
Luna Exclusive Apartment
Entire Place • 2 bedrooms
Note: Performance varies based on location, size, amenities, seasonality, and management quality. Data reflects the past 12 months.
Top Performing Airbnb Hosts in Tropea (2025)
Learn from the best! This table showcases top-performing Airbnb hosts in Tropea based on the number of properties managed and estimated total revenue over the past year. Analyze their scale and performance metrics.
| Host Name | Properties | Grossing Revenue | Stay Reviews | Avg Rating |
|---|---|---|---|---|
| Simone | 14 | $310,218 | 121 | 2.93/5.0 |
| Michelle | 5 | $158,466 | 47 | 4.89/5.0 |
| Michele | 7 | $158,203 | 314 | 4.18/5.0 |
| Salvatore | 9 | $147,034 | 230 | 4.81/5.0 |
| Simona | 5 | $128,672 | 279 | 4.92/5.0 |
| Giuseppe | 4 | $121,513 | 154 | 4.98/5.0 |
| Domenico | 8 | $108,308 | 435 | 4.26/5.0 |
| Luisa | 4 | $102,357 | 177 | 4.88/5.0 |
| Luca | 3 | $98,210 | 22 | 1.64/5.0 |
| Mariateresa | 3 | $88,147 | 93 | 4.77/5.0 |
Analyzing the strategies of top hosts, such as their property selection, pricing, and guest communication, can offer valuable lessons for optimizing your own Airbnb operations in Tropea.
Dive Deeper: Advanced Tropea STR Market Data (2025)
Ready to unlock more insights? AirROI provides access to advanced metrics and comprehensive Airbnb data for Tropea. Explore detailed analytics beyond this report to refine your investment strategy, optimize pricing, and maximize your vacation rental profits.
Explore Advanced MetricsTropea Short-Term Rental Market Composition (2025): Property & Room Types
Room Type Distribution
Property Type Distribution
Market Composition Insights for Tropea
- The Tropea Airbnb market composition is heavily skewed towards Entire Home/Apt listings, which make up 76% of the 404 active rentals. This indicates strong guest preference for privacy and space.
- Looking at the property type distribution in Tropea, Apartment/Condo properties are the most common (63.9%), reflecting the local real estate landscape.
- Houses represent a significant 16.8% portion, catering likely to families or larger groups.
- The presence of 18.6% Hotel/Boutique listings indicates integration with traditional hospitality.
- Smaller segments like others (combined 0.7%) offer potential for unique stay experiences.
Tropea Airbnb Room Capacity Analysis (2025): Bedroom Distribution
Distribution of Listings by Number of Bedrooms
Room Capacity Insights for Tropea
- The dominant room capacity in Tropea is 1 bedroom listings, making up 58.4% of the market. This suggests a strong demand for properties suitable for couples or solo travelers.
- Together, 1 bedroom and 2 bedrooms properties represent 85.9% of the active Airbnb listings in Tropea, indicating a high concentration in these sizes.
- With over half the market (58.4%) consisting of studios or 1-bedroom units, Tropea is particularly well-suited for individuals or couples.
- Listings with 3+ bedrooms (6.7%) represent a smaller niche, potentially indicating an underserved market for larger group accommodations in Tropea.
Tropea Vacation Rental Guest Capacity Trends (2025)
Distribution of Listings by Guest Capacity
Guest Capacity Insights for Tropea
- The most common guest capacity trend in Tropea vacation rentals is listings accommodating 2 guests (32.2%). This suggests the primary traveler segment is likely couples or solo travelers.
- Properties designed for 2 guests and 4 guests dominate the Tropea STR market, accounting for 59.9% of listings.
- On average, properties in Tropea are equipped to host 3.3 guests.
Tropea Airbnb Booking Patterns (2025): Available vs. Booked Days
Available Days Distribution
Booked Days Distribution
Booking Pattern Insights for Tropea
- The most common availability pattern in Tropea falls within the 271-366 days range, representing 56.2% of listings. This suggests many properties have significant open periods on their calendars.
- Approximately 90.6% of listings show high availability (181+ days open annually), indicating potential for increased bookings or specific owner usage patterns.
- For booked days, the 91-180 days range is most frequent in Tropea (34.4%), reflecting common guest stay durations or potential owner blocking patterns.
- A notable 10.9% of properties secure long booking periods (181+ days booked per year), highlighting successful long-term rental strategies or significant owner usage.
Tropea Airbnb Minimum Stay Requirements Analysis
Distribution of Listings by Minimum Night Requirement
1 Night
119 listings
31.8% of total
2 Nights
54 listings
14.4% of total
3 Nights
65 listings
17.4% of total
4-6 Nights
48 listings
12.8% of total
7-29 Nights
70 listings
18.7% of total
30+ Nights
18 listings
4.8% of total
Key Insights
- The most prevalent minimum stay requirement in Tropea is 1 Night, adopted by 31.8% of listings. This highlights the market's preference for shorter, flexible bookings.
Recommendations
- Align with the market by considering a 1 Night minimum stay, as 31.8% of Tropea hosts use this setting.
- Adjust minimum nights based on seasonality – potentially shorter during low season and longer during peak demand periods in Tropea.
Tropea Airbnb Cancellation Policy Trends Analysis (2025)
Super Strict 60 Days
2 listings
0.6% of total
Super Strict 30 Days
12 listings
3.8% of total
Flexible
53 listings
16.7% of total
Moderate
112 listings
35.2% of total
Strict
139 listings
43.7% of total
Cancellation Policy Insights for Tropea
- The prevailing Airbnb cancellation policy trend in Tropea is Strict, used by 43.7% of listings.
- There's a relatively balanced mix between guest-friendly (51.9%) and stricter (43.7%) policies, offering choices for different guest needs.
Recommendations for Hosts
- Consider adopting a Strict policy to align with the 43.7% market standard in Tropea.
- With 43.7% using Strict terms, this is a viable option in Tropea, particularly for high-value properties or during peak demand periods.
- Regularly review your cancellation policy against competitors and market demand shifts in Tropea.
Tropea STR Booking Lead Time Analysis (2025)
Average Booking Lead Time by Month
Booking Lead Time Insights for Tropea
- The overall average booking lead time for vacation rentals in Tropea is 64 days.
- Guests book furthest in advance for stays during June (average 89 days), likely coinciding with peak travel demand or local events.
- The shortest booking windows occur for stays in February (average 40 days), indicating more last-minute travel plans during this time.
- Seasonally, Summer (84 days avg.) sees the longest lead times, while Winter (43 days avg.) has the shortest, reflecting typical travel planning cycles.
Recommendations for Hosts
- Use the overall average lead time (64 days) as a baseline for your pricing and availability strategy in Tropea.
- For June stays, consider implementing length-of-stay discounts or slightly higher rates for bookings made less than 89 days out to capitalize on advance planning.
- Target marketing efforts for the Summer season well in advance (at least 84 days) to capture early planners.
- Monitor your own booking lead times against these Tropea averages to identify opportunities for dynamic pricing adjustments.
Popular & Essential Airbnb Amenities in Tropea (2025)
Amenity Prevalence
Amenity Insights for Tropea
- Popular amenities like TV, Air conditioning, Hot water are common but not universal. Offering these can provide a competitive edge.
- Warning: Wifi is not universally provided but is considered essential globally. Ensure reliable Wifi is offered.
Recommendations for Hosts
- Consider adding popular differentiators like TV or Air conditioning to increase appeal.
- Highlight unique or less common amenities you offer (e.g., hot tub, dedicated workspace, EV charger) in your listing description and photos.
- Regularly check competitor amenities in Tropea to stay competitive.
Tropea Airbnb Guest Demographics & Profile Analysis (2025)
Guest Profile Summary for Tropea
- The typical guest profile for Airbnb in Tropea consists of predominantly international visitors (86%), with top international origins including Canada, typically belonging to the Post-2000s (Gen Z/Alpha) group (50%), primarily speaking English or Italian.
- Domestic travelers account for 14.2% of guests.
- Key international markets include United States (17.5%) and Canada (14.3%).
- Top languages spoken are English (43%) followed by Italian (14.7%).
- A significant demographic segment is the Post-2000s (Gen Z/Alpha) group, representing 50% of guests.
Recommendations for Hosts
- Focus marketing internationally, particularly towards travelers from Canada.
- Tailor amenities and listing descriptions to appeal to the dominant Post-2000s (Gen Z/Alpha) demographic (e.g., highlight fast WiFi, smart home features, local guides).
- Highlight unique local experiences or amenities relevant to the primary guest profile.
- Consider seasonal promotions aligned with peak travel times for key origin markets.
Nearby Short-Term Rental Market Comparison
How does the Tropea Airbnb market stack up against its neighbors? Compare key performance metrics like average monthly revenue, ADR, and occupancy rates in surrounding areas to understand the broader regional STR landscape.
| Market | Active Properties | Monthly Revenue | Daily Rate | Avg. Occupancy |
|---|---|---|---|---|
| Taormina | 973 | $2,450 | $221.38 | 47% |
| Graniti | 20 | $2,135 | $168.67 | 47% |
| Torregrotta | 16 | $2,105 | $267.72 | 36% |
| Viagrande | 34 | $1,921 | $196.41 | 38% |
| Gaggi | 16 | $1,892 | $190.10 | 40% |
| Santa Venerina | 53 | $1,872 | $219.97 | 41% |
| Cefalù | 1,003 | $1,764 | $182.13 | 48% |
| San Marco d'Alunzio | 13 | $1,726 | $174.71 | 38% |
| Tropea | 10 | $1,702 | $157.29 | 49% |
| Caronia | 41 | $1,674 | $178.18 | 44% |