Ricadi Airbnb Market Analysis 2025: Short Term Rental Data & Vacation Rental Statistics in Vibo Valentia, Italy
Is Airbnb profitable in Ricadi in 2025? Explore comprehensive Airbnb analytics for Ricadi, Vibo Valentia, Italy to uncover income potential. This 2025 STR market report for Ricadi, based on AirROI data from April 2024 to March 2025, reveals key trends in the market of 254 active listings.
Whether you're considering an Airbnb investment in Ricadi, optimizing your existing vacation rental, or exploring rental arbitrage opportunities, understanding the Ricadi Airbnb data is crucial. Navigating the high regulation landscape is key to maximizing your short term rental income potential. Let's dive into the specifics.
Key Ricadi Airbnb Performance Metrics Overview
Monthly Airbnb Revenue Variations & Income Potential in Ricadi (2025)
Understanding the monthly revenue variations for Airbnb listings in Ricadi is key to maximizing your short term rental income potential. Seasonality significantly impacts earnings. Our analysis, based on data from the past 12 months, shows that the peak revenue month for STRs in Ricadi is typically August, while February often presents the lowest earnings, highlighting opportunities for strategic pricing adjustments during shoulder and low seasons. Explore the typical Airbnb income in Ricadi across different performance tiers:
- Best-in-class properties (Top 10%) achieve $2,790+ monthly, often utilizing dynamic pricing and superior guest experiences.
- Strong performing properties (Top 25%) earn $1,588 or more, indicating effective management and desirable locations/amenities.
- Typical properties (Median) generate around $866 per month, representing the average market performance.
- Entry-level properties (Bottom 25%) see earnings around $395, often with potential for optimization.
Average Monthly Airbnb Earnings Trend in Ricadi
Ricadi Airbnb Occupancy Rate Trends (2025)
Maximize your bookings by understanding the Ricadi STR occupancy trends. Seasonal demand shifts significantly influence how often properties are booked. Typically, Augustsees the highest demand (peak season occupancy), while February experiences the lowest (low season). Effective strategies, like adjusting minimum stays or offering promotions, can boost occupancy during slower periods. Here's how different property tiers perform in Ricadi:
- Best-in-class properties (Top 10%) achieve 61%+ occupancy, indicating high desirability and potentially optimized availability.
- Strong performing properties (Top 25%) maintain 43% or higher occupancy, suggesting good market fit and guest satisfaction.
- Typical properties (Median) have an occupancy rate around 25%.
- Entry-level properties (Bottom 25%) average 11% occupancy, potentially facing higher vacancy.
Average Monthly Occupancy Rate Trend in Ricadi
Average Daily Rate (ADR) Airbnb Trends in Ricadi (2025)
Effective short term rental pricing strategy in Ricadi involves understanding monthly ADR fluctuations. The Average Daily Rate (ADR) for Airbnb in Ricadi typically peaks in August and dips lowest during April. Leveraging Airbnb dynamic pricing tools or strategies based on this seasonality can significantly boost revenue. Here's a look at the typical nightly rates achieved:
- Best-in-class properties (Top 10%) command rates of $231+ per night, often due to premium features or locations.
- Strong performing properties (Top 25%) achieve nightly rates of $147 or more.
- Typical properties (Median) charge around $100 per night.
- Entry-level properties (Bottom 25%) earn around $72 per night.
Average Daily Rate (ADR) Trend by Month in Ricadi
Get Live Ricadi Market Intelligence 👇

Explore Real-time Analytics
Airbnb Seasonality Analysis & Trends in Ricadi (2025)
Peak Season (August, July, May)
- Revenue averages $2,198 per month
- Occupancy rates average 43.9%
- Daily rates average $150
Shoulder Season
- Revenue averages $1,289 per month
- Occupancy maintains around 28.1%
- Daily rates hold near $140
Low Season (February, March, December)
- Revenue drops to average $546 per month
- Occupancy decreases to average 17.7%
- Daily rates adjust to average $141
Seasonality Insights for Ricadi
- The Airbnb seasonality in Ricadi shows highly seasonal trends requiring careful strategy. While the sections above show seasonal averages, it's also insightful to look at the extremes:
- During the high season, the absolute peak month showcases Ricadi's highest earning potential, with monthly revenues capable of climbing to $2,716, occupancy reaching a high of 52.6%, and ADRs peaking at $161.
- Conversely, the slowest single month of the year, typically falling within the low season, marks the market's lowest point. In this month, revenue might dip to $427, occupancy could drop to 15.9%, and ADRs may adjust down to $134.
- Understanding both the seasonal averages and these monthly peaks and troughs in revenue, occupancy, and ADR is crucial for maximizing your Airbnb profit potential in Ricadi.
Seasonal Strategies for Maximizing Profit
- Peak Season: Maximize revenue through premium pricing and potentially longer minimum stays. Ensure high availability.
- Low Season: Offer competitive pricing, special promotions (e.g., extended stay discounts), and flexible cancellation policies. Target off-season travelers like remote workers or budget-conscious guests.
- Shoulder Seasons: Implement dynamic pricing that balances peak and low rates. Target weekend travelers or specific events. Offer slightly more flexible terms than peak season.
- Regularly analyze your own performance against these Ricadi seasonality benchmarks and adjust your pricing and availability strategy accordingly.
Best Areas for Airbnb Investment in Ricadi (2025)
Exploring the top neighborhoods for short-term rentals in Ricadi? This section highlights key areas, outlining why they are attractive for hosts and guests, along with notable local attractions. Consider these locations based on your target guest profile and investment strategy.
| Neighborhood / Area | Why Host Here? (Target Guests & Appeal) | Key Attractions & Landmarks |
|---|---|---|
| Tropea | Charming coastal town known for its stunning beaches and breathtaking cliffs. Popular with tourists seeking a picturesque Italian getaway with rich history and excellent dining options. | Tropea Beach, Santa Maria dell'Isola Church, Viale Tondo, Tropea's old town, Capo Vaticano, Grotte di Pilato |
| Capo Vaticano | Famous for its crystal-clear waters and stunning coastal views. A prime location for beach lovers and those looking for a relaxing vacation in a serene environment. | Grotticelle Beach, Tropea's Coastline, La Spiaggia di Scalea, Capo Vaticano Lighthouse, Water sports activities, Hiking trails |
| Pizzo Calabro | Known for its picturesque historic center and delicious Tartufo ice cream. Great spot for visitors looking to experience authentic Italian culture and coastal beauty. | Pizzo Beach, Castle of Murat, Piazza della Repubblica, Chiesa di Piedigrotta, Tartufo di Pizzo, Gelato shops |
| Joppolo | A small and quiet town offering beautiful beaches and a tranquil atmosphere. Ideal for families and those looking to escape the crowds. | Joppolo Beach, Capo Cozzo, Hiking in the hills, Local agricultural products, Peaceful nature |
| Falerna | A coastal town with a mix of sandy beaches and historical sites. Attracts tourists looking for a family-friendly environment close to the sea. | Falerna Beach, Chiesa di Santa Maria Assunta, Historical landmarks, Local restaurants, Seaside promenades |
| Nicotera | A quaint town perched on a hill with panoramic views of the sea. Offers a blend of historical sites and beautiful beaches, appealing to history buffs and beachgoers alike. | Nicotera Beach, Castello di Nicotera, Historic churches, Local olive oil shops, Folk festivals |
| San Nicolo | Known for its beautiful surroundings and proximity to nature parks. Great for those who love hiking and exploring outdoor activities. | Nature trails, Local farms, Scenic viewpoints, Biological parks, Community events |
| Vibo Valentia | The capital of the province, known for its rich history and culture. Offers a mix of urban life and attractions, suitable for diverse travelers. | Castello di Vibo Valentia, Piazza del Municipio, Cattedrale di Santa Maria Maggiore, Museo Archeologico, Local shopping areas |
Understanding Airbnb License Requirements & STR Laws in Ricadi (2025)
Yes, Ricadi, Vibo Valentia, Italy enforces high STR regulations. Obtaining a license and ensuring compliance is almost certainly required according to current 2025 STR laws. Always verify the latest short term rental regulations and Airbnb license requirements directly with local government authorities for Ricadi to ensure full compliance before hosting.
(Source: AirROI data, 2025, based on 37% licensed listings)
Top Performing Airbnb Properties in Ricadi (2025)
Benchmark your potential! Explore examples of top-performing Airbnb properties in Ricadibased on Trailing Twelve Month (TTM) revenue. Analyze their characteristics, revenue, occupancy rate, and ADR to understand what drives success in this market.
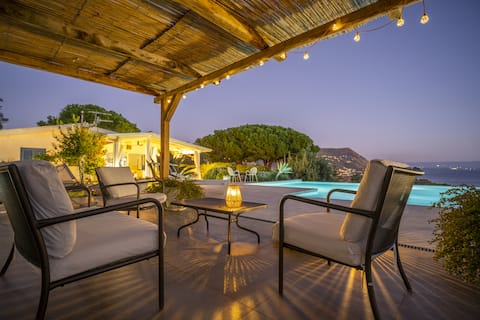
Villa Michaela with infinity pool.
Entire Place • 4 bedrooms
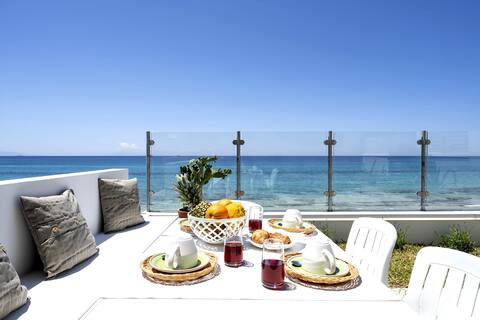
Amazing View Beach Villa
Entire Place • 6 bedrooms

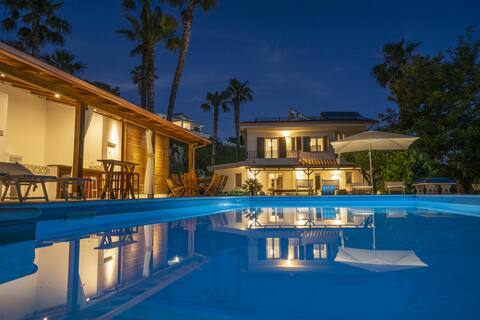
Villa Serenità - Private pool and ocean view
Entire Place • 3 bedrooms
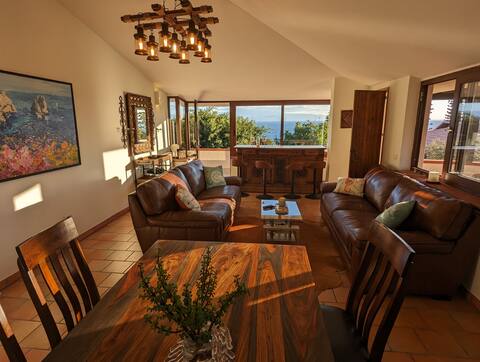
Enotria Villas - Villa Anna
Entire Place • 5 bedrooms
Villa Sirena - Capo Vaticano
Entire Place • 5 bedrooms

Villa Capo Vaticano
Entire Place • 4 bedrooms
Note: Performance varies based on location, size, amenities, seasonality, and management quality. Data reflects the past 12 months.
Top Performing Airbnb Hosts in Ricadi (2025)
Learn from the best! This table showcases top-performing Airbnb hosts in Ricadi based on the number of properties managed and estimated total revenue over the past year. Analyze their scale and performance metrics.
| Host Name | Properties | Grossing Revenue | Stay Reviews | Avg Rating |
|---|---|---|---|---|
| Ville In Calabria | 8 | $307,078 | 70 | 4.24/5.0 |
| Vittoria | 10 | $93,208 | 319 | 4.87/5.0 |
| Marco | 1 | $91,378 | 36 | 4.89/5.0 |
| Francesco | 3 | $66,231 | 185 | 4.99/5.0 |
| Michael | 9 | $58,341 | 108 | 3.58/5.0 |
| Eva | 5 | $49,989 | 15 | 0.98/5.0 |
| Andrea | 6 | $49,598 | 43 | 1.66/5.0 |
| Villa Elena | 3 | $49,377 | 47 | 4.68/5.0 |
| Carmela | 10 | $47,753 | 168 | 4.37/5.0 |
| Host #479548476 | 1 | $44,046 | 1 | 0.00/5.0 |
Analyzing the strategies of top hosts, such as their property selection, pricing, and guest communication, can offer valuable lessons for optimizing your own Airbnb operations in Ricadi.
Dive Deeper: Advanced Ricadi STR Market Data (2025)
Ready to unlock more insights? AirROI provides access to advanced metrics and comprehensive Airbnb data for Ricadi. Explore detailed analytics beyond this report to refine your investment strategy, optimize pricing, and maximize your vacation rental profits.
Explore Advanced MetricsRicadi Short-Term Rental Market Composition (2025): Property & Room Types
Room Type Distribution
Property Type Distribution
Market Composition Insights for Ricadi
- The Ricadi Airbnb market composition is heavily skewed towards Entire Home/Apt listings, which make up 92.1% of the 254 active rentals. This indicates strong guest preference for privacy and space.
- Looking at the property type distribution in Ricadi, Apartment/Condo properties are the most common (51.2%), reflecting the local real estate landscape.
- Houses represent a significant 41.3% portion, catering likely to families or larger groups.
- The presence of 5.9% Hotel/Boutique listings indicates integration with traditional hospitality.
- Smaller segments like others, outdoor/unique (combined 1.6%) offer potential for unique stay experiences.
Ricadi Airbnb Room Capacity Analysis (2025): Bedroom Distribution
Distribution of Listings by Number of Bedrooms
Room Capacity Insights for Ricadi
- The dominant room capacity in Ricadi is 1 bedroom listings, making up 40.9% of the market. This suggests a strong demand for properties suitable for couples or solo travelers.
- Together, 1 bedroom and 2 bedrooms properties represent 81.5% of the active Airbnb listings in Ricadi, indicating a high concentration in these sizes.
Ricadi Vacation Rental Guest Capacity Trends (2025)
Distribution of Listings by Guest Capacity
Guest Capacity Insights for Ricadi
- The most common guest capacity trend in Ricadi vacation rentals is listings accommodating 4 guests (37.8%). This suggests the primary traveler segment is likely small families or groups.
- Properties designed for 4 guests and 2 guests dominate the Ricadi STR market, accounting for 59.5% of listings.
- 20.1% of properties accommodate 6+ guests, serving the market segment for larger families or group travel in Ricadi.
- On average, properties in Ricadi are equipped to host 4.1 guests.
Ricadi Airbnb Booking Patterns (2025): Available vs. Booked Days
Available Days Distribution
Booked Days Distribution
Booking Pattern Insights for Ricadi
- The most common availability pattern in Ricadi falls within the 271-366 days range, representing 78.3% of listings. This suggests many properties have significant open periods on their calendars.
- Approximately 98.0% of listings show high availability (181+ days open annually), indicating potential for increased bookings or specific owner usage patterns.
- For booked days, the 31-90 days range is most frequent in Ricadi (44.9%), reflecting common guest stay durations or potential owner blocking patterns.
- A notable 2.0% of properties secure long booking periods (181+ days booked per year), highlighting successful long-term rental strategies or significant owner usage.
Ricadi Airbnb Minimum Stay Requirements Analysis
Distribution of Listings by Minimum Night Requirement
1 Night
40 listings
17.2% of total
2 Nights
27 listings
11.6% of total
3 Nights
49 listings
21% of total
4-6 Nights
46 listings
19.7% of total
7-29 Nights
57 listings
24.5% of total
30+ Nights
14 listings
6% of total
Key Insights
- The most prevalent minimum stay requirement in Ricadi is 7-29 Nights, adopted by 24.5% of listings. This highlights the market's preference for shorter, flexible bookings.
Recommendations
- Align with the market by considering a 7-29 Nights minimum stay, as 24.5% of Ricadi hosts use this setting.
- If feasible, allowing 1-night stays, especially midweek or during low season, could capture last-minute bookings, as only 17.2% currently do.
- Explore offering discounts for stays of 30+ nights to attract the 6% of the market seeking extended stays.
- Adjust minimum nights based on seasonality – potentially shorter during low season and longer during peak demand periods in Ricadi.
Ricadi Airbnb Cancellation Policy Trends Analysis (2025)
Super Strict 60 Days
10 listings
5.4% of total
Super Strict 30 Days
3 listings
1.6% of total
Flexible
36 listings
19.6% of total
Moderate
58 listings
31.5% of total
Strict
77 listings
41.8% of total
Cancellation Policy Insights for Ricadi
- The prevailing Airbnb cancellation policy trend in Ricadi is Strict, used by 41.8% of listings.
- There's a relatively balanced mix between guest-friendly (51.1%) and stricter (41.8%) policies, offering choices for different guest needs.
Recommendations for Hosts
- Consider adopting a Strict policy to align with the 41.8% market standard in Ricadi.
- With 41.8% using Strict terms, this is a viable option in Ricadi, particularly for high-value properties or during peak demand periods.
- Regularly review your cancellation policy against competitors and market demand shifts in Ricadi.
Ricadi STR Booking Lead Time Analysis (2025)
Average Booking Lead Time by Month
Booking Lead Time Insights for Ricadi
- The overall average booking lead time for vacation rentals in Ricadi is 70 days.
- Guests book furthest in advance for stays during October (average 106 days), likely coinciding with peak travel demand or local events.
- The shortest booking windows occur for stays in December (average 26 days), indicating more last-minute travel plans during this time.
- Seasonally, Fall (96 days avg.) sees the longest lead times, while Winter (48 days avg.) has the shortest, reflecting typical travel planning cycles.
Recommendations for Hosts
- Use the overall average lead time (70 days) as a baseline for your pricing and availability strategy in Ricadi.
- For October stays, consider implementing length-of-stay discounts or slightly higher rates for bookings made less than 106 days out to capitalize on advance planning.
- Target marketing efforts for the Fall season well in advance (at least 96 days) to capture early planners.
- Monitor your own booking lead times against these Ricadi averages to identify opportunities for dynamic pricing adjustments.
Popular & Essential Airbnb Amenities in Ricadi (2025)
Amenity Prevalence
Amenity Insights for Ricadi
- Popular amenities like Free parking on premises, Kitchen, TV are common but not universal. Offering these can provide a competitive edge.
- Warning: Wifi is not universally provided but is considered essential globally. Ensure reliable Wifi is offered.
Recommendations for Hosts
- Consider adding popular differentiators like Free parking on premises or Kitchen to increase appeal.
- Highlight unique or less common amenities you offer (e.g., hot tub, dedicated workspace, EV charger) in your listing description and photos.
- Regularly check competitor amenities in Ricadi to stay competitive.
Ricadi Airbnb Guest Demographics & Profile Analysis (2025)
Guest Profile Summary for Ricadi
- The typical guest profile for Airbnb in Ricadi consists of a mix of domestic (37%) and international guests, with top international origins including Germany, typically belonging to the Post-2000s (Gen Z/Alpha) group (50%), primarily speaking English or Italian.
- Domestic travelers account for 37.4% of guests.
- Key international markets include Italy (37.4%) and Germany (18.7%).
- Top languages spoken are English (36.5%) followed by Italian (22.3%).
- A significant demographic segment is the Post-2000s (Gen Z/Alpha) group, representing 50% of guests.
Recommendations for Hosts
- Focus marketing internationally, particularly towards travelers from Germany.
- Tailor amenities and listing descriptions to appeal to the dominant Post-2000s (Gen Z/Alpha) demographic (e.g., highlight fast WiFi, smart home features, local guides).
- Highlight unique local experiences or amenities relevant to the primary guest profile.
- Consider seasonal promotions aligned with peak travel times for key origin markets.
Nearby Short-Term Rental Market Comparison
How does the Ricadi Airbnb market stack up against its neighbors? Compare key performance metrics like average monthly revenue, ADR, and occupancy rates in surrounding areas to understand the broader regional STR landscape.
| Market | Active Properties | Monthly Revenue | Daily Rate | Avg. Occupancy |
|---|---|---|---|---|
| Taormina | 973 | $2,450 | $221.38 | 47% |
| Graniti | 20 | $2,135 | $168.67 | 47% |
| Torregrotta | 16 | $2,105 | $267.72 | 36% |
| Viagrande | 34 | $1,921 | $196.41 | 38% |
| Gaggi | 16 | $1,892 | $190.10 | 40% |
| Santa Venerina | 53 | $1,872 | $219.97 | 41% |
| Cefalù | 1,003 | $1,764 | $182.13 | 48% |
| San Marco d'Alunzio | 13 | $1,726 | $174.71 | 38% |
| Tropea | 10 | $1,702 | $157.29 | 49% |
| Caronia | 41 | $1,674 | $178.18 | 44% |