Parghelia Airbnb Market Analysis 2025: Short Term Rental Data & Vacation Rental Statistics in Vibo Valentia, Italy
Is Airbnb profitable in Parghelia in 2025? Explore comprehensive Airbnb analytics for Parghelia, Vibo Valentia, Italy to uncover income potential. This 2025 STR market report for Parghelia, based on AirROI data from April 2024 to March 2025, reveals key trends in the niche market of 101 active listings.
Whether you're considering an Airbnb investment in Parghelia, optimizing your existing vacation rental, or exploring rental arbitrage opportunities, understanding the Parghelia Airbnb data is crucial. Navigating the high regulation landscape is key to maximizing your short term rental income potential. Let's dive into the specifics.
Key Parghelia Airbnb Performance Metrics Overview
Monthly Airbnb Revenue Variations & Income Potential in Parghelia (2025)
Understanding the monthly revenue variations for Airbnb listings in Parghelia is key to maximizing your short term rental income potential. Seasonality significantly impacts earnings. Our analysis, based on data from the past 12 months, shows that the peak revenue month for STRs in Parghelia is typically August, while December often presents the lowest earnings, highlighting opportunities for strategic pricing adjustments during shoulder and low seasons. Explore the typical Airbnb income in Parghelia across different performance tiers:
- Best-in-class properties (Top 10%) achieve $2,772+ monthly, often utilizing dynamic pricing and superior guest experiences.
- Strong performing properties (Top 25%) earn $1,417 or more, indicating effective management and desirable locations/amenities.
- Typical properties (Median) generate around $753 per month, representing the average market performance.
- Entry-level properties (Bottom 25%) see earnings around $407, often with potential for optimization.
Average Monthly Airbnb Earnings Trend in Parghelia
Parghelia Airbnb Occupancy Rate Trends (2025)
Maximize your bookings by understanding the Parghelia STR occupancy trends. Seasonal demand shifts significantly influence how often properties are booked. Typically, Augustsees the highest demand (peak season occupancy), while December experiences the lowest (low season). Effective strategies, like adjusting minimum stays or offering promotions, can boost occupancy during slower periods. Here's how different property tiers perform in Parghelia:
- Best-in-class properties (Top 10%) achieve 52%+ occupancy, indicating high desirability and potentially optimized availability.
- Strong performing properties (Top 25%) maintain 39% or higher occupancy, suggesting good market fit and guest satisfaction.
- Typical properties (Median) have an occupancy rate around 22%.
- Entry-level properties (Bottom 25%) average 12% occupancy, potentially facing higher vacancy.
Average Monthly Occupancy Rate Trend in Parghelia
Average Daily Rate (ADR) Airbnb Trends in Parghelia (2025)
Effective short term rental pricing strategy in Parghelia involves understanding monthly ADR fluctuations. The Average Daily Rate (ADR) for Airbnb in Parghelia typically peaks in August and dips lowest during December. Leveraging Airbnb dynamic pricing tools or strategies based on this seasonality can significantly boost revenue. Here's a look at the typical nightly rates achieved:
- Best-in-class properties (Top 10%) command rates of $210+ per night, often due to premium features or locations.
- Strong performing properties (Top 25%) achieve nightly rates of $148 or more.
- Typical properties (Median) charge around $105 per night.
- Entry-level properties (Bottom 25%) earn around $78 per night.
Average Daily Rate (ADR) Trend by Month in Parghelia
Get Live Parghelia Market Intelligence 👇

Explore Real-time Analytics
Airbnb Seasonality Analysis & Trends in Parghelia (2025)
Peak Season (August, July, September)
- Revenue averages $2,135 per month
- Occupancy rates average 45.5%
- Daily rates average $140
Shoulder Season
- Revenue averages $969 per month
- Occupancy maintains around 23.7%
- Daily rates hold near $125
Low Season (February, March, December)
- Revenue drops to average $541 per month
- Occupancy decreases to average 12.7%
- Daily rates adjust to average $123
Seasonality Insights for Parghelia
- The Airbnb seasonality in Parghelia shows highly seasonal trends requiring careful strategy. While the sections above show seasonal averages, it's also insightful to look at the extremes:
- During the high season, the absolute peak month showcases Parghelia's highest earning potential, with monthly revenues capable of climbing to $2,806, occupancy reaching a high of 51.0%, and ADRs peaking at $149.
- Conversely, the slowest single month of the year, typically falling within the low season, marks the market's lowest point. In this month, revenue might dip to $451, occupancy could drop to 9.9%, and ADRs may adjust down to $121.
- Understanding both the seasonal averages and these monthly peaks and troughs in revenue, occupancy, and ADR is crucial for maximizing your Airbnb profit potential in Parghelia.
Seasonal Strategies for Maximizing Profit
- Peak Season: Maximize revenue through premium pricing and potentially longer minimum stays. Ensure high availability.
- Low Season: Offer competitive pricing, special promotions (e.g., extended stay discounts), and flexible cancellation policies. Target off-season travelers like remote workers or budget-conscious guests.
- Shoulder Seasons: Implement dynamic pricing that balances peak and low rates. Target weekend travelers or specific events. Offer slightly more flexible terms than peak season.
- Regularly analyze your own performance against these Parghelia seasonality benchmarks and adjust your pricing and availability strategy accordingly.
Best Areas for Airbnb Investment in Parghelia (2025)
Exploring the top neighborhoods for short-term rentals in Parghelia? This section highlights key areas, outlining why they are attractive for hosts and guests, along with notable local attractions. Consider these locations based on your target guest profile and investment strategy.
| Neighborhood / Area | Why Host Here? (Target Guests & Appeal) | Key Attractions & Landmarks |
|---|---|---|
| Tropea | Charming coastal town known for its stunning beaches, cliffs, and beautiful historic center. Popular among tourists for its picturesque views and vibrant nightlife. | Santa Maria dell'Isola, Tropea Beach, Piazza Ercole, Sanctuary of Santa Maria dell'Isola, Climbing on the Cliffs of Tropea |
| Capo Vaticano | Famous for its breathtaking beach scenery and crystal-clear waters. A great location for beach lovers and those seeking relaxation. | Capo Vaticano Beach, Grotticelle Beach, Tono Beach, Baia di Riaci, Vibo Marina |
| Parghelia | A peaceful seaside town close to Tropea, perfect for those seeking a quieter atmosphere while still being near major attractions. | Parghelia Beach, Spiaggia Michelino, Lido Costa Azzurra, local cafes, quaint restaurants |
| Vibo Valentia | Historical town with rich culture and history, offering a more authentic Italian experience away from the tourist spots. | Castle of Vibo Valentia, Cathedral of Santa Maria Maggiore, Archeological Museum, Piazza San Leoluca, Civita Della Fata |
| Nicolosi | Nestled at the base of Mount Etna, this area is perfect for those interested in hiking and exploring the natural wonders of the region. | Mount Etna, Etna National Park, Casa delle Farfalle, Lago di Nicito, Piano Provenzana |
| Scilla | Beautiful coastal village famous for its stunning beaches and mythological history. A great spot for tourists interested in ancient legends and scenic views. | Scilla Beach, Chianalea di Scilla, Lido Azzurro, Rocca della Virgiliana, Piazza della Repubblica |
| Reggio Calabria | Largest city in Calabria, offering a mix of urban life, beaches, and culture. A central hub for travelers looking to explore the region. | Aspromonte National Park, Bronze Statues of Riace, Museum of Magna Graecia, Reggio Calabria Beach, Viale Aldo Moro |
| San Giorgio Morgeto | A quaint village known for its rural charm and proximity to beautiful natural parks, perfect for a tranquil getaway. | San Giorgio Beach, Cascate del Marmarico, Parco Nazionale dell'Aspromonte, Piazza Garibaldi, Chiesa di San Giorgio |
Understanding Airbnb License Requirements & STR Laws in Parghelia (2025)
Yes, Parghelia, Vibo Valentia, Italy enforces high STR regulations. Obtaining a license and ensuring compliance is almost certainly required according to current 2025 STR laws. Always verify the latest short term rental regulations and Airbnb license requirements directly with local government authorities for Parghelia to ensure full compliance before hosting.
(Source: AirROI data, 2025, based on 32% licensed listings)
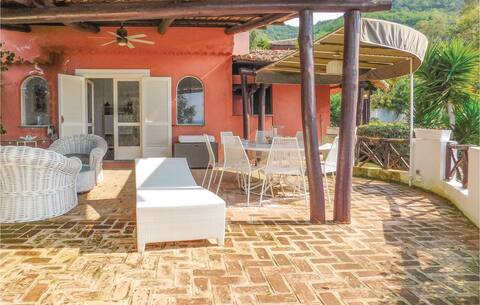
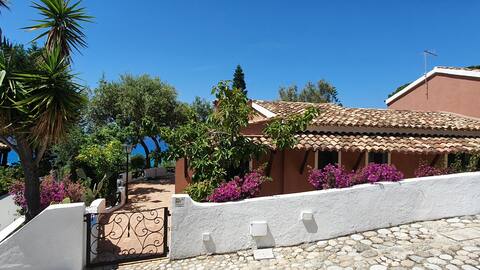
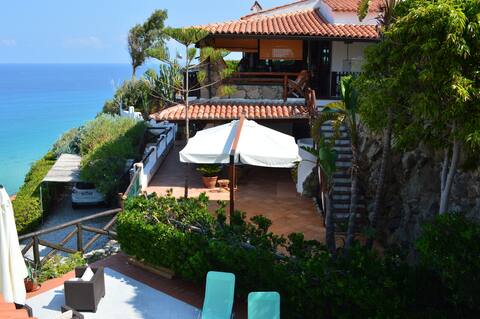
Top Performing Airbnb Properties in Parghelia (2025)
Benchmark your potential! Explore examples of top-performing Airbnb properties in Pargheliabased on Trailing Twelve Month (TTM) revenue. Analyze their characteristics, revenue, occupancy rate, and ADR to understand what drives success in this market.
Il Papavero
Entire Place • 3 bedrooms

Boutique apartment with its own beach, near Tropea
Entire Place • 2 bedrooms
Sea view, private pool and beach : la Dolce Vita!
Entire Place • 3 bedrooms
*Villa Tropea Spiaggia Privata Vista Aeolie*
Entire Place • 3 bedrooms

Terrace Michelino - Parghelia - 1
Entire Place • 2 bedrooms
Turquoise Sea Villa with Amazing Views
Entire Place • 2 bedrooms
Note: Performance varies based on location, size, amenities, seasonality, and management quality. Data reflects the past 12 months.
Top Performing Airbnb Hosts in Parghelia (2025)
Learn from the best! This table showcases top-performing Airbnb hosts in Parghelia based on the number of properties managed and estimated total revenue over the past year. Analyze their scale and performance metrics.
| Host Name | Properties | Grossing Revenue | Stay Reviews | Avg Rating |
|---|---|---|---|---|
| Francesco | 3 | $50,241 | 13 | 3.27/5.0 |
| Host #141531977 | 1 | $38,734 | 0 | 0.00/5.0 |
| Nicole | 1 | $36,517 | 31 | 5.00/5.0 |
| Jean François | 1 | $35,221 | 36 | 4.83/5.0 |
| Stefania | 5 | $34,269 | 108 | 4.54/5.0 |
| Louise | 2 | $32,947 | 19 | 4.84/5.0 |
| Giuseppe | 3 | $29,386 | 13 | 4.53/5.0 |
| Isabella | 3 | $29,269 | 204 | 4.74/5.0 |
| Francesca | 4 | $25,268 | 70 | 3.50/5.0 |
| Lucia | 1 | $22,955 | 4 | 5.00/5.0 |
Analyzing the strategies of top hosts, such as their property selection, pricing, and guest communication, can offer valuable lessons for optimizing your own Airbnb operations in Parghelia.
Dive Deeper: Advanced Parghelia STR Market Data (2025)
Ready to unlock more insights? AirROI provides access to advanced metrics and comprehensive Airbnb data for Parghelia. Explore detailed analytics beyond this report to refine your investment strategy, optimize pricing, and maximize your vacation rental profits.
Explore Advanced MetricsParghelia Short-Term Rental Market Composition (2025): Property & Room Types
Room Type Distribution
Property Type Distribution
Market Composition Insights for Parghelia
- The Parghelia Airbnb market composition is heavily skewed towards Entire Home/Apt listings, which make up 84.2% of the 101 active rentals. This indicates strong guest preference for privacy and space.
- Looking at the property type distribution in Parghelia, Apartment/Condo properties are the most common (46.5%), reflecting the local real estate landscape.
- Houses represent a significant 40.6% portion, catering likely to families or larger groups.
- The presence of 11.9% Hotel/Boutique listings indicates integration with traditional hospitality.
- Smaller segments like outdoor/unique (combined 1.0%) offer potential for unique stay experiences.
Parghelia Airbnb Room Capacity Analysis (2025): Bedroom Distribution
Distribution of Listings by Number of Bedrooms
Room Capacity Insights for Parghelia
- The dominant room capacity in Parghelia is 2 bedrooms listings, making up 39.6% of the market. This suggests a strong demand for properties suitable for couples or solo travelers.
- Together, 2 bedrooms and 1 bedroom properties represent 75.2% of the active Airbnb listings in Parghelia, indicating a high concentration in these sizes.
Parghelia Vacation Rental Guest Capacity Trends (2025)
Distribution of Listings by Guest Capacity
Guest Capacity Insights for Parghelia
- The most common guest capacity trend in Parghelia vacation rentals is listings accommodating 4 guests (28.7%). This suggests the primary traveler segment is likely small families or groups.
- Properties designed for 4 guests and 5 guests dominate the Parghelia STR market, accounting for 48.5% of listings.
- 19.8% of properties accommodate 6+ guests, serving the market segment for larger families or group travel in Parghelia.
- On average, properties in Parghelia are equipped to host 3.9 guests.
Parghelia Airbnb Booking Patterns (2025): Available vs. Booked Days
Available Days Distribution
Booked Days Distribution
Booking Pattern Insights for Parghelia
- The most common availability pattern in Parghelia falls within the 271-366 days range, representing 84.2% of listings. This suggests many properties have significant open periods on their calendars.
- Approximately 99.1% of listings show high availability (181+ days open annually), indicating potential for increased bookings or specific owner usage patterns.
- For booked days, the 1-30 days range is most frequent in Parghelia (41.6%), reflecting common guest stay durations or potential owner blocking patterns.
- A notable 1.0% of properties secure long booking periods (181+ days booked per year), highlighting successful long-term rental strategies or significant owner usage.
Parghelia Airbnb Minimum Stay Requirements Analysis
Distribution of Listings by Minimum Night Requirement
1 Night
15 listings
17.4% of total
2 Nights
5 listings
5.8% of total
3 Nights
20 listings
23.3% of total
4-6 Nights
26 listings
30.2% of total
7-29 Nights
19 listings
22.1% of total
30+ Nights
1 listings
1.2% of total
Key Insights
- The most prevalent minimum stay requirement in Parghelia is 4-6 Nights, adopted by 30.2% of listings. This highlights the market's preference for longer commitments.
- Dedicated monthly rentals (30+ nights) represent a small niche (1.2%), possibly an untapped area for hosts.
Recommendations
- Align with the market by considering a 4-6 Nights minimum stay, as 30.2% of Parghelia hosts use this setting.
- If feasible, allowing 1-night stays, especially midweek or during low season, could capture last-minute bookings, as only 17.4% currently do.
- Adjust minimum nights based on seasonality – potentially shorter during low season and longer during peak demand periods in Parghelia.
Parghelia Airbnb Cancellation Policy Trends Analysis (2025)
Super Strict 60 Days
1 listings
1.3% of total
Super Strict 30 Days
1 listings
1.3% of total
Flexible
13 listings
16.3% of total
Moderate
37 listings
46.3% of total
Strict
28 listings
35% of total
Cancellation Policy Insights for Parghelia
- The prevailing Airbnb cancellation policy trend in Parghelia is Moderate, used by 46.3% of listings.
- There's a relatively balanced mix between guest-friendly (62.6%) and stricter (35.0%) policies, offering choices for different guest needs.
Recommendations for Hosts
- Consider adopting a Moderate policy to align with the 46.3% market standard in Parghelia.
- With 35% using Strict terms, this is a viable option in Parghelia, particularly for high-value properties or during peak demand periods.
- Regularly review your cancellation policy against competitors and market demand shifts in Parghelia.
Parghelia STR Booking Lead Time Analysis (2025)
Average Booking Lead Time by Month
Booking Lead Time Insights for Parghelia
- The overall average booking lead time for vacation rentals in Parghelia is 76 days.
- Guests book furthest in advance for stays during March (average 149 days), likely coinciding with peak travel demand or local events.
- The shortest booking windows occur for stays in December (average 63 days), indicating more last-minute travel plans during this time.
- Seasonally, Spring (96 days avg.) sees the longest lead times, while Winter (73 days avg.) has the shortest, reflecting typical travel planning cycles.
Recommendations for Hosts
- Use the overall average lead time (76 days) as a baseline for your pricing and availability strategy in Parghelia.
- For March stays, consider implementing length-of-stay discounts or slightly higher rates for bookings made less than 149 days out to capitalize on advance planning.
- Target marketing efforts for the Spring season well in advance (at least 96 days) to capture early planners.
- Monitor your own booking lead times against these Parghelia averages to identify opportunities for dynamic pricing adjustments.
Popular & Essential Airbnb Amenities in Parghelia (2025)
Amenity Prevalence
Amenity Insights for Parghelia
- Popular amenities like Kitchen, Hot water, Free parking on premises are common but not universal. Offering these can provide a competitive edge.
- Warning: Wifi is not universally provided but is considered essential globally. Ensure reliable Wifi is offered.
Recommendations for Hosts
- Consider adding popular differentiators like Kitchen or Hot water to increase appeal.
- Highlight unique or less common amenities you offer (e.g., hot tub, dedicated workspace, EV charger) in your listing description and photos.
- Regularly check competitor amenities in Parghelia to stay competitive.
Parghelia Airbnb Guest Demographics & Profile Analysis (2025)
Guest Profile Summary for Parghelia
- The typical guest profile for Airbnb in Parghelia consists of predominantly international visitors (69%), with top international origins including Germany, typically belonging to the Post-2000s (Gen Z/Alpha) group (50%), primarily speaking English or Italian.
- Domestic travelers account for 31.1% of guests.
- Key international markets include Italy (31.1%) and Germany (16.4%).
- Top languages spoken are English (39%) followed by Italian (18%).
- A significant demographic segment is the Post-2000s (Gen Z/Alpha) group, representing 50% of guests.
Recommendations for Hosts
- Focus marketing internationally, particularly towards travelers from Germany.
- Tailor amenities and listing descriptions to appeal to the dominant Post-2000s (Gen Z/Alpha) demographic (e.g., highlight fast WiFi, smart home features, local guides).
- Highlight unique local experiences or amenities relevant to the primary guest profile.
- Consider seasonal promotions aligned with peak travel times for key origin markets.
Nearby Short-Term Rental Market Comparison
How does the Parghelia Airbnb market stack up against its neighbors? Compare key performance metrics like average monthly revenue, ADR, and occupancy rates in surrounding areas to understand the broader regional STR landscape.
| Market | Active Properties | Monthly Revenue | Daily Rate | Avg. Occupancy |
|---|---|---|---|---|
| Taormina | 973 | $2,450 | $221.38 | 47% |
| Graniti | 20 | $2,135 | $168.67 | 47% |
| Torregrotta | 16 | $2,105 | $267.72 | 36% |
| Viagrande | 34 | $1,921 | $196.41 | 38% |
| Gaggi | 16 | $1,892 | $190.10 | 40% |
| Santa Venerina | 53 | $1,872 | $219.97 | 41% |
| Cefalù | 1,003 | $1,764 | $182.13 | 48% |
| San Marco d'Alunzio | 13 | $1,726 | $174.71 | 38% |
| Tropea | 10 | $1,702 | $157.29 | 49% |
| Caronia | 41 | $1,674 | $178.18 | 44% |