Drapia Airbnb Market Analysis 2025: Short Term Rental Data & Vacation Rental Statistics in Vibo Valentia, Italy
Is Airbnb profitable in Drapia in 2025? Explore comprehensive Airbnb analytics for Drapia, Vibo Valentia, Italy to uncover income potential. This 2025 STR market report for Drapia, based on AirROI data from April 2024 to March 2025, reveals key trends in the niche market of 53 active listings.
Whether you're considering an Airbnb investment in Drapia, optimizing your existing vacation rental, or exploring rental arbitrage opportunities, understanding the Drapia Airbnb data is crucial. Navigating the high regulation landscape is key to maximizing your short term rental income potential. Let's dive into the specifics.
Key Drapia Airbnb Performance Metrics Overview
Monthly Airbnb Revenue Variations & Income Potential in Drapia (2025)
Understanding the monthly revenue variations for Airbnb listings in Drapia is key to maximizing your short term rental income potential. Seasonality significantly impacts earnings. Our analysis, based on data from the past 12 months, shows that the peak revenue month for STRs in Drapia is typically August, while April often presents the lowest earnings, highlighting opportunities for strategic pricing adjustments during shoulder and low seasons. Explore the typical Airbnb income in Drapia across different performance tiers:
- Best-in-class properties (Top 10%) achieve $2,533+ monthly, often utilizing dynamic pricing and superior guest experiences.
- Strong performing properties (Top 25%) earn $1,665 or more, indicating effective management and desirable locations/amenities.
- Typical properties (Median) generate around $800 per month, representing the average market performance.
- Entry-level properties (Bottom 25%) see earnings around $390, often with potential for optimization.
Average Monthly Airbnb Earnings Trend in Drapia
Drapia Airbnb Occupancy Rate Trends (2025)
Maximize your bookings by understanding the Drapia STR occupancy trends. Seasonal demand shifts significantly influence how often properties are booked. Typically, Augustsees the highest demand (peak season occupancy), while January experiences the lowest (low season). Effective strategies, like adjusting minimum stays or offering promotions, can boost occupancy during slower periods. Here's how different property tiers perform in Drapia:
- Best-in-class properties (Top 10%) achieve 62%+ occupancy, indicating high desirability and potentially optimized availability.
- Strong performing properties (Top 25%) maintain 51% or higher occupancy, suggesting good market fit and guest satisfaction.
- Typical properties (Median) have an occupancy rate around 28%.
- Entry-level properties (Bottom 25%) average 16% occupancy, potentially facing higher vacancy.
Average Monthly Occupancy Rate Trend in Drapia
Average Daily Rate (ADR) Airbnb Trends in Drapia (2025)
Effective short term rental pricing strategy in Drapia involves understanding monthly ADR fluctuations. The Average Daily Rate (ADR) for Airbnb in Drapia typically peaks in August and dips lowest during March. Leveraging Airbnb dynamic pricing tools or strategies based on this seasonality can significantly boost revenue. Here's a look at the typical nightly rates achieved:
- Best-in-class properties (Top 10%) command rates of $150+ per night, often due to premium features or locations.
- Strong performing properties (Top 25%) achieve nightly rates of $111 or more.
- Typical properties (Median) charge around $88 per night.
- Entry-level properties (Bottom 25%) earn around $62 per night.
Average Daily Rate (ADR) Trend by Month in Drapia
Get Live Drapia Market Intelligence 👇

Explore Real-time Analytics
Airbnb Seasonality Analysis & Trends in Drapia (2025)
Peak Season (August, July, September)
- Revenue averages $1,870 per month
- Occupancy rates average 50.7%
- Daily rates average $125
Shoulder Season
- Revenue averages $1,009 per month
- Occupancy maintains around 29.8%
- Daily rates hold near $110
Low Season (January, April, December)
- Revenue drops to average $670 per month
- Occupancy decreases to average 21.2%
- Daily rates adjust to average $107
Seasonality Insights for Drapia
- The Airbnb seasonality in Drapia shows highly seasonal trends requiring careful strategy. While the sections above show seasonal averages, it's also insightful to look at the extremes:
- During the high season, the absolute peak month showcases Drapia's highest earning potential, with monthly revenues capable of climbing to $2,176, occupancy reaching a high of 54.1%, and ADRs peaking at $132.
- Conversely, the slowest single month of the year, typically falling within the low season, marks the market's lowest point. In this month, revenue might dip to $493, occupancy could drop to 13.8%, and ADRs may adjust down to $101.
- Understanding both the seasonal averages and these monthly peaks and troughs in revenue, occupancy, and ADR is crucial for maximizing your Airbnb profit potential in Drapia.
Seasonal Strategies for Maximizing Profit
- Peak Season: Maximize revenue through premium pricing and potentially longer minimum stays. Ensure high availability.
- Low Season: Offer competitive pricing, special promotions (e.g., extended stay discounts), and flexible cancellation policies. Target off-season travelers like remote workers or budget-conscious guests.
- Shoulder Seasons: Implement dynamic pricing that balances peak and low rates. Target weekend travelers or specific events. Offer slightly more flexible terms than peak season.
- Regularly analyze your own performance against these Drapia seasonality benchmarks and adjust your pricing and availability strategy accordingly.
Best Areas for Airbnb Investment in Drapia (2025)
Exploring the top neighborhoods for short-term rentals in Drapia? This section highlights key areas, outlining why they are attractive for hosts and guests, along with notable local attractions. Consider these locations based on your target guest profile and investment strategy.
| Neighborhood / Area | Why Host Here? (Target Guests & Appeal) | Key Attractions & Landmarks |
|---|---|---|
| Drapia Town Center | Charming small town atmosphere with close proximity to stunning beaches and local Italian culture. Ideal for guests looking for a peaceful retreat and authentic experiences. | Santa Maria di Ricadi Beach, Torre Marrana, groves of olive trees, local trattorie offers authentic Italian cuisine |
| Capo Vaticano | One of the most beautiful coastal areas in Italy, famous for its rugged cliffs and crystal-clear waters. A favorite spot for beach lovers and nature enthusiasts. | Beaches of Capo Vaticano, Costa degli Dei, viewpoints overlooking the sea, hiking trails, snorkeling spots |
| Ricadi | A nearby town known for its scenic views and beautiful beaches. Attracts tourists looking for relaxation and family-friendly activities. | Riaci Beach, Baia di Riaci, local markets, culinary experiences with local products, Cappella di Santa Maria |
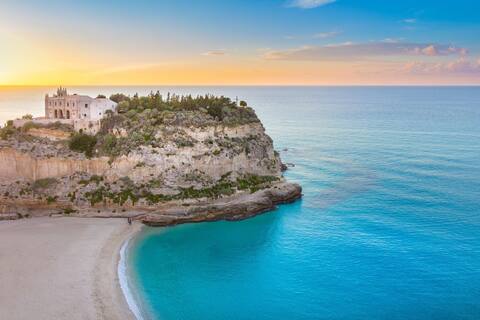
| Tropea | A picturesque town just a short drive from Drapia, known for its dramatic cliffs and stunning views of the Tyrrhenian Sea. Popular for its historical sites and vibrant nightlife. | Tropea Beach, Chiesa di Santa Maria dell'Isola, historic center of Tropea, local shops and cafes, nightlife along the beach |
| Pizzo Calabro | Famous for its Tartufo ice cream and beautiful seaside promenade, Pizzo is a charming town with historical significance and delicious cuisine. | Castello Murat, Pizzo's historic center, beaches, Tartufo gelato shops, seafood restaurants |
| Scilla | A coastal town that combines history, stunning beaches, and legends of the sea. Scilla is great for those who want a romantic getaway by the sea. | Scilla Marina, Chianalea district, Castello Ruffo, beachside restaurants, local folklore and legends |
| Brattirò | A quaint village offering a tranquil stay with access to local hiking trails and views of the surrounding landscapes. Ideal for nature lovers and peace seekers. | hiking in the hills, local artisan shops, panoramic views, traditional Calabrian festivals, agricultural experiences |
| Nicotera | A less crowded historical town with a beautiful beach and rich history. It appeals to visitors looking for a more authentic experience away from tourist hotspots. | Nicotera Beach, Castello di Nicotera, old town with medieval architecture, vineyards and wine tasting, local festivals |
Understanding Airbnb License Requirements & STR Laws in Drapia (2025)
Yes, Drapia, Vibo Valentia, Italy enforces high STR regulations. Obtaining a license and ensuring compliance is almost certainly required according to current 2025 STR laws. Always verify the latest short term rental regulations and Airbnb license requirements directly with local government authorities for Drapia to ensure full compliance before hosting.
(Source: AirROI data, 2025, based on 43% licensed listings)
Top Performing Airbnb Properties in Drapia (2025)
Benchmark your potential! Explore examples of top-performing Airbnb properties in Drapiabased on Trailing Twelve Month (TTM) revenue. Analyze their characteristics, revenue, occupancy rate, and ADR to understand what drives success in this market.

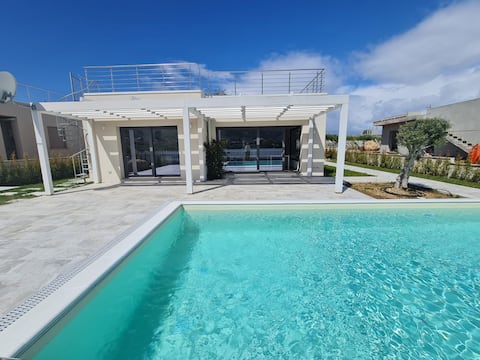
3 Bed 2 Bath Exclusive Villa with Pool Tropea
Entire Place • 3 bedrooms
3 Bed Villa @Portobello Tropea Villa 9
Entire Place • 3 bedrooms
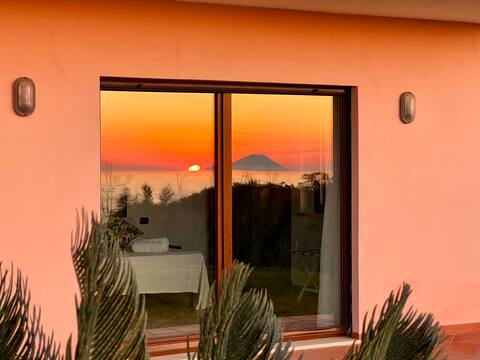
Green apartment with sea view of Tropea
Entire Place • 1 bedroom
Tropea from above
Entire Place • 3 bedrooms

Villetta di campagna
Entire Place • 1 bedroom

Pool,View,Garden,4km from Tropea
Entire Place • 1 bedroom
Note: Performance varies based on location, size, amenities, seasonality, and management quality. Data reflects the past 12 months.
Top Performing Airbnb Hosts in Drapia (2025)
Learn from the best! This table showcases top-performing Airbnb hosts in Drapia based on the number of properties managed and estimated total revenue over the past year. Analyze their scale and performance metrics.
| Host Name | Properties | Grossing Revenue | Stay Reviews | Avg Rating |
|---|---|---|---|---|
| Emma | 2 | $65,045 | 5 | 2.50/5.0 |
| Marcello | 4 | $39,928 | 205 | 4.82/5.0 |
| Simone | 2 | $25,277 | 79 | 4.89/5.0 |
| Anna | 2 | $24,993 | 22 | 5.00/5.0 |
| Carlo | 3 | $24,858 | 128 | 4.82/5.0 |
| Host #1135618 | 1 | $18,172 | 2 | 0.00/5.0 |
| Bruno | 2 | $15,665 | 23 | 4.96/5.0 |
| Marilena | 2 | $11,523 | 10 | 2.40/5.0 |
| Casa Limone Tropea | 1 | $9,702 | 5 | 5.00/5.0 |
| Antonio | 2 | $9,164 | 12 | 4.88/5.0 |
Analyzing the strategies of top hosts, such as their property selection, pricing, and guest communication, can offer valuable lessons for optimizing your own Airbnb operations in Drapia.
Dive Deeper: Advanced Drapia STR Market Data (2025)
Ready to unlock more insights? AirROI provides access to advanced metrics and comprehensive Airbnb data for Drapia. Explore detailed analytics beyond this report to refine your investment strategy, optimize pricing, and maximize your vacation rental profits.
Explore Advanced MetricsDrapia Short-Term Rental Market Composition (2025): Property & Room Types
Room Type Distribution
Property Type Distribution
Market Composition Insights for Drapia
- The Drapia Airbnb market composition is heavily skewed towards Entire Home/Apt listings, which make up 83% of the 53 active rentals. This indicates strong guest preference for privacy and space.
- Looking at the property type distribution in Drapia, Apartment/Condo properties are the most common (47.2%), reflecting the local real estate landscape.
- Houses represent a significant 43.4% portion, catering likely to families or larger groups.
- The presence of 7.5% Hotel/Boutique listings indicates integration with traditional hospitality.
- Smaller segments like outdoor/unique (combined 1.9%) offer potential for unique stay experiences.
Drapia Airbnb Room Capacity Analysis (2025): Bedroom Distribution
Distribution of Listings by Number of Bedrooms
Room Capacity Insights for Drapia
- The dominant room capacity in Drapia is 1 bedroom listings, making up 43.4% of the market. This suggests a strong demand for properties suitable for couples or solo travelers.
- Together, 1 bedroom and 2 bedrooms properties represent 75.5% of the active Airbnb listings in Drapia, indicating a high concentration in these sizes.
Drapia Vacation Rental Guest Capacity Trends (2025)
Distribution of Listings by Guest Capacity
Guest Capacity Insights for Drapia
- The most common guest capacity trend in Drapia vacation rentals is listings accommodating 4 guests (28.3%). This suggests the primary traveler segment is likely small families or groups.
- Properties designed for 4 guests and 2 guests dominate the Drapia STR market, accounting for 52.8% of listings.
- 15.1% of properties accommodate 6+ guests, serving the market segment for larger families or group travel in Drapia.
- On average, properties in Drapia are equipped to host 3.5 guests.
Drapia Airbnb Booking Patterns (2025): Available vs. Booked Days
Available Days Distribution
Booked Days Distribution
Booking Pattern Insights for Drapia
- The most common availability pattern in Drapia falls within the 271-366 days range, representing 83% of listings. This suggests many properties have significant open periods on their calendars.
- Approximately 98.1% of listings show high availability (181+ days open annually), indicating potential for increased bookings or specific owner usage patterns.
- For booked days, the 31-90 days range is most frequent in Drapia (52.8%), reflecting common guest stay durations or potential owner blocking patterns.
- A notable 1.9% of properties secure long booking periods (181+ days booked per year), highlighting successful long-term rental strategies or significant owner usage.
Drapia Airbnb Minimum Stay Requirements Analysis
Distribution of Listings by Minimum Night Requirement
1 Night
11 listings
21.6% of total
2 Nights
7 listings
13.7% of total
3 Nights
7 listings
13.7% of total
4-6 Nights
10 listings
19.6% of total
7-29 Nights
15 listings
29.4% of total
30+ Nights
1 listings
2% of total
Key Insights
- The most prevalent minimum stay requirement in Drapia is 7-29 Nights, adopted by 29.4% of listings. This highlights the market's preference for shorter, flexible bookings.
- Dedicated monthly rentals (30+ nights) represent a small niche (2%), possibly an untapped area for hosts.
Recommendations
- Align with the market by considering a 7-29 Nights minimum stay, as 29.4% of Drapia hosts use this setting.
- If feasible, allowing 1-night stays, especially midweek or during low season, could capture last-minute bookings, as only 21.6% currently do.
- Adjust minimum nights based on seasonality – potentially shorter during low season and longer during peak demand periods in Drapia.
Drapia Airbnb Cancellation Policy Trends Analysis (2025)
Super Strict 30 Days
2 listings
4.8% of total
Flexible
19 listings
45.2% of total
Moderate
12 listings
28.6% of total
Strict
9 listings
21.4% of total
Cancellation Policy Insights for Drapia
- The prevailing Airbnb cancellation policy trend in Drapia is Flexible, used by 45.2% of listings.
- The market strongly favors guest-friendly terms, with 73.8% of listings offering Flexible or Moderate policies. This suggests guests in Drapia may expect booking flexibility.
Recommendations for Hosts
- Consider adopting a Flexible policy to align with the 45.2% market standard in Drapia.
- Regularly review your cancellation policy against competitors and market demand shifts in Drapia.
Drapia STR Booking Lead Time Analysis (2025)
Average Booking Lead Time by Month
Booking Lead Time Insights for Drapia
- The overall average booking lead time for vacation rentals in Drapia is 66 days.
- Guests book furthest in advance for stays during June (average 105 days), likely coinciding with peak travel demand or local events.
- The shortest booking windows occur for stays in January (average 5 days), indicating more last-minute travel plans during this time.
- Seasonally, Summer (85 days avg.) sees the longest lead times, while Winter (49 days avg.) has the shortest, reflecting typical travel planning cycles.
Recommendations for Hosts
- Use the overall average lead time (66 days) as a baseline for your pricing and availability strategy in Drapia.
- For June stays, consider implementing length-of-stay discounts or slightly higher rates for bookings made less than 105 days out to capitalize on advance planning.
- During January, focus on last-minute booking availability and promotions, as guests book with very short notice (5 days avg.).
- Target marketing efforts for the Summer season well in advance (at least 85 days) to capture early planners.
- Monitor your own booking lead times against these Drapia averages to identify opportunities for dynamic pricing adjustments.
Popular & Essential Airbnb Amenities in Drapia (2025)
Amenity Prevalence
Amenity Insights for Drapia
- Popular amenities like Kitchen, Free parking on premises, Essentials are common but not universal. Offering these can provide a competitive edge.
- Warning: Wifi is not universally provided but is considered essential globally. Ensure reliable Wifi is offered.
Recommendations for Hosts
- Consider adding popular differentiators like Kitchen or Free parking on premises to increase appeal.
- Highlight unique or less common amenities you offer (e.g., hot tub, dedicated workspace, EV charger) in your listing description and photos.
- Regularly check competitor amenities in Drapia to stay competitive.
Drapia Airbnb Guest Demographics & Profile Analysis (2025)
Guest Profile Summary for Drapia
- The typical guest profile for Airbnb in Drapia consists of a mix of domestic (42%) and international guests, with top international origins including Germany, typically belonging to the Post-2000s (Gen Z/Alpha) group (50%), primarily speaking English or Italian.
- Domestic travelers account for 41.8% of guests.
- Key international markets include Italy (41.8%) and Germany (17.6%).
- Top languages spoken are English (34.3%) followed by Italian (21.6%).
- A significant demographic segment is the Post-2000s (Gen Z/Alpha) group, representing 50% of guests.
Recommendations for Hosts
- Balance marketing efforts between domestic and international channels based on the guest mix.
- Tailor amenities and listing descriptions to appeal to the dominant Post-2000s (Gen Z/Alpha) demographic (e.g., highlight fast WiFi, smart home features, local guides).
- Highlight unique local experiences or amenities relevant to the primary guest profile.
- Consider seasonal promotions aligned with peak travel times for key origin markets.
Nearby Short-Term Rental Market Comparison
How does the Drapia Airbnb market stack up against its neighbors? Compare key performance metrics like average monthly revenue, ADR, and occupancy rates in surrounding areas to understand the broader regional STR landscape.
| Market | Active Properties | Monthly Revenue | Daily Rate | Avg. Occupancy |
|---|---|---|---|---|
| Taormina | 973 | $2,450 | $221.38 | 47% |
| Graniti | 20 | $2,135 | $168.67 | 47% |
| Torregrotta | 16 | $2,105 | $267.72 | 36% |
| Viagrande | 34 | $1,921 | $196.41 | 38% |
| Gaggi | 16 | $1,892 | $190.10 | 40% |
| Santa Venerina | 53 | $1,872 | $219.97 | 41% |
| Cefalù | 1,003 | $1,764 | $182.13 | 48% |
| San Marco d'Alunzio | 13 | $1,726 | $174.71 | 38% |
| Tropea | 10 | $1,702 | $157.29 | 49% |
| Caronia | 41 | $1,674 | $178.18 | 44% |