Villafranca di Verona Airbnb Market Analysis 2025: Short Term Rental Data & Vacation Rental Statistics in Veneto, Italy
Is Airbnb profitable in Villafranca di Verona in 2025? Explore comprehensive Airbnb analytics for Villafranca di Verona, Veneto, Italy to uncover income potential. This 2025 STR market report for Villafranca di Verona, based on AirROI data from April 2024 to March 2025, reveals key trends in the niche market of 27 active listings.
Whether you're considering an Airbnb investment in Villafranca di Verona, optimizing your existing vacation rental, or exploring rental arbitrage opportunities, understanding the Villafranca di Verona Airbnb data is crucial. Navigating the high regulation landscape is key to maximizing your short term rental income potential. Let's dive into the specifics.
Key Villafranca di Verona Airbnb Performance Metrics Overview
Monthly Airbnb Revenue Variations & Income Potential in Villafranca di Verona (2025)
Understanding the monthly revenue variations for Airbnb listings in Villafranca di Verona is key to maximizing your short term rental income potential. Seasonality significantly impacts earnings. Our analysis, based on data from the past 12 months, shows that the peak revenue month for STRs in Villafranca di Verona is typically May, while January often presents the lowest earnings, highlighting opportunities for strategic pricing adjustments during shoulder and low seasons. Explore the typical Airbnb income in Villafranca di Verona across different performance tiers:
- Best-in-class properties (Top 10%) achieve $2,089+ monthly, often utilizing dynamic pricing and superior guest experiences.
- Strong performing properties (Top 25%) earn $1,548 or more, indicating effective management and desirable locations/amenities.
- Typical properties (Median) generate around $790 per month, representing the average market performance.
- Entry-level properties (Bottom 25%) see earnings around $412, often with potential for optimization.
Average Monthly Airbnb Earnings Trend in Villafranca di Verona
Villafranca di Verona Airbnb Occupancy Rate Trends (2025)
Maximize your bookings by understanding the Villafranca di Verona STR occupancy trends. Seasonal demand shifts significantly influence how often properties are booked. Typically, Augustsees the highest demand (peak season occupancy), while January experiences the lowest (low season). Effective strategies, like adjusting minimum stays or offering promotions, can boost occupancy during slower periods. Here's how different property tiers perform in Villafranca di Verona:
- Best-in-class properties (Top 10%) achieve 57%+ occupancy, indicating high desirability and potentially optimized availability.
- Strong performing properties (Top 25%) maintain 43% or higher occupancy, suggesting good market fit and guest satisfaction.
- Typical properties (Median) have an occupancy rate around 24%.
- Entry-level properties (Bottom 25%) average 14% occupancy, potentially facing higher vacancy.
Average Monthly Occupancy Rate Trend in Villafranca di Verona
Average Daily Rate (ADR) Airbnb Trends in Villafranca di Verona (2025)
Effective short term rental pricing strategy in Villafranca di Verona involves understanding monthly ADR fluctuations. The Average Daily Rate (ADR) for Airbnb in Villafranca di Verona typically peaks in August and dips lowest during March. Leveraging Airbnb dynamic pricing tools or strategies based on this seasonality can significantly boost revenue. Here's a look at the typical nightly rates achieved:
- Best-in-class properties (Top 10%) command rates of $134+ per night, often due to premium features or locations.
- Strong performing properties (Top 25%) achieve nightly rates of $107 or more.
- Typical properties (Median) charge around $92 per night.
- Entry-level properties (Bottom 25%) earn around $73 per night.
Average Daily Rate (ADR) Trend by Month in Villafranca di Verona
Get Live Villafranca di Verona Market Intelligence 👇

Explore Real-time Analytics
Airbnb Seasonality Analysis & Trends in Villafranca di Verona (2025)
Peak Season (May, June, July)
- Revenue averages $2,248 per month
- Occupancy rates average 38.4%
- Daily rates average $109
Shoulder Season
- Revenue averages $980 per month
- Occupancy maintains around 31.7%
- Daily rates hold near $109
Low Season (January, February, December)
- Revenue drops to average $512 per month
- Occupancy decreases to average 16.4%
- Daily rates adjust to average $109
Seasonality Insights for Villafranca di Verona
- The Airbnb seasonality in Villafranca di Verona shows highly seasonal trends requiring careful strategy. While the sections above show seasonal averages, it's also insightful to look at the extremes:
- During the high season, the absolute peak month showcases Villafranca di Verona's highest earning potential, with monthly revenues capable of climbing to $2,727, occupancy reaching a high of 52.1%, and ADRs peaking at $123.
- Conversely, the slowest single month of the year, typically falling within the low season, marks the market's lowest point. In this month, revenue might dip to $495, occupancy could drop to 14.7%, and ADRs may adjust down to $102.
- Understanding both the seasonal averages and these monthly peaks and troughs in revenue, occupancy, and ADR is crucial for maximizing your Airbnb profit potential in Villafranca di Verona.
Seasonal Strategies for Maximizing Profit
- Peak Season: Maximize revenue through premium pricing and potentially longer minimum stays. Ensure high availability.
- Low Season: Offer competitive pricing, special promotions (e.g., extended stay discounts), and flexible cancellation policies. Target off-season travelers like remote workers or budget-conscious guests.
- Shoulder Seasons: Implement dynamic pricing that balances peak and low rates. Target weekend travelers or specific events. Offer slightly more flexible terms than peak season.
- Regularly analyze your own performance against these Villafranca di Verona seasonality benchmarks and adjust your pricing and availability strategy accordingly.
Best Areas for Airbnb Investment in Villafranca di Verona (2025)
Exploring the top neighborhoods for short-term rentals in Villafranca di Verona? This section highlights key areas, outlining why they are attractive for hosts and guests, along with notable local attractions. Consider these locations based on your target guest profile and investment strategy.
| Neighborhood / Area | Why Host Here? (Target Guests & Appeal) | Key Attractions & Landmarks |
|---|---|---|
| Centro Storico | The historical center of Villafranca di Verona is charming and picturesque, attracting tourists interested in history and culture. It's home to various shops, restaurants, and beautiful architecture. | Castello Scaligero, Palazzo Communale, Piazza Vittorio Emanuele II, Chiesa di San Rocco, Museo Civico, Teatro Carabinieri |
| Villafranca Airport Area | Adjacent to the Verona Villafranca Airport, this area is convenient for travelers looking for short-term stays near the airport, making it highly attractive for business and leisure travelers. | Verona Villafranca Airport, Airport restaurants, Aeroporto di Villafranca di Verona |
| Parco Olivi | A scenic area with beautiful parks and outdoor spaces, ideal for families and tourists looking to relax in nature while enjoying local greenery and walking trails. | Parco Olivi, Piazzale della Vittoria, Pista Ciclabile del Mincio |
| Sant'Anna | A quiet residential neighborhood that offers a more authentic Italian living experience. Suitable for longer stays and families seeking a peaceful environment close to amenities. | Local markets, Neighborhood parks, Friendly cafes |
| Valgatara | A small village known for its picturesque landscapes and proximity to wine regions, attracting those interested in wine tourism and rural escapes. | Wine tasting tours, Vineyards, Countryside walks |
| Roncà | A charming rural area perfect for those looking for tranquility and a taste of rural Italian life. Popular for nature lovers and those seeking outdoor activities. | Walking and hiking routes, Nature parks, Agritourism experiences |
| Local Vineyards | Villafranca is close to many acclaimed vineyards, making it an attractive spot for wine enthusiasts who wish to explore the local wine culture and participate in tastings. | Local wineries, Wine tours, Wine festivals |
| Cultural Events Area | Hosting various local cultural events and festivals throughout the year, drawing visitors who want to experience Villafranca's rich traditions firsthand. | Local festivals, Art exhibitions, Traditional markets |
Understanding Airbnb License Requirements & STR Laws in Villafranca di Verona (2025)
Yes, Villafranca di Verona, Veneto, Italy enforces high STR regulations. Obtaining a license and ensuring compliance is almost certainly required according to current 2025 STR laws. Always verify the latest short term rental regulations and Airbnb license requirements directly with local government authorities for Villafranca di Verona to ensure full compliance before hosting.
(Source: AirROI data, 2025, based on 59% licensed listings)
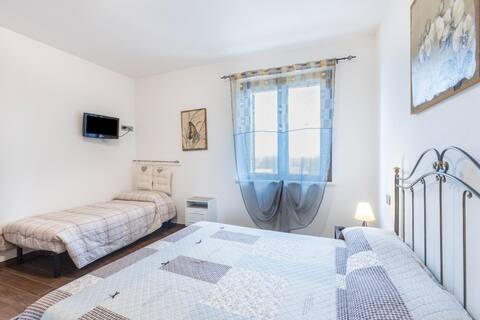
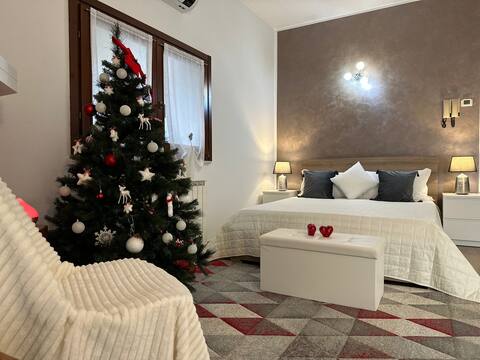
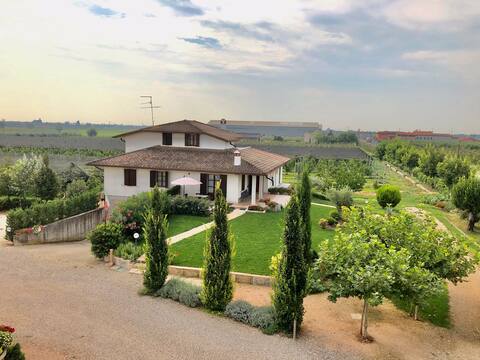
Top Performing Airbnb Properties in Villafranca di Verona (2025)
Benchmark your potential! Explore examples of top-performing Airbnb properties in Villafranca di Veronabased on Trailing Twelve Month (TTM) revenue. Analyze their characteristics, revenue, occupancy rate, and ADR to understand what drives success in this market.
La Siesta
Entire Place • 3 bedrooms
La Taverna dei Tre Micetti
Entire Place • 1 bedroom

Apartment in the courtyard
Entire Place • 2 bedrooms
Villa Apartment
Entire Place • 2 bedrooms
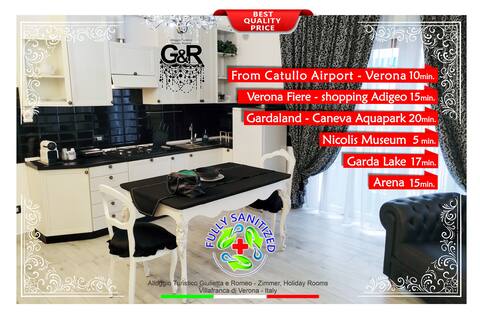
Apartment ROMEO ♥ c. historic Villafranca Verona
Entire Place • 1 bedroom

Appartamento familiare
Entire Place • 3 bedrooms
Note: Performance varies based on location, size, amenities, seasonality, and management quality. Data reflects the past 12 months.
Top Performing Airbnb Hosts in Villafranca di Verona (2025)
Learn from the best! This table showcases top-performing Airbnb hosts in Villafranca di Verona based on the number of properties managed and estimated total revenue over the past year. Analyze their scale and performance metrics.
| Host Name | Properties | Grossing Revenue | Stay Reviews | Avg Rating |
|---|---|---|---|---|
| Holidu | 1 | $45,110 | 6 | 4.50/5.0 |
| Renzo | 2 | $24,147 | 114 | 4.98/5.0 |
| Mariana | 1 | $21,154 | 25 | 4.88/5.0 |
| Elisa | 1 | $17,596 | 33 | 5.00/5.0 |
| Francesco | 1 | $17,087 | 146 | 4.83/5.0 |
| Nadia | 2 | $15,165 | 51 | 4.86/5.0 |
| Graziano | 2 | $14,428 | 107 | 4.88/5.0 |
| Host #580564363 | 1 | $11,753 | 2 | 0.00/5.0 |
| Host #161611247 | 1 | $11,297 | 2 | 0.00/5.0 |
| Natalina | 1 | $10,509 | 38 | 4.66/5.0 |
Analyzing the strategies of top hosts, such as their property selection, pricing, and guest communication, can offer valuable lessons for optimizing your own Airbnb operations in Villafranca di Verona.
Dive Deeper: Advanced Villafranca di Verona STR Market Data (2025)
Ready to unlock more insights? AirROI provides access to advanced metrics and comprehensive Airbnb data for Villafranca di Verona. Explore detailed analytics beyond this report to refine your investment strategy, optimize pricing, and maximize your vacation rental profits.
Explore Advanced MetricsVillafranca di Verona Short-Term Rental Market Composition (2025): Property & Room Types
Room Type Distribution
Property Type Distribution
Market Composition Insights for Villafranca di Verona
- The Villafranca di Verona Airbnb market composition is heavily skewed towards Entire Home/Apt listings, which make up 74.1% of the 27 active rentals. This indicates strong guest preference for privacy and space.
- Looking at the property type distribution in Villafranca di Verona, Apartment/Condo properties are the most common (77.8%), reflecting the local real estate landscape.
- The presence of 14.8% Hotel/Boutique listings indicates integration with traditional hospitality.
Villafranca di Verona Airbnb Room Capacity Analysis (2025): Bedroom Distribution
Distribution of Listings by Number of Bedrooms
Room Capacity Insights for Villafranca di Verona
- The dominant room capacity in Villafranca di Verona is 1 bedroom listings, making up 63% of the market. This suggests a strong demand for properties suitable for couples or solo travelers.
- Together, 1 bedroom and 2 bedrooms properties represent 81.5% of the active Airbnb listings in Villafranca di Verona, indicating a high concentration in these sizes.
- With over half the market (63%) consisting of studios or 1-bedroom units, Villafranca di Verona is particularly well-suited for individuals or couples.
- Listings with 3+ bedrooms (7.4%) represent a smaller niche, potentially indicating an underserved market for larger group accommodations in Villafranca di Verona.
Villafranca di Verona Vacation Rental Guest Capacity Trends (2025)
Distribution of Listings by Guest Capacity
Guest Capacity Insights for Villafranca di Verona
- The most common guest capacity trend in Villafranca di Verona vacation rentals is listings accommodating 2 guests (37%). This suggests the primary traveler segment is likely couples or solo travelers.
- Properties designed for 2 guests and 4 guests dominate the Villafranca di Verona STR market, accounting for 51.8% of listings.
- A significant 40.7% of listings cater specifically to 1-2 guests, highlighting strong demand from couples and solo travelers in Villafranca di Verona.
- 14.8% of properties accommodate 6+ guests, serving the market segment for larger families or group travel in Villafranca di Verona.
- On average, properties in Villafranca di Verona are equipped to host 3.0 guests.
Villafranca di Verona Airbnb Booking Patterns (2025): Available vs. Booked Days
Available Days Distribution
Booked Days Distribution
Booking Pattern Insights for Villafranca di Verona
- The most common availability pattern in Villafranca di Verona falls within the 271-366 days range, representing 63% of listings. This suggests many properties have significant open periods on their calendars.
- Approximately 92.6% of listings show high availability (181+ days open annually), indicating potential for increased bookings or specific owner usage patterns.
- For booked days, the 1-30 days range is most frequent in Villafranca di Verona (33.3%), reflecting common guest stay durations or potential owner blocking patterns.
- A notable 7.4% of properties secure long booking periods (181+ days booked per year), highlighting successful long-term rental strategies or significant owner usage.
Villafranca di Verona Airbnb Minimum Stay Requirements Analysis
Distribution of Listings by Minimum Night Requirement
1 Night
8 listings
34.8% of total
2 Nights
9 listings
39.1% of total
3 Nights
1 listings
4.3% of total
4-6 Nights
1 listings
4.3% of total
30+ Nights
4 listings
17.4% of total
Key Insights
- The most prevalent minimum stay requirement in Villafranca di Verona is 2 Nights, adopted by 39.1% of listings. This highlights the market's preference for shorter, flexible bookings.
- A strong majority (73.9%) of the Villafranca di Verona Airbnb data shows acceptance of very short stays (1-2 nights), indicating a dynamic, high-turnover market.
- A significant segment (17.4%) caters to monthly stays (30+ nights) in Villafranca di Verona, pointing to opportunities in the extended-stay market.
Recommendations
- Align with the market by considering a 2 Nights minimum stay, as 39.1% of Villafranca di Verona hosts use this setting.
- Explore offering discounts for stays of 30+ nights to attract the 17.4% of the market seeking extended stays.
- Adjust minimum nights based on seasonality – potentially shorter during low season and longer during peak demand periods in Villafranca di Verona.
Villafranca di Verona Airbnb Cancellation Policy Trends Analysis (2025)
Flexible
15 listings
68.2% of total
Moderate
5 listings
22.7% of total
Strict
2 listings
9.1% of total
Cancellation Policy Insights for Villafranca di Verona
- The prevailing Airbnb cancellation policy trend in Villafranca di Verona is Flexible, used by 68.2% of listings.
- The market strongly favors guest-friendly terms, with 90.9% of listings offering Flexible or Moderate policies. This suggests guests in Villafranca di Verona may expect booking flexibility.
- Strict cancellation policies are quite rare (9.1%), potentially making listings with this policy less competitive unless justified by high demand or property type.
Recommendations for Hosts
- Consider adopting a Flexible policy to align with the 68.2% market standard in Villafranca di Verona.
- Given the high prevalence of Flexible policies (68.2%), offering this can enhance booking appeal, especially during shoulder seasons.
- Using a Strict policy might deter some guests, as only 9.1% of listings use it. Evaluate if potential revenue protection outweighs possible lower booking rates.
- Regularly review your cancellation policy against competitors and market demand shifts in Villafranca di Verona.
Villafranca di Verona STR Booking Lead Time Analysis (2025)
Average Booking Lead Time by Month
Booking Lead Time Insights for Villafranca di Verona
- The overall average booking lead time for vacation rentals in Villafranca di Verona is 43 days.
- Guests book furthest in advance for stays during August (average 77 days), likely coinciding with peak travel demand or local events.
- The shortest booking windows occur for stays in March (average 24 days), indicating more last-minute travel plans during this time.
- Seasonally, Summer (63 days avg.) sees the longest lead times, while Fall (47 days avg.) has the shortest, reflecting typical travel planning cycles.
Recommendations for Hosts
- Use the overall average lead time (43 days) as a baseline for your pricing and availability strategy in Villafranca di Verona.
- For August stays, consider implementing length-of-stay discounts or slightly higher rates for bookings made less than 77 days out to capitalize on advance planning.
- Target marketing efforts for the Summer season well in advance (at least 63 days) to capture early planners.
- Monitor your own booking lead times against these Villafranca di Verona averages to identify opportunities for dynamic pricing adjustments.
Popular & Essential Airbnb Amenities in Villafranca di Verona (2025)
Amenity Prevalence
Amenity Insights for Villafranca di Verona
- Essential amenities in Villafranca di Verona that guests expect include: Essentials, Air conditioning, TV, Heating, Wifi, Hot water. Lacking these (any) could significantly impact bookings.
- Popular amenities like Refrigerator, Hair dryer, Bed linens are common but not universal. Offering these can provide a competitive edge.
Recommendations for Hosts
- Ensure your listing includes all essential amenities for Villafranca di Verona: Essentials, Air conditioning, TV, Heating, Wifi, Hot water.
- Prioritize adding missing essentials: Hot water.
- Consider adding popular differentiators like Refrigerator or Hair dryer to increase appeal.
- Highlight unique or less common amenities you offer (e.g., hot tub, dedicated workspace, EV charger) in your listing description and photos.
- Regularly check competitor amenities in Villafranca di Verona to stay competitive.
Villafranca di Verona Airbnb Guest Demographics & Profile Analysis (2025)
Guest Profile Summary for Villafranca di Verona
- The typical guest profile for Airbnb in Villafranca di Verona consists of predominantly international visitors (66%), with top international origins including France, typically belonging to the Post-2000s (Gen Z/Alpha) group (50%), primarily speaking English or Italian.
- Domestic travelers account for 33.7% of guests.
- Key international markets include Italy (33.7%) and France (14.5%).
- Top languages spoken are English (39.8%) followed by Italian (22.4%).
- A significant demographic segment is the Post-2000s (Gen Z/Alpha) group, representing 50% of guests.
Recommendations for Hosts
- Focus marketing internationally, particularly towards travelers from France.
- Tailor amenities and listing descriptions to appeal to the dominant Post-2000s (Gen Z/Alpha) demographic (e.g., highlight fast WiFi, smart home features, local guides).
- Highlight unique local experiences or amenities relevant to the primary guest profile.
- Consider seasonal promotions aligned with peak travel times for key origin markets.
Nearby Short-Term Rental Market Comparison
How does the Villafranca di Verona Airbnb market stack up against its neighbors? Compare key performance metrics like average monthly revenue, ADR, and occupancy rates in surrounding areas to understand the broader regional STR landscape.
| Market | Active Properties | Monthly Revenue | Daily Rate | Avg. Occupancy |
|---|---|---|---|---|
| Urtijëi - St. Ulrich in Gröden - Ortisei | 163 | $4,698 | $630.45 | 40% |
| Moos in Passeier - Moso in Passiria | 17 | $4,619 | $547.60 | 27% |
| Brenzone sul Garda | 19 | $4,128 | $335.25 | 52% |
| Portofino | 68 | $4,086 | $454.35 | 44% |
| Sala Comacina | 64 | $3,794 | $400.27 | 50% |
| Bellagio | 373 | $3,630 | $328.26 | 55% |
| Oliveto Lario | 99 | $3,509 | $327.42 | 55% |
| Varenna | 216 | $3,419 | $272.27 | 56% |
| Carate Urio | 71 | $3,379 | $331.90 | 44% |
| Laglio | 64 | $4,873 | $463.61 | 47% |