Venice Airbnb Market Analysis 2025: Short Term Rental Data & Vacation Rental Statistics in Veneto, Italy
Is Airbnb profitable in Venice in 2025? Explore comprehensive Airbnb analytics for Venice, Veneto, Italy to uncover income potential. This 2025 STR market report for Venice, based on AirROI data from April 2024 to March 2025, reveals key trends in the bustling market of 6,405 active listings.
Whether you're considering an Airbnb investment in Venice, optimizing your existing vacation rental, or exploring rental arbitrage opportunities, understanding the Venice Airbnb data is crucial. Navigating the high regulation landscape is key to maximizing your short term rental income potential. Let's dive into the specifics.
Key Venice Airbnb Performance Metrics Overview
Monthly Airbnb Revenue Variations & Income Potential in Venice (2025)
Understanding the monthly revenue variations for Airbnb listings in Venice is key to maximizing your short term rental income potential. Seasonality significantly impacts earnings. Our analysis, based on data from the past 12 months, shows that the peak revenue month for STRs in Venice is typically May, while January often presents the lowest earnings, highlighting opportunities for strategic pricing adjustments during shoulder and low seasons. Explore the typical Airbnb income in Venice across different performance tiers:
- Best-in-class properties (Top 10%) achieve $7,714+ monthly, often utilizing dynamic pricing and superior guest experiences.
- Strong performing properties (Top 25%) earn $5,066 or more, indicating effective management and desirable locations/amenities.
- Typical properties (Median) generate around $3,221 per month, representing the average market performance.
- Entry-level properties (Bottom 25%) see earnings around $1,823, often with potential for optimization.
Average Monthly Airbnb Earnings Trend in Venice
Venice Airbnb Occupancy Rate Trends (2025)
Maximize your bookings by understanding the Venice STR occupancy trends. Seasonal demand shifts significantly influence how often properties are booked. Typically, Septembersees the highest demand (peak season occupancy), while January experiences the lowest (low season). Effective strategies, like adjusting minimum stays or offering promotions, can boost occupancy during slower periods. Here's how different property tiers perform in Venice:
- Best-in-class properties (Top 10%) achieve 87%+ occupancy, indicating high desirability and potentially optimized availability.
- Strong performing properties (Top 25%) maintain 74% or higher occupancy, suggesting good market fit and guest satisfaction.
- Typical properties (Median) have an occupancy rate around 57%.
- Entry-level properties (Bottom 25%) average 34% occupancy, potentially facing higher vacancy.
Average Monthly Occupancy Rate Trend in Venice
Average Daily Rate (ADR) Airbnb Trends in Venice (2025)
Effective short term rental pricing strategy in Venice involves understanding monthly ADR fluctuations. The Average Daily Rate (ADR) for Airbnb in Venice typically peaks in April and dips lowest during January. Leveraging Airbnb dynamic pricing tools or strategies based on this seasonality can significantly boost revenue. Here's a look at the typical nightly rates achieved:
- Best-in-class properties (Top 10%) command rates of $400+ per night, often due to premium features or locations.
- Strong performing properties (Top 25%) achieve nightly rates of $268 or more.
- Typical properties (Median) charge around $180 per night.
- Entry-level properties (Bottom 25%) earn around $127 per night.
Average Daily Rate (ADR) Trend by Month in Venice
Get Live Venice Market Intelligence 👇

Explore Real-time Analytics
Airbnb Seasonality Analysis & Trends in Venice (2025)
Peak Season (May, September, October)
- Revenue averages $5,562 per month
- Occupancy rates average 70.6%
- Daily rates average $243
Shoulder Season
- Revenue averages $4,165 per month
- Occupancy maintains around 54.4%
- Daily rates hold near $236
Low Season (January, February, March)
- Revenue drops to average $2,217 per month
- Occupancy decreases to average 35.3%
- Daily rates adjust to average $220
Seasonality Insights for Venice
- The Airbnb seasonality in Venice shows highly seasonal trends requiring careful strategy. While the sections above show seasonal averages, it's also insightful to look at the extremes:
- During the high season, the absolute peak month showcases Venice's highest earning potential, with monthly revenues capable of climbing to $5,901, occupancy reaching a high of 71.2%, and ADRs peaking at $247.
- Conversely, the slowest single month of the year, typically falling within the low season, marks the market's lowest point. In this month, revenue might dip to $2,052, occupancy could drop to 32.4%, and ADRs may adjust down to $213.
- Understanding both the seasonal averages and these monthly peaks and troughs in revenue, occupancy, and ADR is crucial for maximizing your Airbnb profit potential in Venice.
Seasonal Strategies for Maximizing Profit
- Peak Season: Maximize revenue through premium pricing and potentially longer minimum stays. Ensure high availability.
- Low Season: Offer competitive pricing, special promotions (e.g., extended stay discounts), and flexible cancellation policies. Target off-season travelers like remote workers or budget-conscious guests.
- Shoulder Seasons: Implement dynamic pricing that balances peak and low rates. Target weekend travelers or specific events. Offer slightly more flexible terms than peak season.
- Regularly analyze your own performance against these Venice seasonality benchmarks and adjust your pricing and availability strategy accordingly.
Best Areas for Airbnb Investment in Venice (2025)
Exploring the top neighborhoods for short-term rentals in Venice? This section highlights key areas, outlining why they are attractive for hosts and guests, along with notable local attractions. Consider these locations based on your target guest profile and investment strategy.
| Neighborhood / Area | Why Host Here? (Target Guests & Appeal) | Key Attractions & Landmarks |
|---|---|---|
| San Marco | The heart of Venice, known for St. Mark's Basilica and the Grand Canal. This area attracts tourists looking for historical experiences, art, and stunning architecture. | St. Mark's Basilica, Doge's Palace, Piazza San Marco, Grand Canal, Campanile di San Marco |
| Cannaregio | A quieter and more authentic district, known for its local eateries and canals. Appeals to travelers seeking a taste of local life and culture. | The Jewish Ghetto, Madrisa Canal, Chiesa della Madonna dell'Orto, Fondamenta della Misericordia, Barca di Pizzico |
| Dorsoduro | Home to the famous Peggy Guggenheim Collection and beautiful canals, making it popular among art lovers and couples. A romantic area with local charm. | Peggy Guggenheim Collection, Accademia Gallery, Santa Maria della Salute, Ponte dell'Accademia, Campo Santa Margherita |
| Rialto | Historic market district known for the famous Rialto Bridge and bustling markets. Perfect for visitors wanting to experience Venice’s commercial heart. | Rialto Bridge, Rialto Market, Church of San Giacomo di Rialto, The Grand Canal, Ponte dei Pugni |
| Castello | A lesser-known area featuring historic architecture and local life. Great for those wanting to explore away from the main tourist paths. | St. John and Paul Church, Giardini della Biennale, Arsenal of Venice, Campo Santa Maria Formosa, Biennale Gardens |
| Giudecca | An island just across the canal from the main city, offering stunning views of the skyline and a more relaxed atmosphere. | Chiesa del Redentore, Punta della Dogana, Fondamenta delle Zattere, Giudecca Beach, Giudecca Canal |
| Murano | Famous for its glass-making workshops, attracting those interested in artisan crafts and unique shopping experiences. | Murano Glass Museum, Basilica di Santa Maria e Donato, Glassblowing demonstrations, Fondamenta Vetrai, Chiesa di San Pietro Martire |
| Burano | Known for its colorful houses and lace-making, this picturesque island is popular among photographers and those seeking a charming day trip from Venice. | Burano Lace Museum, Basilica di San Martino, Colored Houses, Ponte del Diavolo, Campo Marco |
Understanding Airbnb License Requirements & STR Laws in Venice (2025)
Yes, Venice, Veneto, Italy enforces high STR regulations. Obtaining a license and ensuring compliance is almost certainly required according to current 2025 STR laws. Always verify the latest short term rental regulations and Airbnb license requirements directly with local government authorities for Venice to ensure full compliance before hosting.
(Source: AirROI data, 2025, based on 80% licensed listings)
Top Performing Airbnb Properties in Venice (2025)
Benchmark your potential! Explore examples of top-performing Airbnb properties in Venicebased on Trailing Twelve Month (TTM) revenue. Analyze their characteristics, revenue, occupancy rate, and ADR to understand what drives success in this market.

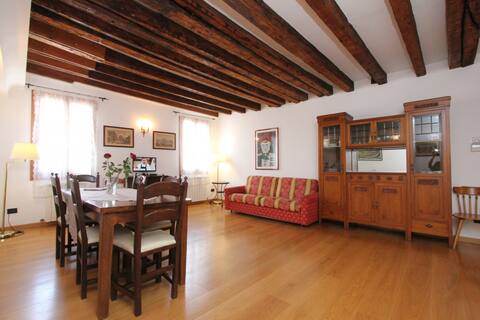
Apt Theatre: Antique Charm & Design in St. Mark
Entire Place • 4 bedrooms
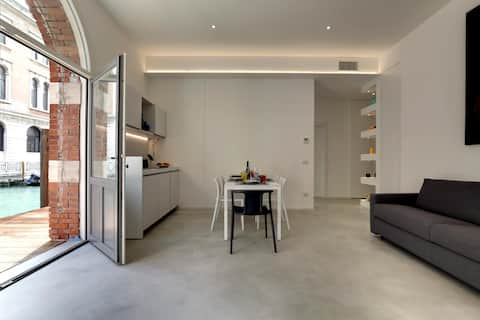
Residence dei Mori (80m from Rialto´s Bridge)
Entire Place • 7 bedrooms
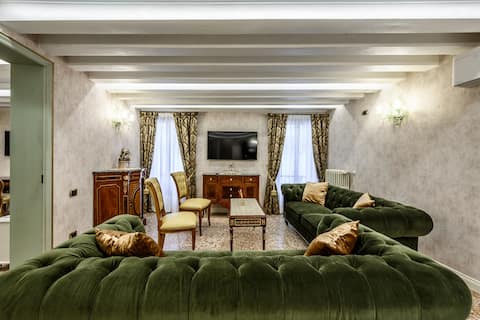
Terrace Luxury Loft, perfect for 14 people!
Entire Place • 5 bedrooms

Imperial
Entire Place • 3 bedrooms
Cà Rialto 4122 - Luxury Terrace
Entire Place • 4 bedrooms

Ca' Martinego : A jewel in Venice !
Entire Place • 3 bedrooms
Note: Performance varies based on location, size, amenities, seasonality, and management quality. Data reflects the past 12 months.
Top Performing Airbnb Hosts in Venice (2025)
Learn from the best! This table showcases top-performing Airbnb hosts in Venice based on the number of properties managed and estimated total revenue over the past year. Analyze their scale and performance metrics.
| Host Name | Properties | Grossing Revenue | Stay Reviews | Avg Rating |
|---|---|---|---|---|
| Veniceapartment-Com | 125 | $10,390,950 | 5182 | 4.49/5.0 |
| Views On Venice | 76 | $8,460,596 | 3900 | 4.87/5.0 |
| Truly Venice | 57 | $4,770,107 | 1285 | 4.74/5.0 |
| Easy Suite | 70 | $3,846,301 | 8049 | 4.52/5.0 |
| Rent&Relax | 63 | $3,320,947 | 1700 | 4.40/5.0 |
| Caroline E Marco | 34 | $2,504,461 | 1116 | 4.49/5.0 |
| Mario | 21 | $1,768,393 | 2465 | 4.80/5.0 |
| Silvia | 27 | $1,753,934 | 2662 | 4.70/5.0 |
| Giusy & Fabrizio | 27 | $1,686,609 | 1727 | 4.52/5.0 |
| Easy Rentals Srl | 25 | $1,661,937 | 2501 | 4.58/5.0 |
Analyzing the strategies of top hosts, such as their property selection, pricing, and guest communication, can offer valuable lessons for optimizing your own Airbnb operations in Venice.
Dive Deeper: Advanced Venice STR Market Data (2025)
Ready to unlock more insights? AirROI provides access to advanced metrics and comprehensive Airbnb data for Venice. Explore detailed analytics beyond this report to refine your investment strategy, optimize pricing, and maximize your vacation rental profits.
Explore Advanced MetricsVenice Short-Term Rental Market Composition (2025): Property & Room Types
Room Type Distribution
Property Type Distribution
Market Composition Insights for Venice
- The Venice Airbnb market composition is heavily skewed towards Entire Home/Apt listings, which make up 81.4% of the 6,405 active rentals. This indicates strong guest preference for privacy and space.
- Looking at the property type distribution in Venice, Apartment/Condo properties are the most common (83.5%), reflecting the local real estate landscape.
- The presence of 6.4% Hotel/Boutique listings indicates integration with traditional hospitality.
- Smaller segments like others, outdoor/unique (combined 1.4%) offer potential for unique stay experiences.
Venice Airbnb Room Capacity Analysis (2025): Bedroom Distribution
Distribution of Listings by Number of Bedrooms
Room Capacity Insights for Venice
- The dominant room capacity in Venice is 1 bedroom listings, making up 44.4% of the market. This suggests a strong demand for properties suitable for couples or solo travelers.
- Together, 1 bedroom and 2 bedrooms properties represent 77.4% of the active Airbnb listings in Venice, indicating a high concentration in these sizes.
Venice Vacation Rental Guest Capacity Trends (2025)
Distribution of Listings by Guest Capacity
Guest Capacity Insights for Venice
- The most common guest capacity trend in Venice vacation rentals is listings accommodating 4 guests (30.1%). This suggests the primary traveler segment is likely small families or groups.
- Properties designed for 4 guests and 2 guests dominate the Venice STR market, accounting for 53.0% of listings.
- 16.3% of properties accommodate 6+ guests, serving the market segment for larger families or group travel in Venice.
- On average, properties in Venice are equipped to host 3.5 guests.
Venice Airbnb Booking Patterns (2025): Available vs. Booked Days
Available Days Distribution
Booked Days Distribution
Booking Pattern Insights for Venice
- The most common availability pattern in Venice falls within the 91-180 days range, representing 39% of listings. This suggests many properties have significant open periods on their calendars.
- Approximately 48.1% of listings show high availability (181+ days open annually), indicating potential for increased bookings or specific owner usage patterns.
- For booked days, the 181-270 days range is most frequent in Venice (39.7%), reflecting common guest stay durations or potential owner blocking patterns.
- A notable 53.9% of properties secure long booking periods (181+ days booked per year), highlighting successful long-term rental strategies or significant owner usage.
Venice Airbnb Minimum Stay Requirements Analysis
Distribution of Listings by Minimum Night Requirement
1 Night
1049 listings
17.5% of total
2 Nights
1989 listings
33.2% of total
3 Nights
1033 listings
17.2% of total
4-6 Nights
326 listings
5.4% of total
7-29 Nights
222 listings
3.7% of total
30+ Nights
1375 listings
22.9% of total
Key Insights
- The most prevalent minimum stay requirement in Venice is 2 Nights, adopted by 33.2% of listings. This highlights the market's preference for shorter, flexible bookings.
- A significant segment (22.9%) caters to monthly stays (30+ nights) in Venice, pointing to opportunities in the extended-stay market.
Recommendations
- Align with the market by considering a 2 Nights minimum stay, as 33.2% of Venice hosts use this setting.
- If feasible, allowing 1-night stays, especially midweek or during low season, could capture last-minute bookings, as only 17.5% currently do.
- A 2-night minimum appears standard (33.2%). Consider this for weekends or peak periods.
- Explore offering discounts for stays of 30+ nights to attract the 22.9% of the market seeking extended stays.
- Adjust minimum nights based on seasonality – potentially shorter during low season and longer during peak demand periods in Venice.
Venice Airbnb Cancellation Policy Trends Analysis (2025)
Super Strict 60 Days
43 listings
0.7% of total
Super Strict 30 Days
213 listings
3.6% of total
Flexible
1362 listings
22.9% of total
Moderate
3295 listings
55.4% of total
Strict
1038 listings
17.4% of total
Cancellation Policy Insights for Venice
- The prevailing Airbnb cancellation policy trend in Venice is Moderate, used by 55.4% of listings.
- The market strongly favors guest-friendly terms, with 78.3% of listings offering Flexible or Moderate policies. This suggests guests in Venice may expect booking flexibility.
Recommendations for Hosts
- Consider adopting a Moderate policy to align with the 55.4% market standard in Venice.
- Regularly review your cancellation policy against competitors and market demand shifts in Venice.
Venice STR Booking Lead Time Analysis (2025)
Average Booking Lead Time by Month
Booking Lead Time Insights for Venice
- The overall average booking lead time for vacation rentals in Venice is 68 days.
- Guests book furthest in advance for stays during May (average 98 days), likely coinciding with peak travel demand or local events.
- The shortest booking windows occur for stays in January (average 53 days), indicating more last-minute travel plans during this time.
- Seasonally, Spring (82 days avg.) sees the longest lead times, while Winter (56 days avg.) has the shortest, reflecting typical travel planning cycles.
Recommendations for Hosts
- Use the overall average lead time (68 days) as a baseline for your pricing and availability strategy in Venice.
- For May stays, consider implementing length-of-stay discounts or slightly higher rates for bookings made less than 98 days out to capitalize on advance planning.
- Target marketing efforts for the Spring season well in advance (at least 82 days) to capture early planners.
- Monitor your own booking lead times against these Venice averages to identify opportunities for dynamic pricing adjustments.
Popular & Essential Airbnb Amenities in Venice (2025)
Amenity Prevalence
Amenity Insights for Venice
- Essential amenities in Venice that guests expect include: Wifi, Heating. Lacking these (any) could significantly impact bookings.
- Popular amenities like Hair dryer, Essentials, Air conditioning are common but not universal. Offering these can provide a competitive edge.
Recommendations for Hosts
- Ensure your listing includes all essential amenities for Venice: Wifi, Heating.
- Prioritize adding missing essentials: Wifi, Heating.
- Consider adding popular differentiators like Hair dryer or Essentials to increase appeal.
- Highlight unique or less common amenities you offer (e.g., hot tub, dedicated workspace, EV charger) in your listing description and photos.
- Regularly check competitor amenities in Venice to stay competitive.
Venice Airbnb Guest Demographics & Profile Analysis (2025)
Guest Profile Summary for Venice
- The typical guest profile for Airbnb in Venice consists of predominantly international visitors (97%), with top international origins including United Kingdom, typically belonging to the Post-2000s (Gen Z/Alpha) group (50%), primarily speaking English or Spanish.
- Domestic travelers account for 3.2% of guests.
- Key international markets include United States (33.4%) and United Kingdom (11.9%).
- Top languages spoken are English (48.7%) followed by Spanish (11.4%).
- A significant demographic segment is the Post-2000s (Gen Z/Alpha) group, representing 50% of guests.
Recommendations for Hosts
- Focus marketing internationally, particularly towards travelers from United Kingdom.
- Tailor amenities and listing descriptions to appeal to the dominant Post-2000s (Gen Z/Alpha) demographic (e.g., highlight fast WiFi, smart home features, local guides).
- Highlight unique local experiences or amenities relevant to the primary guest profile.
- Consider seasonal promotions aligned with peak travel times for key origin markets.
Nearby Short-Term Rental Market Comparison
How does the Venice Airbnb market stack up against its neighbors? Compare key performance metrics like average monthly revenue, ADR, and occupancy rates in surrounding areas to understand the broader regional STR landscape.
| Market | Active Properties | Monthly Revenue | Daily Rate | Avg. Occupancy |
|---|---|---|---|---|
| Urtijëi - St. Ulrich in Gröden - Ortisei | 163 | $4,698 | $630.45 | 40% |
| Moos in Passeier - Moso in Passiria | 17 | $4,619 | $547.60 | 27% |
| Selina | 14 | $4,330 | $440.33 | 47% |
| Cortina d'Ampezzo | 265 | $3,522 | $379.53 | 43% |
| La Val - Wengen - La Valle | 20 | $3,117 | $503.24 | 36% |
| Sëlva - Wolkenstein - Selva di Val Gardena | 95 | $2,923 | $414.01 | 42% |
| Colle Santa Lucia | 16 | $2,841 | $187.59 | 47% |
| Rojnići | 13 | $2,827 | $244.42 | 48% |
| Lajen - Laion | 85 | $2,777 | $498.85 | 34% |
| Welsberg-Taisten - Monguelfo-Tesido | 27 | $2,749 | $252.32 | 48% |