Tarzo Airbnb Market Analysis 2025: Short Term Rental Data & Vacation Rental Statistics in Veneto, Italy
Is Airbnb profitable in Tarzo in 2025? Explore comprehensive Airbnb analytics for Tarzo, Veneto, Italy to uncover income potential. This 2025 STR market report for Tarzo, based on AirROI data from April 2024 to March 2025, reveals key trends in the niche market of 21 active listings.
Whether you're considering an Airbnb investment in Tarzo, optimizing your existing vacation rental, or exploring rental arbitrage opportunities, understanding the Tarzo Airbnb data is crucial. Navigating the high regulation landscape is key to maximizing your short term rental income potential. Let's dive into the specifics.
Key Tarzo Airbnb Performance Metrics Overview
Monthly Airbnb Revenue Variations & Income Potential in Tarzo (2025)
Understanding the monthly revenue variations for Airbnb listings in Tarzo is key to maximizing your short term rental income potential. Seasonality significantly impacts earnings. Our analysis, based on data from the past 12 months, shows that the peak revenue month for STRs in Tarzo is typically August, while March often presents the lowest earnings, highlighting opportunities for strategic pricing adjustments during shoulder and low seasons. Explore the typical Airbnb income in Tarzo across different performance tiers:
- Best-in-class properties (Top 10%) achieve $2,339+ monthly, often utilizing dynamic pricing and superior guest experiences.
- Strong performing properties (Top 25%) earn $1,361 or more, indicating effective management and desirable locations/amenities.
- Typical properties (Median) generate around $753 per month, representing the average market performance.
- Entry-level properties (Bottom 25%) see earnings around $421, often with potential for optimization.
Average Monthly Airbnb Earnings Trend in Tarzo
Tarzo Airbnb Occupancy Rate Trends (2025)
Maximize your bookings by understanding the Tarzo STR occupancy trends. Seasonal demand shifts significantly influence how often properties are booked. Typically, Augustsees the highest demand (peak season occupancy), while March experiences the lowest (low season). Effective strategies, like adjusting minimum stays or offering promotions, can boost occupancy during slower periods. Here's how different property tiers perform in Tarzo:
- Best-in-class properties (Top 10%) achieve 68%+ occupancy, indicating high desirability and potentially optimized availability.
- Strong performing properties (Top 25%) maintain 42% or higher occupancy, suggesting good market fit and guest satisfaction.
- Typical properties (Median) have an occupancy rate around 25%.
- Entry-level properties (Bottom 25%) average 15% occupancy, potentially facing higher vacancy.
Average Monthly Occupancy Rate Trend in Tarzo
Average Daily Rate (ADR) Airbnb Trends in Tarzo (2025)
Effective short term rental pricing strategy in Tarzo involves understanding monthly ADR fluctuations. The Average Daily Rate (ADR) for Airbnb in Tarzo typically peaks in July and dips lowest during March. Leveraging Airbnb dynamic pricing tools or strategies based on this seasonality can significantly boost revenue. Here's a look at the typical nightly rates achieved:
- Best-in-class properties (Top 10%) command rates of $164+ per night, often due to premium features or locations.
- Strong performing properties (Top 25%) achieve nightly rates of $129 or more.
- Typical properties (Median) charge around $91 per night.
- Entry-level properties (Bottom 25%) earn around $68 per night.
Average Daily Rate (ADR) Trend by Month in Tarzo
Get Live Tarzo Market Intelligence 👇

Explore Real-time Analytics
Airbnb Seasonality Analysis & Trends in Tarzo (2025)
Peak Season (August, July, June)
- Revenue averages $1,728 per month
- Occupancy rates average 48.9%
- Daily rates average $121
Shoulder Season
- Revenue averages $907 per month
- Occupancy maintains around 29.6%
- Daily rates hold near $108
Low Season (February, March, October)
- Revenue drops to average $514 per month
- Occupancy decreases to average 18.7%
- Daily rates adjust to average $102
Seasonality Insights for Tarzo
- The Airbnb seasonality in Tarzo shows highly seasonal trends requiring careful strategy. While the sections above show seasonal averages, it's also insightful to look at the extremes:
- During the high season, the absolute peak month showcases Tarzo's highest earning potential, with monthly revenues capable of climbing to $2,098, occupancy reaching a high of 65.1%, and ADRs peaking at $122.
- Conversely, the slowest single month of the year, typically falling within the low season, marks the market's lowest point. In this month, revenue might dip to $461, occupancy could drop to 17.1%, and ADRs may adjust down to $95.
- Understanding both the seasonal averages and these monthly peaks and troughs in revenue, occupancy, and ADR is crucial for maximizing your Airbnb profit potential in Tarzo.
Seasonal Strategies for Maximizing Profit
- Peak Season: Maximize revenue through premium pricing and potentially longer minimum stays. Ensure high availability.
- Low Season: Offer competitive pricing, special promotions (e.g., extended stay discounts), and flexible cancellation policies. Target off-season travelers like remote workers or budget-conscious guests.
- Shoulder Seasons: Implement dynamic pricing that balances peak and low rates. Target weekend travelers or specific events. Offer slightly more flexible terms than peak season.
- Regularly analyze your own performance against these Tarzo seasonality benchmarks and adjust your pricing and availability strategy accordingly.
Best Areas for Airbnb Investment in Tarzo (2025)
Exploring the top neighborhoods for short-term rentals in Tarzo? This section highlights key areas, outlining why they are attractive for hosts and guests, along with notable local attractions. Consider these locations based on your target guest profile and investment strategy.
| Neighborhood / Area | Why Host Here? (Target Guests & Appeal) | Key Attractions & Landmarks |
|---|---|---|
| Cappella di Veneto | Charming area known for its stunning countryside views and proximity to nature. Ideal for tourists seeking a peaceful retreat close to nature, and local wineries. | Prosecco Wine Route, Natural Park of the Sile River, Local vineyards, Hiking trails, Cultural heritage sites |
| Tarzo Village Center | The heart of Tarzo, featuring quaint shops, local cafes, and a friendly community atmosphere. This area is perfect for travelers who want an authentic Italian small-town experience. | Piazza della Libertà, Local eateries, Church of San Giovanni Battista, Annual festivals, Artisan markets |
| Folly di Sopra | A picturesque hillside area offering breathtaking views of the surrounding mountains and valleys. Popular with tourists who appreciate outdoor activities like hiking and cycling. | Hiking trails, Breathtaking panoramic views, Nature photography spots, Cottages and farm stays, Quiet retreat areas |
| Molinetto della Croda | Famous for its historic watermill and beautiful landscapes. It attracts nature lovers and those interested in history and photography. | Molinetto della Croda, Scenic walking trails, Historical sites, Photography opportunities, Picnic areas |
| Pieve di Soligo | A nearby town with a charming atmosphere and plenty of amenities. It serves as a good base for visitors exploring the Prosecco wine region. | Pieve di Soligo Church, Local markets, Wine tasting experiences, Prosecco production tours, Historic architecture |
| Cison di Valmarino | Known for its stunning medieval village, Cison di Valmarino is perfect for history buffs and those seeking a picturesque setting. | Castello di Castelbrando, Scenic old town, Cultural festivals, Natural parks, Artisan shops |
| Revine Lago | This beautiful area combines lakes and mountains, perfect for water activities and outdoor sports, appealing to families and adventure seekers. | Lake Revine, Water sports activities, Cycling paths, Family-friendly parks, Nature walks |
| Asolo | A bit further afield but worth the visit, Asolo is a historic town known for its art, culture, and stunning scenery. Great for cultural escapes. | Asolo Castle, Historic town center, Cultural events, Local artisan shops, Scenic viewpoints |
Understanding Airbnb License Requirements & STR Laws in Tarzo (2025)
Yes, Tarzo, Veneto, Italy enforces high STR regulations. Obtaining a license and ensuring compliance is almost certainly required according to current 2025 STR laws. Always verify the latest short term rental regulations and Airbnb license requirements directly with local government authorities for Tarzo to ensure full compliance before hosting.
(Source: AirROI data, 2025, based on 52% licensed listings)
Top Performing Airbnb Properties in Tarzo (2025)
Benchmark your potential! Explore examples of top-performing Airbnb properties in Tarzobased on Trailing Twelve Month (TTM) revenue. Analyze their characteristics, revenue, occupancy rate, and ADR to understand what drives success in this market.
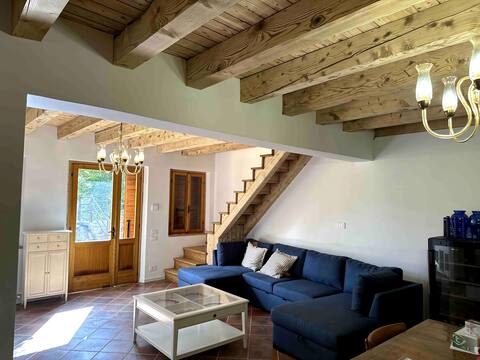
Villa in the woods in the prosecco hills
Entire Place • 3 bedrooms
La casa dei ghiri loc.tur. n°026084-LOC-00038
Entire Place • 2 bedrooms

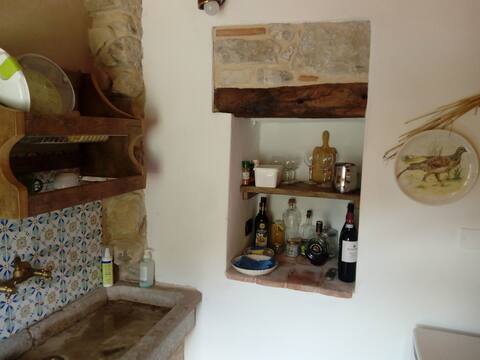
Grandparents' house in the UNESCO heritage hills.
Entire Place • 2 bedrooms

Casa Cesira between the Prosecco hills and lakes
Entire Place • 2 bedrooms

GRANDPA 'S VACATION HOME BETWEEN LAKES AND PROSECCO
Entire Place • 3 bedrooms

Casa delle Rose
Entire Place • 2 bedrooms
Note: Performance varies based on location, size, amenities, seasonality, and management quality. Data reflects the past 12 months.
Top Performing Airbnb Hosts in Tarzo (2025)
Learn from the best! This table showcases top-performing Airbnb hosts in Tarzo based on the number of properties managed and estimated total revenue over the past year. Analyze their scale and performance metrics.
| Host Name | Properties | Grossing Revenue | Stay Reviews | Avg Rating |
|---|---|---|---|---|
| Gabriele | 2 | $21,975 | 70 | 4.80/5.0 |
| Silvia Clarissa | 1 | $21,326 | 10 | 4.90/5.0 |
| Danilo | 1 | $16,369 | 13 | 5.00/5.0 |
| Davide | 1 | $11,525 | 82 | 4.77/5.0 |
| Dario | 2 | $10,243 | 4 | 2.38/5.0 |
| Nello | 1 | $9,825 | 17 | 4.71/5.0 |
| Saro | 1 | $9,143 | 11 | 4.91/5.0 |
| Mirella | 1 | $8,673 | 53 | 4.81/5.0 |
| Eva | 1 | $6,936 | 12 | 5.00/5.0 |
| Novasol | 1 | $6,538 | 5 | 4.60/5.0 |
Analyzing the strategies of top hosts, such as their property selection, pricing, and guest communication, can offer valuable lessons for optimizing your own Airbnb operations in Tarzo.
Dive Deeper: Advanced Tarzo STR Market Data (2025)
Ready to unlock more insights? AirROI provides access to advanced metrics and comprehensive Airbnb data for Tarzo. Explore detailed analytics beyond this report to refine your investment strategy, optimize pricing, and maximize your vacation rental profits.
Explore Advanced MetricsTarzo Short-Term Rental Market Composition (2025): Property & Room Types
Room Type Distribution
Property Type Distribution
Market Composition Insights for Tarzo
- The Tarzo Airbnb market composition is heavily skewed towards Entire Home/Apt listings, which make up 85.7% of the 21 active rentals. This indicates strong guest preference for privacy and space.
- Looking at the property type distribution in Tarzo, House properties are the most common (71.4%), reflecting the local real estate landscape.
- Houses represent a significant 71.4% portion, catering likely to families or larger groups.
Tarzo Airbnb Room Capacity Analysis (2025): Bedroom Distribution
Distribution of Listings by Number of Bedrooms
Room Capacity Insights for Tarzo
- The dominant room capacity in Tarzo is 2 bedrooms listings, making up 47.6% of the market. This suggests a strong demand for properties suitable for couples or solo travelers.
- Together, 2 bedrooms and 3 bedrooms properties represent 76.2% of the active Airbnb listings in Tarzo, indicating a high concentration in these sizes.
- A significant 28.6% of listings offer 3+ bedrooms, catering to larger groups and families seeking more space in Tarzo.
Tarzo Vacation Rental Guest Capacity Trends (2025)
Distribution of Listings by Guest Capacity
Guest Capacity Insights for Tarzo
- The most common guest capacity trend in Tarzo vacation rentals is listings accommodating 4 guests (33.3%). This suggests the primary traveler segment is likely small families or groups.
- Properties designed for 4 guests and 5 guests dominate the Tarzo STR market, accounting for 66.6% of listings.
- On average, properties in Tarzo are equipped to host 4.1 guests.
Tarzo Airbnb Booking Patterns (2025): Available vs. Booked Days
Available Days Distribution
Booked Days Distribution
Booking Pattern Insights for Tarzo
- The most common availability pattern in Tarzo falls within the 271-366 days range, representing 57.1% of listings. This suggests many properties have significant open periods on their calendars.
- Approximately 100.0% of listings show high availability (181+ days open annually), indicating potential for increased bookings or specific owner usage patterns.
- For booked days, the 91-180 days range is most frequent in Tarzo (42.9%), reflecting common guest stay durations or potential owner blocking patterns.
Tarzo Airbnb Minimum Stay Requirements Analysis
Distribution of Listings by Minimum Night Requirement
1 Night
2 listings
11.1% of total
2 Nights
7 listings
38.9% of total
3 Nights
6 listings
33.3% of total
7-29 Nights
2 listings
11.1% of total
30+ Nights
1 listings
5.6% of total
Key Insights
- The most prevalent minimum stay requirement in Tarzo is 2 Nights, adopted by 38.9% of listings. This highlights the market's preference for shorter, flexible bookings.
Recommendations
- Align with the market by considering a 2 Nights minimum stay, as 38.9% of Tarzo hosts use this setting.
- If feasible, allowing 1-night stays, especially midweek or during low season, could capture last-minute bookings, as only 11.1% currently do.
- A 2-night minimum appears standard (38.9%). Consider this for weekends or peak periods.
- Explore offering discounts for stays of 30+ nights to attract the 5.6% of the market seeking extended stays.
- Adjust minimum nights based on seasonality – potentially shorter during low season and longer during peak demand periods in Tarzo.
Tarzo Airbnb Cancellation Policy Trends Analysis (2025)
Super Strict 60 Days
1 listings
5.6% of total
Flexible
7 listings
38.9% of total
Moderate
9 listings
50% of total
Strict
1 listings
5.6% of total
Cancellation Policy Insights for Tarzo
- The prevailing Airbnb cancellation policy trend in Tarzo is Moderate, used by 50% of listings.
- The market strongly favors guest-friendly terms, with 88.9% of listings offering Flexible or Moderate policies. This suggests guests in Tarzo may expect booking flexibility.
- Strict cancellation policies are quite rare (5.6%), potentially making listings with this policy less competitive unless justified by high demand or property type.
Recommendations for Hosts
- Consider adopting a Moderate policy to align with the 50% market standard in Tarzo.
- Using a Strict policy might deter some guests, as only 5.6% of listings use it. Evaluate if potential revenue protection outweighs possible lower booking rates.
- Regularly review your cancellation policy against competitors and market demand shifts in Tarzo.
Tarzo STR Booking Lead Time Analysis (2025)
Average Booking Lead Time by Month
Booking Lead Time Insights for Tarzo
- The overall average booking lead time for vacation rentals in Tarzo is 51 days.
- Guests book furthest in advance for stays during July (average 89 days), likely coinciding with peak travel demand or local events.
- The shortest booking windows occur for stays in March (average 16 days), indicating more last-minute travel plans during this time.
- Seasonally, Summer (80 days avg.) sees the longest lead times, while Winter (32 days avg.) has the shortest, reflecting typical travel planning cycles.
Recommendations for Hosts
- Use the overall average lead time (51 days) as a baseline for your pricing and availability strategy in Tarzo.
- For July stays, consider implementing length-of-stay discounts or slightly higher rates for bookings made less than 89 days out to capitalize on advance planning.
- Target marketing efforts for the Summer season well in advance (at least 80 days) to capture early planners.
- Monitor your own booking lead times against these Tarzo averages to identify opportunities for dynamic pricing adjustments.
Popular & Essential Airbnb Amenities in Tarzo (2025)
Amenity Prevalence
Amenity Insights for Tarzo
- Essential amenities in Tarzo that guests expect include: Kitchen. Lacking these (this) could significantly impact bookings.
- Popular amenities like Heating, Essentials, Free parking on premises are common but not universal. Offering these can provide a competitive edge.
- Warning: Wifi is not universally provided but is considered essential globally. Ensure reliable Wifi is offered.
Recommendations for Hosts
- Ensure your listing includes all essential amenities for Tarzo: Kitchen.
- Consider adding popular differentiators like Heating or Essentials to increase appeal.
- Highlight unique or less common amenities you offer (e.g., hot tub, dedicated workspace, EV charger) in your listing description and photos.
- Regularly check competitor amenities in Tarzo to stay competitive.
Tarzo Airbnb Guest Demographics & Profile Analysis (2025)
Guest Profile Summary for Tarzo
- The typical guest profile for Airbnb in Tarzo consists of predominantly international visitors (71%), with top international origins including Germany, typically belonging to the Post-2000s (Gen Z/Alpha) group (50%), primarily speaking English or German.
- Domestic travelers account for 29.1% of guests.
- Key international markets include Italy (29.1%) and Germany (22.1%).
- Top languages spoken are English (34.7%) followed by German (13.9%).
- A significant demographic segment is the Post-2000s (Gen Z/Alpha) group, representing 50% of guests.
Recommendations for Hosts
- Focus marketing internationally, particularly towards travelers from Germany.
- Tailor amenities and listing descriptions to appeal to the dominant Post-2000s (Gen Z/Alpha) demographic (e.g., highlight fast WiFi, smart home features, local guides).
- Highlight unique local experiences or amenities relevant to the primary guest profile.
- Consider seasonal promotions aligned with peak travel times for key origin markets.
Nearby Short-Term Rental Market Comparison
How does the Tarzo Airbnb market stack up against its neighbors? Compare key performance metrics like average monthly revenue, ADR, and occupancy rates in surrounding areas to understand the broader regional STR landscape.
| Market | Active Properties | Monthly Revenue | Daily Rate | Avg. Occupancy |
|---|---|---|---|---|
| Urtijëi - St. Ulrich in Gröden - Ortisei | 163 | $4,698 | $630.45 | 40% |
| Moos in Passeier - Moso in Passiria | 17 | $4,619 | $547.60 | 27% |
| Selina | 14 | $4,330 | $440.33 | 47% |
| Cortina d'Ampezzo | 265 | $3,522 | $379.53 | 43% |
| Venice | 6,405 | $3,454 | $238.80 | 53% |
| La Val - Wengen - La Valle | 20 | $3,117 | $503.24 | 36% |
| Sëlva - Wolkenstein - Selva di Val Gardena | 95 | $2,923 | $414.01 | 42% |
| Colle Santa Lucia | 16 | $2,841 | $187.59 | 47% |
| Rojnići | 13 | $2,827 | $244.42 | 48% |
| Lajen - Laion | 85 | $2,777 | $498.85 | 34% |