Roana Airbnb Market Analysis 2025: Short Term Rental Data & Vacation Rental Statistics in Veneto, Italy
Is Airbnb profitable in Roana in 2025? Explore comprehensive Airbnb analytics for Roana, Veneto, Italy to uncover income potential. This 2025 STR market report for Roana, based on AirROI data from April 2024 to March 2025, reveals key trends in the niche market of 40 active listings.
Whether you're considering an Airbnb investment in Roana, optimizing your existing vacation rental, or exploring rental arbitrage opportunities, understanding the Roana Airbnb data is crucial. Navigating the high regulation landscape is key to maximizing your short term rental income potential. Let's dive into the specifics.
Key Roana Airbnb Performance Metrics Overview
Monthly Airbnb Revenue Variations & Income Potential in Roana (2025)
Understanding the monthly revenue variations for Airbnb listings in Roana is key to maximizing your short term rental income potential. Seasonality significantly impacts earnings. Our analysis, based on data from the past 12 months, shows that the peak revenue month for STRs in Roana is typically August, while October often presents the lowest earnings, highlighting opportunities for strategic pricing adjustments during shoulder and low seasons. Explore the typical Airbnb income in Roana across different performance tiers:
- Best-in-class properties (Top 10%) achieve $3,830+ monthly, often utilizing dynamic pricing and superior guest experiences.
- Strong performing properties (Top 25%) earn $1,994 or more, indicating effective management and desirable locations/amenities.
- Typical properties (Median) generate around $948 per month, representing the average market performance.
- Entry-level properties (Bottom 25%) see earnings around $505, often with potential for optimization.
Average Monthly Airbnb Earnings Trend in Roana
Roana Airbnb Occupancy Rate Trends (2025)
Maximize your bookings by understanding the Roana STR occupancy trends. Seasonal demand shifts significantly influence how often properties are booked. Typically, Augustsees the highest demand (peak season occupancy), while October experiences the lowest (low season). Effective strategies, like adjusting minimum stays or offering promotions, can boost occupancy during slower periods. Here's how different property tiers perform in Roana:
- Best-in-class properties (Top 10%) achieve 66%+ occupancy, indicating high desirability and potentially optimized availability.
- Strong performing properties (Top 25%) maintain 42% or higher occupancy, suggesting good market fit and guest satisfaction.
- Typical properties (Median) have an occupancy rate around 25%.
- Entry-level properties (Bottom 25%) average 12% occupancy, potentially facing higher vacancy.
Average Monthly Occupancy Rate Trend in Roana
Average Daily Rate (ADR) Airbnb Trends in Roana (2025)
Effective short term rental pricing strategy in Roana involves understanding monthly ADR fluctuations. The Average Daily Rate (ADR) for Airbnb in Roana typically peaks in December and dips lowest during September. Leveraging Airbnb dynamic pricing tools or strategies based on this seasonality can significantly boost revenue. Here's a look at the typical nightly rates achieved:
- Best-in-class properties (Top 10%) command rates of $182+ per night, often due to premium features or locations.
- Strong performing properties (Top 25%) achieve nightly rates of $136 or more.
- Typical properties (Median) charge around $109 per night.
- Entry-level properties (Bottom 25%) earn around $85 per night.
Average Daily Rate (ADR) Trend by Month in Roana
Get Live Roana Market Intelligence 👇

Explore Real-time Analytics
Airbnb Seasonality Analysis & Trends in Roana (2025)
Peak Season (August, July, June)
- Revenue averages $2,191 per month
- Occupancy rates average 42.7%
- Daily rates average $123
Shoulder Season
- Revenue averages $1,357 per month
- Occupancy maintains around 27.5%
- Daily rates hold near $124
Low Season (February, October, November)
- Revenue drops to average $905 per month
- Occupancy decreases to average 24.6%
- Daily rates adjust to average $121
Seasonality Insights for Roana
- The Airbnb seasonality in Roana shows highly seasonal trends requiring careful strategy. While the sections above show seasonal averages, it's also insightful to look at the extremes:
- During the high season, the absolute peak month showcases Roana's highest earning potential, with monthly revenues capable of climbing to $2,598, occupancy reaching a high of 53.7%, and ADRs peaking at $138.
- Conversely, the slowest single month of the year, typically falling within the low season, marks the market's lowest point. In this month, revenue might dip to $873, occupancy could drop to 22.6%, and ADRs may adjust down to $118.
- Understanding both the seasonal averages and these monthly peaks and troughs in revenue, occupancy, and ADR is crucial for maximizing your Airbnb profit potential in Roana.
Seasonal Strategies for Maximizing Profit
- Peak Season: Maximize revenue through premium pricing and potentially longer minimum stays. Ensure high availability.
- Low Season: Offer competitive pricing, special promotions (e.g., extended stay discounts), and flexible cancellation policies. Target off-season travelers like remote workers or budget-conscious guests.
- Shoulder Seasons: Implement dynamic pricing that balances peak and low rates. Target weekend travelers or specific events. Offer slightly more flexible terms than peak season.
- Regularly analyze your own performance against these Roana seasonality benchmarks and adjust your pricing and availability strategy accordingly.
Best Areas for Airbnb Investment in Roana (2025)
Exploring the top neighborhoods for short-term rentals in Roana? This section highlights key areas, outlining why they are attractive for hosts and guests, along with notable local attractions. Consider these locations based on your target guest profile and investment strategy.
| Neighborhood / Area | Why Host Here? (Target Guests & Appeal) | Key Attractions & Landmarks |
|---|---|---|
| City Center | The vibrant heart of Roana, offering access to historical landmarks, local shops, and restaurants. A prime spot for tourists seeking cultural experiences and convenient amenities. | Piazza San Marco, Cappella di San Marco, Museo Civico, Shopping streets, Local eateries |
| Parks and Nature Areas | Roana is known for its natural beauty including parks and hiking trails. Ideal for vacationers interested in outdoor activities and tranquility. | Parco naturale regionale della Lessinia, Altopiano di Asiago, Hiking trails, Scenic viewpoints, Nature reserves |
| Historical Roana | Rich in history and charm, this area is perfect for those who appreciate heritage and traditional architecture. Great for guests interested in historical tourism. | Historic villas, Church of San Matteo, Local museums, Traditional festivals, Artisan shops |
| Altopiano di Asiago | A mountainous area known for its ski resorts in winter and hiking in summer, attracting both winter sports enthusiasts and summer travelers. | Ski slopes, Hiking trails, Scenic landscapes, Local farms, Cultural events |
| Local Cuisine District | Famous for its culinary delights, this area offers numerous restaurants and markets showcasing local Veneto cuisine, perfect for food enthusiasts. | Local trattorias, Wine tasting tours, Food markets, Cooking classes, Artisan food shops |
| Cultural District | Home to theaters, galleries, and cultural festivals, this area attracts tourists interested in the arts and local culture. | Theater venues, Art galleries, Cultural events, Local performances, Festivals |
| Family-Friendly Area | Focuses on amenities for families including parks, recreational areas, and family-oriented activities, making it ideal for family travelers. | Playgrounds, Family-oriented activities, Nearby attractions, Nature parks, Community events |
| Wellness Retreat Area | Known for spas, wellness centers, and relaxation spots, this area attracts visitors looking for rejuvenation and relaxation. | Spas, Wellness centers, Yoga retreats, Natural hot springs, Health food cafes |
Understanding Airbnb License Requirements & STR Laws in Roana (2025)
Yes, Roana, Veneto, Italy enforces high STR regulations. Obtaining a license and ensuring compliance is almost certainly required according to current 2025 STR laws. Always verify the latest short term rental regulations and Airbnb license requirements directly with local government authorities for Roana to ensure full compliance before hosting.
(Source: AirROI data, 2025, based on 57% licensed listings)
Top Performing Airbnb Properties in Roana (2025)
Benchmark your potential! Explore examples of top-performing Airbnb properties in Roanabased on Trailing Twelve Month (TTM) revenue. Analyze their characteristics, revenue, occupancy rate, and ADR to understand what drives success in this market.
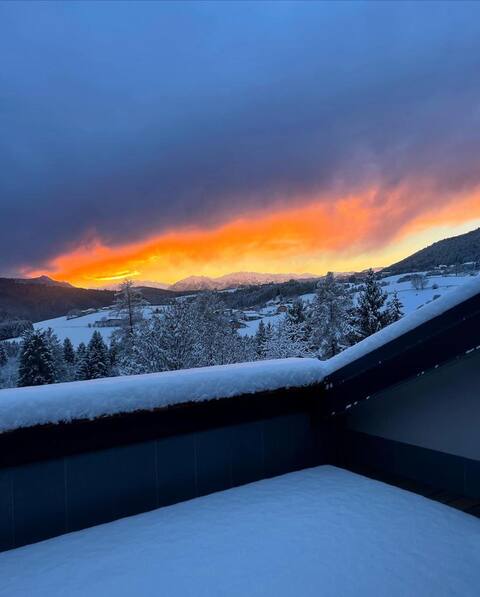
![[5 minutes from Asiago] Complete-Modern-Relaxing](https://a0.muscache.com/im/pictures/hosting/Hosting-U3RheVN1cHBseUxpc3Rpbmc6OTY4NTE1NDQ0NzU5ODk0NTU5/original/d46acf3e-c758-4174-a769-5541378d44e4.png?im_w=480&im_format=avif)
[5 minutes from Asiago] Complete-Modern-Relaxing
Entire Place • 2 bedrooms
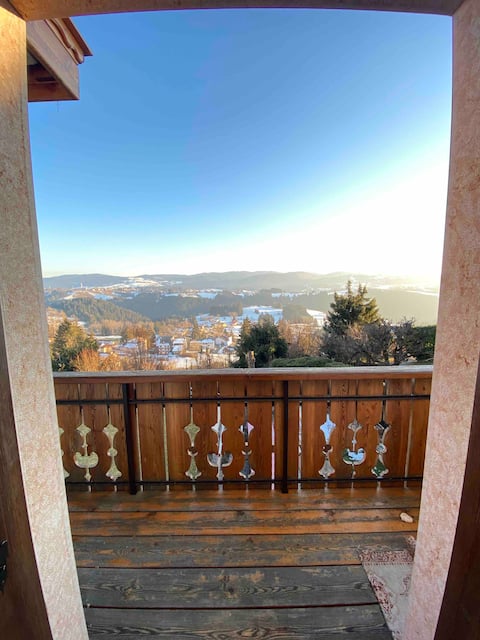
Penthouse with AltopianoAsiago view
Entire Place • 2 bedrooms
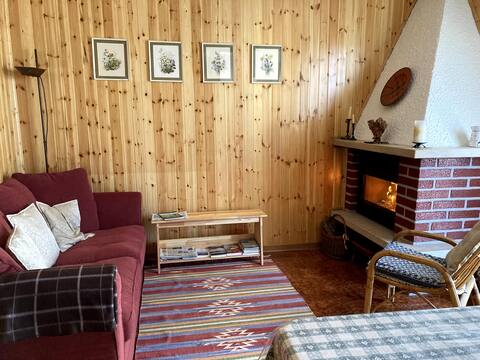
Charming wooden mountain house with a view
Entire Place • 3 bedrooms
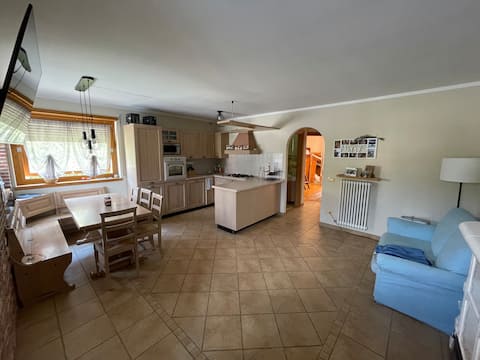
Apartment in a quiet area
Entire Place • 2 bedrooms

Wood, Nature, Asiago Forest, Roana, Cesuna, Cesuna
Entire Place • 1 bedroom
Asiago Plateau Apartment
Entire Place • 2 bedrooms
Note: Performance varies based on location, size, amenities, seasonality, and management quality. Data reflects the past 12 months.
Top Performing Airbnb Hosts in Roana (2025)
Learn from the best! This table showcases top-performing Airbnb hosts in Roana based on the number of properties managed and estimated total revenue over the past year. Analyze their scale and performance metrics.
| Host Name | Properties | Grossing Revenue | Stay Reviews | Avg Rating |
|---|---|---|---|---|
| Lorenzo | 1 | $46,400 | 14 | 5.00/5.0 |
| Alexandra | 1 | $43,097 | 5 | 4.40/5.0 |
| Davide | 1 | $25,727 | 6 | 4.83/5.0 |
| Anna Maria | 1 | $23,924 | 15 | 5.00/5.0 |
| Andrea | 1 | $23,326 | 26 | 4.77/5.0 |
| Luisa | 1 | $22,109 | 10 | 4.90/5.0 |
| Gianpiero | 1 | $21,838 | 62 | 4.79/5.0 |
| Sara | 1 | $19,659 | 11 | 4.91/5.0 |
| Franco | 3 | $17,539 | 37 | 4.34/5.0 |
| Eleonora | 1 | $16,589 | 12 | 5.00/5.0 |
Analyzing the strategies of top hosts, such as their property selection, pricing, and guest communication, can offer valuable lessons for optimizing your own Airbnb operations in Roana.
Dive Deeper: Advanced Roana STR Market Data (2025)
Ready to unlock more insights? AirROI provides access to advanced metrics and comprehensive Airbnb data for Roana. Explore detailed analytics beyond this report to refine your investment strategy, optimize pricing, and maximize your vacation rental profits.
Explore Advanced MetricsRoana Short-Term Rental Market Composition (2025): Property & Room Types
Room Type Distribution
Property Type Distribution
Market Composition Insights for Roana
- The Roana Airbnb market composition is heavily skewed towards Entire Home/Apt listings, which make up 100% of the 40 active rentals. This indicates strong guest preference for privacy and space.
- Looking at the property type distribution in Roana, Apartment/Condo properties are the most common (85%), reflecting the local real estate landscape.
Roana Airbnb Room Capacity Analysis (2025): Bedroom Distribution
Distribution of Listings by Number of Bedrooms
Room Capacity Insights for Roana
- The dominant room capacity in Roana is 2 bedrooms listings, making up 60% of the market. This suggests a strong demand for properties suitable for couples or solo travelers.
- Together, 2 bedrooms and 3 bedrooms properties represent 82.5% of the active Airbnb listings in Roana, indicating a high concentration in these sizes.
- A significant 22.5% of listings offer 3+ bedrooms, catering to larger groups and families seeking more space in Roana.
Roana Vacation Rental Guest Capacity Trends (2025)
Distribution of Listings by Guest Capacity
Guest Capacity Insights for Roana
- The most common guest capacity trend in Roana vacation rentals is listings accommodating 4 guests (30%). This suggests the primary traveler segment is likely small families or groups.
- Properties designed for 4 guests and 6 guests dominate the Roana STR market, accounting for 57.5% of listings.
- 40.0% of properties accommodate 6+ guests, serving the market segment for larger families or group travel in Roana.
- On average, properties in Roana are equipped to host 5.0 guests.
Roana Airbnb Booking Patterns (2025): Available vs. Booked Days
Available Days Distribution
Booked Days Distribution
Booking Pattern Insights for Roana
- The most common availability pattern in Roana falls within the 271-366 days range, representing 72.5% of listings. This suggests many properties have significant open periods on their calendars.
- Approximately 90.0% of listings show high availability (181+ days open annually), indicating potential for increased bookings or specific owner usage patterns.
- For booked days, the 31-90 days range is most frequent in Roana (37.5%), reflecting common guest stay durations or potential owner blocking patterns.
- A notable 10.0% of properties secure long booking periods (181+ days booked per year), highlighting successful long-term rental strategies or significant owner usage.
Roana Airbnb Minimum Stay Requirements Analysis
Distribution of Listings by Minimum Night Requirement
1 Night
2 listings
5.4% of total
2 Nights
13 listings
35.1% of total
3 Nights
2 listings
5.4% of total
4-6 Nights
2 listings
5.4% of total
7-29 Nights
11 listings
29.7% of total
30+ Nights
7 listings
18.9% of total
Key Insights
- The most prevalent minimum stay requirement in Roana is 2 Nights, adopted by 35.1% of listings. This highlights the market's preference for shorter, flexible bookings.
- A significant segment (18.9%) caters to monthly stays (30+ nights) in Roana, pointing to opportunities in the extended-stay market.
Recommendations
- Align with the market by considering a 2 Nights minimum stay, as 35.1% of Roana hosts use this setting.
- If feasible, allowing 1-night stays, especially midweek or during low season, could capture last-minute bookings, as only 5.4% currently do.
- A 2-night minimum appears standard (35.1%). Consider this for weekends or peak periods.
- Explore offering discounts for stays of 30+ nights to attract the 18.9% of the market seeking extended stays.
- Adjust minimum nights based on seasonality – potentially shorter during low season and longer during peak demand periods in Roana.
Roana Airbnb Cancellation Policy Trends Analysis (2025)
Flexible
11 listings
33.3% of total
Moderate
13 listings
39.4% of total
Strict
9 listings
27.3% of total
Cancellation Policy Insights for Roana
- The prevailing Airbnb cancellation policy trend in Roana is Moderate, used by 39.4% of listings.
- The market strongly favors guest-friendly terms, with 72.7% of listings offering Flexible or Moderate policies. This suggests guests in Roana may expect booking flexibility.
Recommendations for Hosts
- Consider adopting a Moderate policy to align with the 39.4% market standard in Roana.
- Regularly review your cancellation policy against competitors and market demand shifts in Roana.
Roana STR Booking Lead Time Analysis (2025)
Average Booking Lead Time by Month
Booking Lead Time Insights for Roana
- The overall average booking lead time for vacation rentals in Roana is 55 days.
- Guests book furthest in advance for stays during July (average 92 days), likely coinciding with peak travel demand or local events.
- The shortest booking windows occur for stays in April (average 20 days), indicating more last-minute travel plans during this time.
- Seasonally, Summer (85 days avg.) sees the longest lead times, while Spring (33 days avg.) has the shortest, reflecting typical travel planning cycles.
Recommendations for Hosts
- Use the overall average lead time (55 days) as a baseline for your pricing and availability strategy in Roana.
- For July stays, consider implementing length-of-stay discounts or slightly higher rates for bookings made less than 92 days out to capitalize on advance planning.
- Target marketing efforts for the Summer season well in advance (at least 85 days) to capture early planners.
- Monitor your own booking lead times against these Roana averages to identify opportunities for dynamic pricing adjustments.
Popular & Essential Airbnb Amenities in Roana (2025)
Amenity Prevalence
Amenity Insights for Roana
- Essential amenities in Roana that guests expect include: Kitchen, Heating, TV. Lacking these (any) could significantly impact bookings.
- Popular amenities like Hot water, Essentials, Dishes and silverware are common but not universal. Offering these can provide a competitive edge.
Recommendations for Hosts
- Ensure your listing includes all essential amenities for Roana: Kitchen, Heating, TV.
- Prioritize adding missing essentials: Heating, TV.
- Consider adding popular differentiators like Hot water or Essentials to increase appeal.
- Highlight unique or less common amenities you offer (e.g., hot tub, dedicated workspace, EV charger) in your listing description and photos.
- Regularly check competitor amenities in Roana to stay competitive.
Roana Airbnb Guest Demographics & Profile Analysis (2025)
Guest Profile Summary for Roana
- The typical guest profile for Airbnb in Roana consists of primarily domestic travelers (88%), often arriving from nearby Padua, typically belonging to the Post-2000s (Gen Z/Alpha) group (50%), primarily speaking English or Italian.
- Domestic travelers account for 87.5% of guests.
- Key international markets include Italy (87.5%) and Belgium (1.6%).
- Top languages spoken are English (43.8%) followed by Italian (39.6%).
- A significant demographic segment is the Post-2000s (Gen Z/Alpha) group, representing 50% of guests.
Recommendations for Hosts
- Target domestic marketing efforts towards travelers from Padua and Milan.
- Tailor amenities and listing descriptions to appeal to the dominant Post-2000s (Gen Z/Alpha) demographic (e.g., highlight fast WiFi, smart home features, local guides).
- Highlight unique local experiences or amenities relevant to the primary guest profile.
- Consider seasonal promotions aligned with peak travel times for key origin markets.
Nearby Short-Term Rental Market Comparison
How does the Roana Airbnb market stack up against its neighbors? Compare key performance metrics like average monthly revenue, ADR, and occupancy rates in surrounding areas to understand the broader regional STR landscape.
| Market | Active Properties | Monthly Revenue | Daily Rate | Avg. Occupancy |
|---|---|---|---|---|
| Urtijëi - St. Ulrich in Gröden - Ortisei | 163 | $4,698 | $630.45 | 40% |
| Moos in Passeier - Moso in Passiria | 17 | $4,619 | $547.60 | 27% |
| Brenzone sul Garda | 19 | $4,128 | $335.25 | 52% |
| Cortina d'Ampezzo | 265 | $3,522 | $379.53 | 43% |
| Venice | 6,405 | $3,454 | $238.80 | 53% |
| La Val - Wengen - La Valle | 20 | $3,117 | $503.24 | 36% |
| Luni Mare | 11 | $3,102 | $169.59 | 40% |
| Cazzago San Martino | 14 | $3,018 | $474.20 | 28% |
| Sëlva - Wolkenstein - Selva di Val Gardena | 95 | $2,923 | $414.01 | 42% |
| Colle Santa Lucia | 16 | $2,841 | $187.59 | 47% |