Rivoli Veronese Airbnb Market Analysis 2025: Short Term Rental Data & Vacation Rental Statistics in Veneto, Italy
Is Airbnb profitable in Rivoli Veronese in 2025? Explore comprehensive Airbnb analytics for Rivoli Veronese, Veneto, Italy to uncover income potential. This 2025 STR market report for Rivoli Veronese, based on AirROI data from April 2024 to March 2025, reveals key trends in the niche market of 35 active listings.
Whether you're considering an Airbnb investment in Rivoli Veronese, optimizing your existing vacation rental, or exploring rental arbitrage opportunities, understanding the Rivoli Veronese Airbnb data is crucial. Navigating the high regulation landscape is key to maximizing your short term rental income potential. Let's dive into the specifics.
Key Rivoli Veronese Airbnb Performance Metrics Overview
Monthly Airbnb Revenue Variations & Income Potential in Rivoli Veronese (2025)
Understanding the monthly revenue variations for Airbnb listings in Rivoli Veronese is key to maximizing your short term rental income potential. Seasonality significantly impacts earnings. Our analysis, based on data from the past 12 months, shows that the peak revenue month for STRs in Rivoli Veronese is typically August, while February often presents the lowest earnings, highlighting opportunities for strategic pricing adjustments during shoulder and low seasons. Explore the typical Airbnb income in Rivoli Veronese across different performance tiers:
- Best-in-class properties (Top 10%) achieve $3,144+ monthly, often utilizing dynamic pricing and superior guest experiences.
- Strong performing properties (Top 25%) earn $2,310 or more, indicating effective management and desirable locations/amenities.
- Typical properties (Median) generate around $1,441 per month, representing the average market performance.
- Entry-level properties (Bottom 25%) see earnings around $627, often with potential for optimization.
Average Monthly Airbnb Earnings Trend in Rivoli Veronese
Rivoli Veronese Airbnb Occupancy Rate Trends (2025)
Maximize your bookings by understanding the Rivoli Veronese STR occupancy trends. Seasonal demand shifts significantly influence how often properties are booked. Typically, Augustsees the highest demand (peak season occupancy), while February experiences the lowest (low season). Effective strategies, like adjusting minimum stays or offering promotions, can boost occupancy during slower periods. Here's how different property tiers perform in Rivoli Veronese:
- Best-in-class properties (Top 10%) achieve 57%+ occupancy, indicating high desirability and potentially optimized availability.
- Strong performing properties (Top 25%) maintain 46% or higher occupancy, suggesting good market fit and guest satisfaction.
- Typical properties (Median) have an occupancy rate around 21%.
- Entry-level properties (Bottom 25%) average 10% occupancy, potentially facing higher vacancy.
Average Monthly Occupancy Rate Trend in Rivoli Veronese
Average Daily Rate (ADR) Airbnb Trends in Rivoli Veronese (2025)
Effective short term rental pricing strategy in Rivoli Veronese involves understanding monthly ADR fluctuations. The Average Daily Rate (ADR) for Airbnb in Rivoli Veronese typically peaks in June and dips lowest during March. Leveraging Airbnb dynamic pricing tools or strategies based on this seasonality can significantly boost revenue. Here's a look at the typical nightly rates achieved:
- Best-in-class properties (Top 10%) command rates of $375+ per night, often due to premium features or locations.
- Strong performing properties (Top 25%) achieve nightly rates of $268 or more.
- Typical properties (Median) charge around $155 per night.
- Entry-level properties (Bottom 25%) earn around $121 per night.
Average Daily Rate (ADR) Trend by Month in Rivoli Veronese
Get Live Rivoli Veronese Market Intelligence 👇

Explore Real-time Analytics
Airbnb Seasonality Analysis & Trends in Rivoli Veronese (2025)
Peak Season (August, July, June)
- Revenue averages $3,338 per month
- Occupancy rates average 49.4%
- Daily rates average $237
Shoulder Season
- Revenue averages $1,404 per month
- Occupancy maintains around 26.4%
- Daily rates hold near $207
Low Season (January, February, November)
- Revenue drops to average $379 per month
- Occupancy decreases to average 9.7%
- Daily rates adjust to average $177
Seasonality Insights for Rivoli Veronese
- The Airbnb seasonality in Rivoli Veronese shows highly seasonal trends requiring careful strategy. While the sections above show seasonal averages, it's also insightful to look at the extremes:
- During the high season, the absolute peak month showcases Rivoli Veronese's highest earning potential, with monthly revenues capable of climbing to $3,829, occupancy reaching a high of 55.2%, and ADRs peaking at $237.
- Conversely, the slowest single month of the year, typically falling within the low season, marks the market's lowest point. In this month, revenue might dip to $140, occupancy could drop to 5.1%, and ADRs may adjust down to $173.
- Understanding both the seasonal averages and these monthly peaks and troughs in revenue, occupancy, and ADR is crucial for maximizing your Airbnb profit potential in Rivoli Veronese.
Seasonal Strategies for Maximizing Profit
- Peak Season: Maximize revenue through premium pricing and potentially longer minimum stays. Ensure high availability.
- Low Season: Offer competitive pricing, special promotions (e.g., extended stay discounts), and flexible cancellation policies. Target off-season travelers like remote workers or budget-conscious guests.
- Shoulder Seasons: Implement dynamic pricing that balances peak and low rates. Target weekend travelers or specific events. Offer slightly more flexible terms than peak season.
- Regularly analyze your own performance against these Rivoli Veronese seasonality benchmarks and adjust your pricing and availability strategy accordingly.
Best Areas for Airbnb Investment in Rivoli Veronese (2025)
Exploring the top neighborhoods for short-term rentals in Rivoli Veronese? This section highlights key areas, outlining why they are attractive for hosts and guests, along with notable local attractions. Consider these locations based on your target guest profile and investment strategy.
| Neighborhood / Area | Why Host Here? (Target Guests & Appeal) | Key Attractions & Landmarks |
|---|---|---|
| Rivoli Veronese Historic Center | Charming historic area with picturesque streets and local shops. Perfect for visitors looking to experience the authentic Italian culture and architecture. | Castello di Rivoli, Chiesa di San Giovanni Battista, Piazza della Libertà, Museo dell'Agricoltura, Local wine cellars |
| Bardolino | Famous for its lakeside promenade and wine production, Bardolino attracts tourists looking for relaxation and local cuisine. Close proximity to Lake Garda adds to its appeal. | Lago di Garda, Bardolino Wine Museum, Bardolino Beach, Church of San Zeno, Local wine festivals |
| San Zeno di Montagna | Ideal for nature lovers and outdoor activities, this area offers stunning views and hiking opportunities. Attracts families and adventure seekers alike. | Monte Belpo, Hiking trails, Local farms and wineries, Natural parks, Scenic viewpoints |
| Torri del Benaco | Beautiful lakeside town known for its historic castle and stunning views of Lake Garda, attracting both tourists and local events throughout the year. | Castello di Torri, Lago di Garda, Local markets, Hiking paths, Beach access |
| Garda | Another lakeside gem, Garda offers a vibrant atmosphere with plenty of restaurants and shops, as well as access to various water activities. | Garda Town Beach, Botanical Garden of André Heller, Garda Island, Local restaurants, Water sports activities |
| Malcesine | Famous for the Monte Baldo cable car and historic castle, Malcesine is a picturesque town that attracts both adventure enthusiasts and history buffs. | Castello Scaligero, Monte Baldo Cable Car, Lakeside promenade, Local hiking routes, Shopping in historic town center |
| Peschiera del Garda | A lively town with rich history and access to multiple theme parks and attractions, making it perfect for families and tourists. | Peschiera del Garda Fortress, Parco Natura Viva, Gardaland Theme Park, Beach areas, Local markets |
| Fumane | Nestled in the vineyards of Valpolicella, Fumane is perfect for wine tourism and visitors interested in tasting some of Italy's finest wines. | Valpolicella Wine Route, Local wineries, Hiking in vineyards, Historical sites, Natural beauty spots |
Understanding Airbnb License Requirements & STR Laws in Rivoli Veronese (2025)
Yes, Rivoli Veronese, Veneto, Italy enforces high STR regulations. Obtaining a license and ensuring compliance is almost certainly required according to current 2025 STR laws. Always verify the latest short term rental regulations and Airbnb license requirements directly with local government authorities for Rivoli Veronese to ensure full compliance before hosting.
(Source: AirROI data, 2025, based on 49% licensed listings)
Top Performing Airbnb Properties in Rivoli Veronese (2025)
Benchmark your potential! Explore examples of top-performing Airbnb properties in Rivoli Veronesebased on Trailing Twelve Month (TTM) revenue. Analyze their characteristics, revenue, occupancy rate, and ADR to understand what drives success in this market.

VillaFamily. 8/ospiti
Entire Place • 4 bedrooms
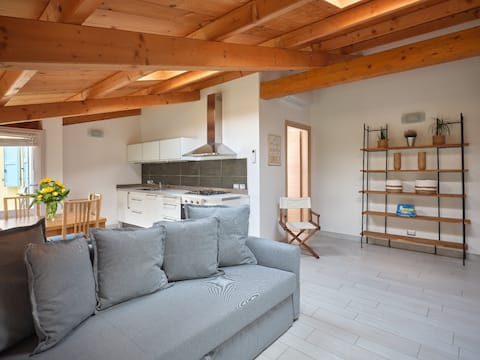
Charming house in the vineyard - Gigi
Entire Place • 2 bedrooms

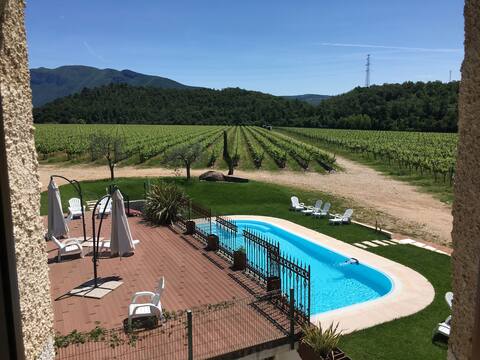
Cason degli Ulivi "Classic"
Entire Place • 3 bedrooms
Cason degli Ulivi "Mia"
Entire Place • 1 bedroom
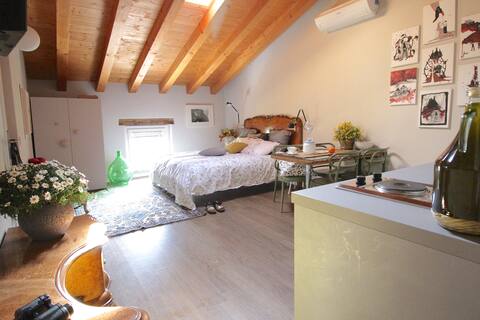
Romantic studio in the vineyards - Tullio
Entire Place • N/A
Ancient farmhouse in a wide vineyard - Richetto
Entire Place • 1 bedroom
Note: Performance varies based on location, size, amenities, seasonality, and management quality. Data reflects the past 12 months.
Top Performing Airbnb Hosts in Rivoli Veronese (2025)
Learn from the best! This table showcases top-performing Airbnb hosts in Rivoli Veronese based on the number of properties managed and estimated total revenue over the past year. Analyze their scale and performance metrics.
| Host Name | Properties | Grossing Revenue | Stay Reviews | Avg Rating |
|---|---|---|---|---|
| Corte | 7 | $121,549 | 403 | 4.87/5.0 |
| Host #253232333 | 3 | $77,806 | 52 | 3.19/5.0 |
| Sabrina | 6 | $63,552 | 128 | 4.88/5.0 |
| Manuela | 4 | $58,712 | 46 | 3.64/5.0 |
| Fabio E Marisa | 4 | $45,806 | 181 | 4.96/5.0 |
| Gabriele | 4 | $18,296 | 27 | 4.71/5.0 |
| Host #197925011 | 1 | $14,729 | 0 | 0.00/5.0 |
| Samantha | 1 | $14,200 | 49 | 4.88/5.0 |
| Simone | 2 | $14,162 | 23 | 2.37/5.0 |
| Nikolett | 1 | $8,472 | 3 | 5.00/5.0 |
Analyzing the strategies of top hosts, such as their property selection, pricing, and guest communication, can offer valuable lessons for optimizing your own Airbnb operations in Rivoli Veronese.
Dive Deeper: Advanced Rivoli Veronese STR Market Data (2025)
Ready to unlock more insights? AirROI provides access to advanced metrics and comprehensive Airbnb data for Rivoli Veronese. Explore detailed analytics beyond this report to refine your investment strategy, optimize pricing, and maximize your vacation rental profits.
Explore Advanced MetricsRivoli Veronese Short-Term Rental Market Composition (2025): Property & Room Types
Room Type Distribution
Property Type Distribution
Market Composition Insights for Rivoli Veronese
- The Rivoli Veronese Airbnb market composition is heavily skewed towards Entire Home/Apt listings, which make up 91.4% of the 35 active rentals. This indicates strong guest preference for privacy and space.
- Looking at the property type distribution in Rivoli Veronese, Outdoor/Unique properties are the most common (37.1%), reflecting the local real estate landscape.
- Houses represent a significant 31.4% portion, catering likely to families or larger groups.
Rivoli Veronese Airbnb Room Capacity Analysis (2025): Bedroom Distribution
Distribution of Listings by Number of Bedrooms
Room Capacity Insights for Rivoli Veronese
- The dominant room capacity in Rivoli Veronese is 1 bedroom listings, making up 37.1% of the market. This suggests a strong demand for properties suitable for couples or solo travelers.
- Together, 1 bedroom and 2 bedrooms properties represent 54.2% of the active Airbnb listings in Rivoli Veronese, indicating a high concentration in these sizes.
- A significant 28.6% of listings offer 3+ bedrooms, catering to larger groups and families seeking more space in Rivoli Veronese.
Rivoli Veronese Vacation Rental Guest Capacity Trends (2025)
Distribution of Listings by Guest Capacity
Guest Capacity Insights for Rivoli Veronese
- The most common guest capacity trend in Rivoli Veronese vacation rentals is listings accommodating 4 guests (28.6%). This suggests the primary traveler segment is likely small families or groups.
- Properties designed for 4 guests and 8+ guests dominate the Rivoli Veronese STR market, accounting for 48.6% of listings.
- 37.2% of properties accommodate 6+ guests, serving the market segment for larger families or group travel in Rivoli Veronese.
- On average, properties in Rivoli Veronese are equipped to host 4.7 guests.
Rivoli Veronese Airbnb Booking Patterns (2025): Available vs. Booked Days
Available Days Distribution
Booked Days Distribution
Booking Pattern Insights for Rivoli Veronese
- The most common availability pattern in Rivoli Veronese falls within the 271-366 days range, representing 65.7% of listings. This suggests many properties have significant open periods on their calendars.
- Approximately 100.0% of listings show high availability (181+ days open annually), indicating potential for increased bookings or specific owner usage patterns.
- For booked days, the 1-30 days range is most frequent in Rivoli Veronese (37.1%), reflecting common guest stay durations or potential owner blocking patterns.
Rivoli Veronese Airbnb Minimum Stay Requirements Analysis
Distribution of Listings by Minimum Night Requirement
1 Night
8 listings
25% of total
2 Nights
12 listings
37.5% of total
3 Nights
6 listings
18.8% of total
7-29 Nights
3 listings
9.4% of total
30+ Nights
3 listings
9.4% of total
Key Insights
- The most prevalent minimum stay requirement in Rivoli Veronese is 2 Nights, adopted by 37.5% of listings. This highlights the market's preference for shorter, flexible bookings.
- A strong majority (62.5%) of the Rivoli Veronese Airbnb data shows acceptance of very short stays (1-2 nights), indicating a dynamic, high-turnover market.
Recommendations
- Align with the market by considering a 2 Nights minimum stay, as 37.5% of Rivoli Veronese hosts use this setting.
- If feasible, allowing 1-night stays, especially midweek or during low season, could capture last-minute bookings, as only 25% currently do.
- Explore offering discounts for stays of 30+ nights to attract the 9.4% of the market seeking extended stays.
- Adjust minimum nights based on seasonality – potentially shorter during low season and longer during peak demand periods in Rivoli Veronese.
Rivoli Veronese Airbnb Cancellation Policy Trends Analysis (2025)
Flexible
7 listings
25% of total
Moderate
16 listings
57.1% of total
Strict
5 listings
17.9% of total
Cancellation Policy Insights for Rivoli Veronese
- The prevailing Airbnb cancellation policy trend in Rivoli Veronese is Moderate, used by 57.1% of listings.
- The market strongly favors guest-friendly terms, with 82.1% of listings offering Flexible or Moderate policies. This suggests guests in Rivoli Veronese may expect booking flexibility.
Recommendations for Hosts
- Consider adopting a Moderate policy to align with the 57.1% market standard in Rivoli Veronese.
- Regularly review your cancellation policy against competitors and market demand shifts in Rivoli Veronese.
Rivoli Veronese STR Booking Lead Time Analysis (2025)
Average Booking Lead Time by Month
Booking Lead Time Insights for Rivoli Veronese
- The overall average booking lead time for vacation rentals in Rivoli Veronese is 69 days.
- Guests book furthest in advance for stays during July (average 123 days), likely coinciding with peak travel demand or local events.
- The shortest booking windows occur for stays in February (average 7 days), indicating more last-minute travel plans during this time.
- Seasonally, Summer (101 days avg.) sees the longest lead times, while Winter (15 days avg.) has the shortest, reflecting typical travel planning cycles.
Recommendations for Hosts
- Use the overall average lead time (69 days) as a baseline for your pricing and availability strategy in Rivoli Veronese.
- For July stays, consider implementing length-of-stay discounts or slightly higher rates for bookings made less than 123 days out to capitalize on advance planning.
- During February, focus on last-minute booking availability and promotions, as guests book with very short notice (7 days avg.).
- Target marketing efforts for the Summer season well in advance (at least 101 days) to capture early planners.
- Monitor your own booking lead times against these Rivoli Veronese averages to identify opportunities for dynamic pricing adjustments.
Popular & Essential Airbnb Amenities in Rivoli Veronese (2025)
Amenity Prevalence
Amenity Insights for Rivoli Veronese
- Essential amenities in Rivoli Veronese that guests expect include: Heating, Wifi, Hot water, Essentials, Free parking on premises. Lacking these (any) could significantly impact bookings.
- Popular amenities like Backyard, Kitchen, Refrigerator are common but not universal. Offering these can provide a competitive edge.
Recommendations for Hosts
- Ensure your listing includes all essential amenities for Rivoli Veronese: Heating, Wifi, Hot water, Essentials, Free parking on premises.
- Prioritize adding missing essentials: Hot water, Essentials, Free parking on premises.
- Consider adding popular differentiators like Backyard or Kitchen to increase appeal.
- Highlight unique or less common amenities you offer (e.g., hot tub, dedicated workspace, EV charger) in your listing description and photos.
- Regularly check competitor amenities in Rivoli Veronese to stay competitive.
Rivoli Veronese Airbnb Guest Demographics & Profile Analysis (2025)
Guest Profile Summary for Rivoli Veronese
- The typical guest profile for Airbnb in Rivoli Veronese consists of predominantly international visitors (97%), with top international origins including France, typically belonging to the Post-2000s (Gen Z/Alpha) group (50%), primarily speaking English or German.
- Domestic travelers account for 3.3% of guests.
- Key international markets include Germany (42.2%) and France (11.1%).
- Top languages spoken are English (42.6%) followed by German (24.1%).
- A significant demographic segment is the Post-2000s (Gen Z/Alpha) group, representing 50% of guests.
Recommendations for Hosts
- Focus marketing internationally, particularly towards travelers from France.
- Tailor amenities and listing descriptions to appeal to the dominant Post-2000s (Gen Z/Alpha) demographic (e.g., highlight fast WiFi, smart home features, local guides).
- Highlight unique local experiences or amenities relevant to the primary guest profile.
- Consider seasonal promotions aligned with peak travel times for key origin markets.
Nearby Short-Term Rental Market Comparison
How does the Rivoli Veronese Airbnb market stack up against its neighbors? Compare key performance metrics like average monthly revenue, ADR, and occupancy rates in surrounding areas to understand the broader regional STR landscape.
| Market | Active Properties | Monthly Revenue | Daily Rate | Avg. Occupancy |
|---|---|---|---|---|
| Laglio | 64 | $4,873 | $463.61 | 47% |
| Urtijëi - St. Ulrich in Gröden - Ortisei | 163 | $4,698 | $630.45 | 40% |
| Moos in Passeier - Moso in Passiria | 17 | $4,619 | $547.60 | 27% |
| Brenzone sul Garda | 19 | $4,128 | $335.25 | 52% |
| Portofino | 68 | $4,086 | $454.35 | 44% |
| Sala Comacina | 64 | $3,794 | $400.27 | 50% |
| Bellagio | 373 | $3,630 | $328.26 | 55% |
| Oliveto Lario | 99 | $3,509 | $327.42 | 55% |
| Varenna | 216 | $3,419 | $272.27 | 56% |
| Carate Urio | 71 | $3,379 | $331.90 | 44% |