Livinallongo del Col di Lana Airbnb Market Analysis 2025: Short Term Rental Data & Vacation Rental Statistics in Veneto, Italy
Is Airbnb profitable in Livinallongo del Col di Lana in 2025? Explore comprehensive Airbnb analytics for Livinallongo del Col di Lana, Veneto, Italy to uncover income potential. This 2025 STR market report for Livinallongo del Col di Lana, based on AirROI data from April 2024 to March 2025, reveals key trends in the niche market of 20 active listings.
Whether you're considering an Airbnb investment in Livinallongo del Col di Lana, optimizing your existing vacation rental, or exploring rental arbitrage opportunities, understanding the Livinallongo del Col di Lana Airbnb data is crucial. Navigating the high regulation landscape is key to maximizing your short term rental income potential. Let's dive into the specifics.
Key Livinallongo del Col di Lana Airbnb Performance Metrics Overview
Monthly Airbnb Revenue Variations & Income Potential in Livinallongo del Col di Lana (2025)
Understanding the monthly revenue variations for Airbnb listings in Livinallongo del Col di Lana is key to maximizing your short term rental income potential. Seasonality significantly impacts earnings. Our analysis, based on data from the past 12 months, shows that the peak revenue month for STRs in Livinallongo del Col di Lana is typically February, while April often presents the lowest earnings, highlighting opportunities for strategic pricing adjustments during shoulder and low seasons. Explore the typical Airbnb income in Livinallongo del Col di Lana across different performance tiers:
- Best-in-class properties (Top 10%) achieve $6,664+ monthly, often utilizing dynamic pricing and superior guest experiences.
- Strong performing properties (Top 25%) earn $4,976 or more, indicating effective management and desirable locations/amenities.
- Typical properties (Median) generate around $2,623 per month, representing the average market performance.
- Entry-level properties (Bottom 25%) see earnings around $1,518, often with potential for optimization.
Average Monthly Airbnb Earnings Trend in Livinallongo del Col di Lana
Livinallongo del Col di Lana Airbnb Occupancy Rate Trends (2025)
Maximize your bookings by understanding the Livinallongo del Col di Lana STR occupancy trends. Seasonal demand shifts significantly influence how often properties are booked. Typically, Augustsees the highest demand (peak season occupancy), while April experiences the lowest (low season). Effective strategies, like adjusting minimum stays or offering promotions, can boost occupancy during slower periods. Here's how different property tiers perform in Livinallongo del Col di Lana:
- Best-in-class properties (Top 10%) achieve 68%+ occupancy, indicating high desirability and potentially optimized availability.
- Strong performing properties (Top 25%) maintain 52% or higher occupancy, suggesting good market fit and guest satisfaction.
- Typical properties (Median) have an occupancy rate around 38%.
- Entry-level properties (Bottom 25%) average 22% occupancy, potentially facing higher vacancy.
Average Monthly Occupancy Rate Trend in Livinallongo del Col di Lana
Average Daily Rate (ADR) Airbnb Trends in Livinallongo del Col di Lana (2025)
Effective short term rental pricing strategy in Livinallongo del Col di Lana involves understanding monthly ADR fluctuations. The Average Daily Rate (ADR) for Airbnb in Livinallongo del Col di Lana typically peaks in February and dips lowest during September. Leveraging Airbnb dynamic pricing tools or strategies based on this seasonality can significantly boost revenue. Here's a look at the typical nightly rates achieved:
- Best-in-class properties (Top 10%) command rates of $382+ per night, often due to premium features or locations.
- Strong performing properties (Top 25%) achieve nightly rates of $321 or more.
- Typical properties (Median) charge around $248 per night.
- Entry-level properties (Bottom 25%) earn around $158 per night.
Average Daily Rate (ADR) Trend by Month in Livinallongo del Col di Lana
Get Live Livinallongo del Col di Lana Market Intelligence 👇

Explore Real-time Analytics
Airbnb Seasonality Analysis & Trends in Livinallongo del Col di Lana (2025)
Peak Season (February, August, July)
- Revenue averages $5,237 per month
- Occupancy rates average 62.4%
- Daily rates average $258
Shoulder Season
- Revenue averages $3,328 per month
- Occupancy maintains around 33.9%
- Daily rates hold near $256
Low Season (April, May, September)
- Revenue drops to average $1,665 per month
- Occupancy decreases to average 25.1%
- Daily rates adjust to average $230
Seasonality Insights for Livinallongo del Col di Lana
- The Airbnb seasonality in Livinallongo del Col di Lana shows highly seasonal trends requiring careful strategy. While the sections above show seasonal averages, it's also insightful to look at the extremes:
- During the high season, the absolute peak month showcases Livinallongo del Col di Lana's highest earning potential, with monthly revenues capable of climbing to $6,125, occupancy reaching a high of 65.8%, and ADRs peaking at $289.
- Conversely, the slowest single month of the year, typically falling within the low season, marks the market's lowest point. In this month, revenue might dip to $882, occupancy could drop to 12.9%, and ADRs may adjust down to $224.
- Understanding both the seasonal averages and these monthly peaks and troughs in revenue, occupancy, and ADR is crucial for maximizing your Airbnb profit potential in Livinallongo del Col di Lana.
Seasonal Strategies for Maximizing Profit
- Peak Season: Maximize revenue through premium pricing and potentially longer minimum stays. Ensure high availability.
- Low Season: Offer competitive pricing, special promotions (e.g., extended stay discounts), and flexible cancellation policies. Target off-season travelers like remote workers or budget-conscious guests.
- Shoulder Seasons: Implement dynamic pricing that balances peak and low rates. Target weekend travelers or specific events. Offer slightly more flexible terms than peak season.
- Regularly analyze your own performance against these Livinallongo del Col di Lana seasonality benchmarks and adjust your pricing and availability strategy accordingly.
Best Areas for Airbnb Investment in Livinallongo del Col di Lana (2025)
Exploring the top neighborhoods for short-term rentals in Livinallongo del Col di Lana? This section highlights key areas, outlining why they are attractive for hosts and guests, along with notable local attractions. Consider these locations based on your target guest profile and investment strategy.
| Neighborhood / Area | Why Host Here? (Target Guests & Appeal) | Key Attractions & Landmarks |
|---|---|---|
| Passo Gardena | A stunning mountain pass with breathtaking views, ideal for ski enthusiasts and hiking lovers. Attracts tourists year-round for its outdoor activities. | Gardena Pass, Skiing in winter, Hiking trails, Scenic viewpoints, Local Alpine huts |
| Corvara in Badia | A beautiful village in the Dolomites, famous for its skiing and hiking opportunities. Popular among families and outdoor enthusiasts. | Corvara ski resort, Lagazuoi cable car, St. Catherine's Church, Dolomiti Superski, Local restaurants |
| Arabba | A charming alpine village known for its proximity to ski slopes and stunning scenery, attracts winter sports fans and summer hikers alike. | Arabba ski lifts, Porta Vescovo, Mountain biking trails, Local Alpine culture, Dining options |
| Livinallongo del Col di Lana | A lesser-known gem in the Dolomites offering a unique blend of nature and culture, perfect for tranquility seekers and nature lovers. | Col di Lana mountain, Historic World War I sites, Natural parks, Hiking paths, Local cuisine |
| Val di Fassa | A scenic valley surrounded by majestic mountains, ideal for family vacations and outdoor activities year-round, popular among tourists. | Fassa Valley ski resorts, Local folklore events, Traditional Ladin villages, Hiking and biking paths, Culinary delights |
| Marmolada | Renowned for the highest peak in the Dolomites and summer glacier skiing, it attracts adventure seekers and scenery lovers alike. | Marmolada Glacier, Skiing and snowboarding, Climbing routes, Hiking trails, Spectacular views |
| San Cassiano | A picturesque village with a blend of luxury and Italian charm, attracting visitors looking for a serene and upscale vacation experience. | San Cassiano ski resort, Wellness centers, Gourmet restaurants, Local crafts, Scenic routes |
| Pieve di Livinallongo | A quaint mountain village that offers authentic local experiences and access to beautiful landscapes, perfect for explorers. | Historical landmarks, Mountain trails, Cultural events, Small local shops, Peaceful environment |
Understanding Airbnb License Requirements & STR Laws in Livinallongo del Col di Lana (2025)
Yes, Livinallongo del Col di Lana, Veneto, Italy enforces high STR regulations. Obtaining a license and ensuring compliance is almost certainly required according to current 2025 STR laws. Always verify the latest short term rental regulations and Airbnb license requirements directly with local government authorities for Livinallongo del Col di Lana to ensure full compliance before hosting.
(Source: AirROI data, 2025, based on 75% licensed listings)
Top Performing Airbnb Properties in Livinallongo del Col di Lana (2025)
Benchmark your potential! Explore examples of top-performing Airbnb properties in Livinallongo del Col di Lanabased on Trailing Twelve Month (TTM) revenue. Analyze their characteristics, revenue, occupancy rate, and ADR to understand what drives success in this market.
Jardì Val Fodom - Charming three-room apartment with a view
Entire Place • 2 bedrooms
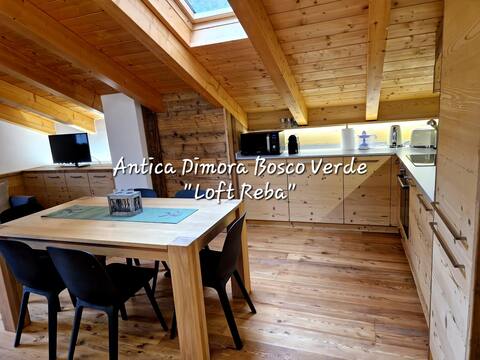
Beautiful Loft in the Dolomites
Entire Place • 2 bedrooms
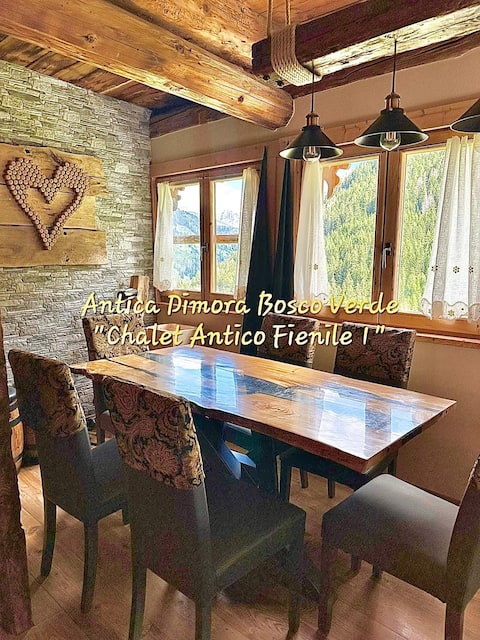
Ancient Barn Chalet 1
Entire Place • 2 bedrooms
Arabba - Al Vecio Soler
Entire Place • 2 bedrooms
Chalet Antico Fienile 2
Entire Place • 2 bedrooms

El Cerf Loft
Entire Place • 2 bedrooms
Note: Performance varies based on location, size, amenities, seasonality, and management quality. Data reflects the past 12 months.
Top Performing Airbnb Hosts in Livinallongo del Col di Lana (2025)
Learn from the best! This table showcases top-performing Airbnb hosts in Livinallongo del Col di Lana based on the number of properties managed and estimated total revenue over the past year. Analyze their scale and performance metrics.
| Host Name | Properties | Grossing Revenue | Stay Reviews | Avg Rating |
|---|---|---|---|---|
| Dolomitissime S.R.L. | 4 | $121,256 | 9 | 2.19/5.0 |
| Antica Dimora | 3 | $101,897 | 39 | 4.95/5.0 |
| Giulia | 1 | $54,710 | 5 | 5.00/5.0 |
| Annalisa | 1 | $54,140 | 11 | 5.00/5.0 |
| Giovanni | 1 | $46,392 | 6 | 4.83/5.0 |
| Bruno | 1 | $28,422 | 4 | 4.75/5.0 |
| Jasmine | 2 | $28,263 | 56 | 4.78/5.0 |
| Francesca | 1 | $26,162 | 7 | 4.86/5.0 |
| Marzia | 1 | $23,218 | 4 | 5.00/5.0 |
| Sandro | 1 | $22,015 | 59 | 4.80/5.0 |
Analyzing the strategies of top hosts, such as their property selection, pricing, and guest communication, can offer valuable lessons for optimizing your own Airbnb operations in Livinallongo del Col di Lana.
Dive Deeper: Advanced Livinallongo del Col di Lana STR Market Data (2025)
Ready to unlock more insights? AirROI provides access to advanced metrics and comprehensive Airbnb data for Livinallongo del Col di Lana. Explore detailed analytics beyond this report to refine your investment strategy, optimize pricing, and maximize your vacation rental profits.
Explore Advanced MetricsLivinallongo del Col di Lana Short-Term Rental Market Composition (2025): Property & Room Types
Room Type Distribution
Property Type Distribution
Market Composition Insights for Livinallongo del Col di Lana
- The Livinallongo del Col di Lana Airbnb market composition is heavily skewed towards Entire Home/Apt listings, which make up 100% of the 20 active rentals. This indicates strong guest preference for privacy and space.
- Looking at the property type distribution in Livinallongo del Col di Lana, Apartment/Condo properties are the most common (85%), reflecting the local real estate landscape.
Livinallongo del Col di Lana Airbnb Room Capacity Analysis (2025): Bedroom Distribution
Distribution of Listings by Number of Bedrooms
Room Capacity Insights for Livinallongo del Col di Lana
- The dominant room capacity in Livinallongo del Col di Lana is 2 bedrooms listings, making up 75% of the market. This suggests a strong demand for properties suitable for couples or solo travelers.
- Together, 2 bedrooms and 3 bedrooms properties represent 90.0% of the active Airbnb listings in Livinallongo del Col di Lana, indicating a high concentration in these sizes.
Livinallongo del Col di Lana Vacation Rental Guest Capacity Trends (2025)
Distribution of Listings by Guest Capacity
Guest Capacity Insights for Livinallongo del Col di Lana
- The most common guest capacity trend in Livinallongo del Col di Lana vacation rentals is listings accommodating 4 guests (35%). This suggests the primary traveler segment is likely small families or groups.
- Properties designed for 4 guests and 6 guests dominate the Livinallongo del Col di Lana STR market, accounting for 65.0% of listings.
- 50.0% of properties accommodate 6+ guests, serving the market segment for larger families or group travel in Livinallongo del Col di Lana.
- On average, properties in Livinallongo del Col di Lana are equipped to host 5.4 guests.
Livinallongo del Col di Lana Airbnb Booking Patterns (2025): Available vs. Booked Days
Available Days Distribution
Booked Days Distribution
Booking Pattern Insights for Livinallongo del Col di Lana
- The most common availability pattern in Livinallongo del Col di Lana falls within the 181-270 days range, representing 50% of listings. This suggests many properties have significant open periods on their calendars.
- Approximately 95.0% of listings show high availability (181+ days open annually), indicating potential for increased bookings or specific owner usage patterns.
- For booked days, the 91-180 days range is most frequent in Livinallongo del Col di Lana (45%), reflecting common guest stay durations or potential owner blocking patterns.
- A notable 10.0% of properties secure long booking periods (181+ days booked per year), highlighting successful long-term rental strategies or significant owner usage.
Livinallongo del Col di Lana Airbnb Minimum Stay Requirements Analysis
Distribution of Listings by Minimum Night Requirement
1 Night
1 listings
5% of total
2 Nights
2 listings
10% of total
3 Nights
1 listings
5% of total
4-6 Nights
6 listings
30% of total
7-29 Nights
3 listings
15% of total
30+ Nights
7 listings
35% of total
Key Insights
- The most prevalent minimum stay requirement in Livinallongo del Col di Lana is 30+ Nights, adopted by 35% of listings. This highlights the market's preference for longer commitments.
- Very short stays (1-2 nights) are less common (15.0%), suggesting hosts prefer slightly longer bookings to optimize turnover.
- A significant segment (35%) caters to monthly stays (30+ nights) in Livinallongo del Col di Lana, pointing to opportunities in the extended-stay market.
Recommendations
- Align with the market by considering a 30+ Nights minimum stay, as 35% of Livinallongo del Col di Lana hosts use this setting.
- If feasible, allowing 1-night stays, especially midweek or during low season, could capture last-minute bookings, as only 5% currently do.
- Explore offering discounts for stays of 30+ nights to attract the 35% of the market seeking extended stays.
- Adjust minimum nights based on seasonality – potentially shorter during low season and longer during peak demand periods in Livinallongo del Col di Lana.
Livinallongo del Col di Lana Airbnb Cancellation Policy Trends Analysis (2025)
Super Strict 30 Days
3 listings
16.7% of total
Moderate
6 listings
33.3% of total
Strict
9 listings
50% of total
Cancellation Policy Insights for Livinallongo del Col di Lana
- The prevailing Airbnb cancellation policy trend in Livinallongo del Col di Lana is Strict, used by 50% of listings.
- There's a relatively balanced mix between guest-friendly (33.3%) and stricter (50.0%) policies, offering choices for different guest needs.
Recommendations for Hosts
- Consider adopting a Strict policy to align with the 50% market standard in Livinallongo del Col di Lana.
- With 50% using Strict terms, this is a viable option in Livinallongo del Col di Lana, particularly for high-value properties or during peak demand periods.
- Regularly review your cancellation policy against competitors and market demand shifts in Livinallongo del Col di Lana.
Livinallongo del Col di Lana STR Booking Lead Time Analysis (2025)
Average Booking Lead Time by Month
Booking Lead Time Insights for Livinallongo del Col di Lana
- The overall average booking lead time for vacation rentals in Livinallongo del Col di Lana is 47 days.
- Guests book furthest in advance for stays during October (average 92 days), likely coinciding with peak travel demand or local events.
- The shortest booking windows occur for stays in September (average 35 days), indicating more last-minute travel plans during this time.
- Seasonally, Fall (65 days avg.) sees the longest lead times, while Summer (55 days avg.) has the shortest, reflecting typical travel planning cycles.
Recommendations for Hosts
- Use the overall average lead time (47 days) as a baseline for your pricing and availability strategy in Livinallongo del Col di Lana.
- For October stays, consider implementing length-of-stay discounts or slightly higher rates for bookings made less than 92 days out to capitalize on advance planning.
- Target marketing efforts for the Fall season well in advance (at least 65 days) to capture early planners.
- Monitor your own booking lead times against these Livinallongo del Col di Lana averages to identify opportunities for dynamic pricing adjustments.
Popular & Essential Airbnb Amenities in Livinallongo del Col di Lana (2025)
Amenity Prevalence
Amenity Insights for Livinallongo del Col di Lana
- Essential amenities in Livinallongo del Col di Lana that guests expect include: Heating, Free parking on premises, Dishes and silverware, Cooking basics, TV, Kitchen. Lacking these (any) could significantly impact bookings.
- Popular amenities like Hair dryer, Wifi, Hot water are common but not universal. Offering these can provide a competitive edge.
- Warning: Wifi is not universally provided but is considered essential globally. Ensure reliable Wifi is offered.
Recommendations for Hosts
- Ensure your listing includes all essential amenities for Livinallongo del Col di Lana: Heating, Free parking on premises, Dishes and silverware, Cooking basics, TV, Kitchen.
- Prioritize adding missing essentials: Dishes and silverware, Cooking basics, TV, Kitchen.
- Consider adding popular differentiators like Hair dryer or Wifi to increase appeal.
- Highlight unique or less common amenities you offer (e.g., hot tub, dedicated workspace, EV charger) in your listing description and photos.
- Regularly check competitor amenities in Livinallongo del Col di Lana to stay competitive.
Livinallongo del Col di Lana Airbnb Guest Demographics & Profile Analysis (2025)
Guest Profile Summary for Livinallongo del Col di Lana
- The typical guest profile for Airbnb in Livinallongo del Col di Lana consists of predominantly international visitors (84%), with top international origins including United Kingdom, typically belonging to the Post-2000s (Gen Z/Alpha) group (50%), primarily speaking English or Italian.
- Domestic travelers account for 16.0% of guests.
- Key international markets include Italy (16%) and United Kingdom (16%).
- Top languages spoken are English (45.2%) followed by Italian (11.9%).
- A significant demographic segment is the Post-2000s (Gen Z/Alpha) group, representing 50% of guests.
Recommendations for Hosts
- Focus marketing internationally, particularly towards travelers from United Kingdom.
- Tailor amenities and listing descriptions to appeal to the dominant Post-2000s (Gen Z/Alpha) demographic (e.g., highlight fast WiFi, smart home features, local guides).
- Highlight unique local experiences or amenities relevant to the primary guest profile.
- Consider seasonal promotions aligned with peak travel times for key origin markets.
Nearby Short-Term Rental Market Comparison
How does the Livinallongo del Col di Lana Airbnb market stack up against its neighbors? Compare key performance metrics like average monthly revenue, ADR, and occupancy rates in surrounding areas to understand the broader regional STR landscape.
| Market | Active Properties | Monthly Revenue | Daily Rate | Avg. Occupancy |
|---|---|---|---|---|
| Bayrischzell | 30 | $4,718 | $392.87 | 42% |
| Urtijëi - St. Ulrich in Gröden - Ortisei | 163 | $4,698 | $630.45 | 40% |
| Moos in Passeier - Moso in Passiria | 17 | $4,619 | $547.60 | 27% |
| Steinberg am Rofan | 11 | $4,394 | $311.71 | 40% |
| Brenzone sul Garda | 19 | $4,128 | $335.25 | 52% |
| Reith bei Kitzbühel | 44 | $3,766 | $308.69 | 45% |
| Pfafflar | 10 | $3,559 | $263.32 | 58% |
| Cortina d'Ampezzo | 265 | $3,522 | $379.53 | 43% |
| Venice | 6,405 | $3,454 | $238.80 | 53% |
| Wiesing | 16 | $3,222 | $208.10 | 52% |