Feltre Airbnb Market Analysis 2025: Short Term Rental Data & Vacation Rental Statistics in Veneto, Italy
Is Airbnb profitable in Feltre in 2025? Explore comprehensive Airbnb analytics for Feltre, Veneto, Italy to uncover income potential. This 2025 STR market report for Feltre, based on AirROI data from April 2024 to March 2025, reveals key trends in the niche market of 40 active listings.
Whether you're considering an Airbnb investment in Feltre, optimizing your existing vacation rental, or exploring rental arbitrage opportunities, understanding the Feltre Airbnb data is crucial. Navigating the high regulation landscape is key to maximizing your short term rental income potential. Let's dive into the specifics.
Key Feltre Airbnb Performance Metrics Overview
Monthly Airbnb Revenue Variations & Income Potential in Feltre (2025)
Understanding the monthly revenue variations for Airbnb listings in Feltre is key to maximizing your short term rental income potential. Seasonality significantly impacts earnings. Our analysis, based on data from the past 12 months, shows that the peak revenue month for STRs in Feltre is typically August, while March often presents the lowest earnings, highlighting opportunities for strategic pricing adjustments during shoulder and low seasons. Explore the typical Airbnb income in Feltre across different performance tiers:
- Best-in-class properties (Top 10%) achieve $3,682+ monthly, often utilizing dynamic pricing and superior guest experiences.
- Strong performing properties (Top 25%) earn $1,898 or more, indicating effective management and desirable locations/amenities.
- Typical properties (Median) generate around $998 per month, representing the average market performance.
- Entry-level properties (Bottom 25%) see earnings around $455, often with potential for optimization.
Average Monthly Airbnb Earnings Trend in Feltre
Feltre Airbnb Occupancy Rate Trends (2025)
Maximize your bookings by understanding the Feltre STR occupancy trends. Seasonal demand shifts significantly influence how often properties are booked. Typically, Augustsees the highest demand (peak season occupancy), while January experiences the lowest (low season). Effective strategies, like adjusting minimum stays or offering promotions, can boost occupancy during slower periods. Here's how different property tiers perform in Feltre:
- Best-in-class properties (Top 10%) achieve 75%+ occupancy, indicating high desirability and potentially optimized availability.
- Strong performing properties (Top 25%) maintain 53% or higher occupancy, suggesting good market fit and guest satisfaction.
- Typical properties (Median) have an occupancy rate around 30%.
- Entry-level properties (Bottom 25%) average 13% occupancy, potentially facing higher vacancy.
Average Monthly Occupancy Rate Trend in Feltre
Average Daily Rate (ADR) Airbnb Trends in Feltre (2025)
Effective short term rental pricing strategy in Feltre involves understanding monthly ADR fluctuations. The Average Daily Rate (ADR) for Airbnb in Feltre typically peaks in April and dips lowest during November. Leveraging Airbnb dynamic pricing tools or strategies based on this seasonality can significantly boost revenue. Here's a look at the typical nightly rates achieved:
- Best-in-class properties (Top 10%) command rates of $240+ per night, often due to premium features or locations.
- Strong performing properties (Top 25%) achieve nightly rates of $131 or more.
- Typical properties (Median) charge around $98 per night.
- Entry-level properties (Bottom 25%) earn around $72 per night.
Average Daily Rate (ADR) Trend by Month in Feltre
Get Live Feltre Market Intelligence 👇

Explore Real-time Analytics
Airbnb Seasonality Analysis & Trends in Feltre (2025)
Peak Season (August, July, November)
- Revenue averages $2,211 per month
- Occupancy rates average 51.4%
- Daily rates average $136
Shoulder Season
- Revenue averages $1,588 per month
- Occupancy maintains around 32.7%
- Daily rates hold near $141
Low Season (January, February, March)
- Revenue drops to average $1,115 per month
- Occupancy decreases to average 27.8%
- Daily rates adjust to average $119
Seasonality Insights for Feltre
- The Airbnb seasonality in Feltre shows highly seasonal trends requiring careful strategy. While the sections above show seasonal averages, it's also insightful to look at the extremes:
- During the high season, the absolute peak month showcases Feltre's highest earning potential, with monthly revenues capable of climbing to $2,463, occupancy reaching a high of 59.5%, and ADRs peaking at $148.
- Conversely, the slowest single month of the year, typically falling within the low season, marks the market's lowest point. In this month, revenue might dip to $952, occupancy could drop to 25.1%, and ADRs may adjust down to $116.
- Understanding both the seasonal averages and these monthly peaks and troughs in revenue, occupancy, and ADR is crucial for maximizing your Airbnb profit potential in Feltre.
Seasonal Strategies for Maximizing Profit
- Peak Season: Maximize revenue through premium pricing and potentially longer minimum stays. Ensure high availability.
- Low Season: Offer competitive pricing, special promotions (e.g., extended stay discounts), and flexible cancellation policies. Target off-season travelers like remote workers or budget-conscious guests.
- Shoulder Seasons: Implement dynamic pricing that balances peak and low rates. Target weekend travelers or specific events. Offer slightly more flexible terms than peak season.
- Regularly analyze your own performance against these Feltre seasonality benchmarks and adjust your pricing and availability strategy accordingly.
Best Areas for Airbnb Investment in Feltre (2025)
Exploring the top neighborhoods for short-term rentals in Feltre? This section highlights key areas, outlining why they are attractive for hosts and guests, along with notable local attractions. Consider these locations based on your target guest profile and investment strategy.
| Neighborhood / Area | Why Host Here? (Target Guests & Appeal) | Key Attractions & Landmarks |
|---|---|---|
| Centro Storico | The historic center of Feltre, with its medieval architecture and charming streets. Attracts culture lovers and tourists looking to explore history and local cuisine. | Castel Venezze, Cathedral of San Pietro, Piazza Maggiore, Palazzo Villabruna, Museo Civico, Chiesa di San Rocco |
| Monti del Sole | Located in the hills surrounding Feltre, this area offers stunning views and is popular for outdoor enthusiasts looking for hiking and nature experiences. | Hiking Trails, Scenic Viewpoints, Nature Parks, Cascate del Comelle, Feltre Mountain Lodge |
| Pian delle Frazioni | A quieter suburb of Feltre with access to local markets and amenities, appealing to families and longer-stay visitors. | Local Shops, Community Parks, Proximity to Schools and Activities, Sport Facilities |
| Case Sparse | Charming scattered houses in the countryside, ideal for those looking for peace and quiet, as well as a unique local experience in the Veneto region. | Countryside Views, Local Vineyards, Agriturismo Experiences, Traditional Venetan Cuisine |
| Villaggio di San Bartolomeo | A picturesque little village close to Feltre, known for its tranquility and natural beauty, perfect for escapes from urban life. | San Bartolomeo Church, Local Hiking Trails, Scenic Picnicking Spots, Wildlife Watching |
| Feltre Exposizioni | Known for hosting various events and exhibitions, this area attracts attendees and vendors looking for short-term accommodations. | Feltre Exhibition Centre, Local Events, Concerts, Markets |
| Borgo San Giacomo | A small picturesque hamlet near Feltre, known for its community feel and proximity to nature, offering a unique staying experience. | San Giacomo Church, Scenic Landscape, Local Artisans |
| Valbelluna | The valley that Feltre overlooks, providing beautiful landscapes and outdoor activities, appealing to tourists and nature lovers. | Nature Reserves, Rivers and Lakes, Outdoor Sports, Local Wildlife |
Understanding Airbnb License Requirements & STR Laws in Feltre (2025)
Yes, Feltre, Veneto, Italy enforces high STR regulations. Obtaining a license and ensuring compliance is almost certainly required according to current 2025 STR laws. Always verify the latest short term rental regulations and Airbnb license requirements directly with local government authorities for Feltre to ensure full compliance before hosting.
(Source: AirROI data, 2025, based on 78% licensed listings)
Top Performing Airbnb Properties in Feltre (2025)
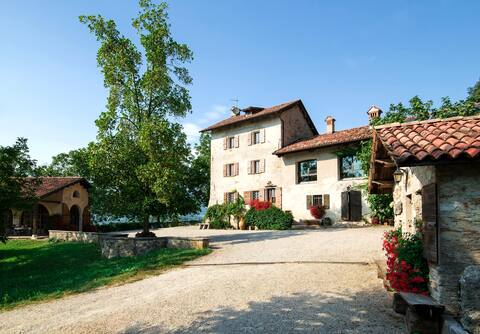
Benchmark your potential! Explore examples of top-performing Airbnb properties in Feltrebased on Trailing Twelve Month (TTM) revenue. Analyze their characteristics, revenue, occupancy rate, and ADR to understand what drives success in this market.

Cozy home in Feltre with house a mountain view
Entire Place • 2 bedrooms
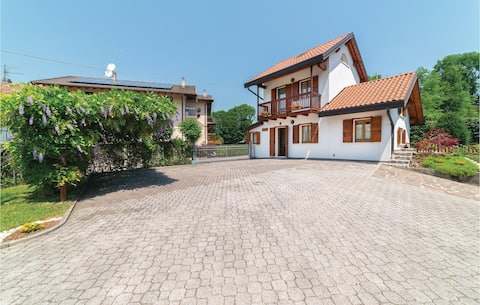
Countryside house with tennis in the Dolomites
Entire Place • 2 bedrooms
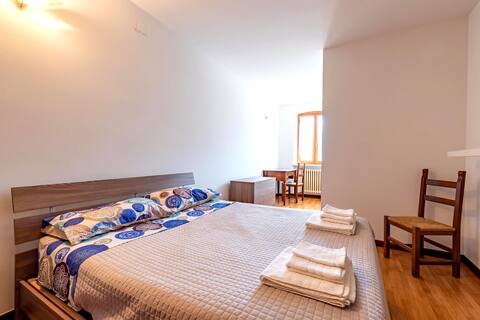
Al Ginco
Entire Place • 3 bedrooms

Loft overlooking the old town .
Entire Place • 3 bedrooms

Cabin dal Gradisca Feltre
Entire Place • 3 bedrooms
Palazzo Bovio - Exclusive apartment in the center
Entire Place • 2 bedrooms
Note: Performance varies based on location, size, amenities, seasonality, and management quality. Data reflects the past 12 months.
Top Performing Airbnb Hosts in Feltre (2025)
Learn from the best! This table showcases top-performing Airbnb hosts in Feltre based on the number of properties managed and estimated total revenue over the past year. Analyze their scale and performance metrics.
| Host Name | Properties | Grossing Revenue | Stay Reviews | Avg Rating |
|---|---|---|---|---|
| Novasol | 1 | $77,485 | 12 | 4.92/5.0 |
| Federica | 1 | $69,815 | 26 | 5.00/5.0 |
| Novasol | 1 | $41,554 | 4 | 5.00/5.0 |
| Giuliana | 1 | $20,917 | 98 | 4.92/5.0 |
| Valter | 1 | $19,524 | 106 | 4.92/5.0 |
| Paolo | 2 | $19,094 | 102 | 4.94/5.0 |
| Lucia | 1 | $16,385 | 50 | 4.88/5.0 |
| Christian | 1 | $16,229 | 24 | 4.88/5.0 |
| Host #409613191 | 1 | $16,201 | 10 | 4.70/5.0 |
| Welcome To Veneto & Friuli | 1 | $14,932 | 7 | 4.43/5.0 |
Analyzing the strategies of top hosts, such as their property selection, pricing, and guest communication, can offer valuable lessons for optimizing your own Airbnb operations in Feltre.
Dive Deeper: Advanced Feltre STR Market Data (2025)
Ready to unlock more insights? AirROI provides access to advanced metrics and comprehensive Airbnb data for Feltre. Explore detailed analytics beyond this report to refine your investment strategy, optimize pricing, and maximize your vacation rental profits.
Explore Advanced MetricsFeltre Short-Term Rental Market Composition (2025): Property & Room Types
Room Type Distribution
Property Type Distribution
Market Composition Insights for Feltre
- The Feltre Airbnb market composition is heavily skewed towards Entire Home/Apt listings, which make up 82.5% of the 40 active rentals. This indicates strong guest preference for privacy and space.
- Looking at the property type distribution in Feltre, Apartment/Condo properties are the most common (50%), reflecting the local real estate landscape.
- Houses represent a significant 45% portion, catering likely to families or larger groups.
- Smaller segments like hotel/boutique, others (combined 5.0%) offer potential for unique stay experiences.
Feltre Airbnb Room Capacity Analysis (2025): Bedroom Distribution
Distribution of Listings by Number of Bedrooms
Room Capacity Insights for Feltre
- The dominant room capacity in Feltre is 2 bedrooms listings, making up 37.5% of the market. This suggests a strong demand for properties suitable for couples or solo travelers.
- Together, 2 bedrooms and 1 bedroom properties represent 65.0% of the active Airbnb listings in Feltre, indicating a high concentration in these sizes.
- A significant 25.0% of listings offer 3+ bedrooms, catering to larger groups and families seeking more space in Feltre.
Feltre Vacation Rental Guest Capacity Trends (2025)
Distribution of Listings by Guest Capacity
Guest Capacity Insights for Feltre
- The most common guest capacity trend in Feltre vacation rentals is listings accommodating 6 guests (20%). This suggests the primary traveler segment is likely larger groups.
- Properties designed for 6 guests and 4 guests dominate the Feltre STR market, accounting for 40.0% of listings.
- 27.5% of properties accommodate 6+ guests, serving the market segment for larger families or group travel in Feltre.
- On average, properties in Feltre are equipped to host 3.8 guests.
Feltre Airbnb Booking Patterns (2025): Available vs. Booked Days
Available Days Distribution
Booked Days Distribution
Booking Pattern Insights for Feltre
- The most common availability pattern in Feltre falls within the 271-366 days range, representing 62.5% of listings. This suggests many properties have significant open periods on their calendars.
- Approximately 90.0% of listings show high availability (181+ days open annually), indicating potential for increased bookings or specific owner usage patterns.
- For booked days, the 31-90 days range is most frequent in Feltre (45%), reflecting common guest stay durations or potential owner blocking patterns.
- A notable 12.5% of properties secure long booking periods (181+ days booked per year), highlighting successful long-term rental strategies or significant owner usage.
Feltre Airbnb Minimum Stay Requirements Analysis
Distribution of Listings by Minimum Night Requirement
1 Night
12 listings
30.8% of total
2 Nights
6 listings
15.4% of total
3 Nights
10 listings
25.6% of total
4-6 Nights
6 listings
15.4% of total
7-29 Nights
2 listings
5.1% of total
30+ Nights
3 listings
7.7% of total
Key Insights
- The most prevalent minimum stay requirement in Feltre is 1 Night, adopted by 30.8% of listings. This highlights the market's preference for shorter, flexible bookings.
Recommendations
- Align with the market by considering a 1 Night minimum stay, as 30.8% of Feltre hosts use this setting.
- Explore offering discounts for stays of 30+ nights to attract the 7.7% of the market seeking extended stays.
- Adjust minimum nights based on seasonality – potentially shorter during low season and longer during peak demand periods in Feltre.
Feltre Airbnb Cancellation Policy Trends Analysis (2025)
Super Strict 60 Days
3 listings
8.3% of total
Flexible
10 listings
27.8% of total
Moderate
19 listings
52.8% of total
Strict
4 listings
11.1% of total
Cancellation Policy Insights for Feltre
- The prevailing Airbnb cancellation policy trend in Feltre is Moderate, used by 52.8% of listings.
- The market strongly favors guest-friendly terms, with 80.6% of listings offering Flexible or Moderate policies. This suggests guests in Feltre may expect booking flexibility.
Recommendations for Hosts
- Consider adopting a Moderate policy to align with the 52.8% market standard in Feltre.
- Using a Strict policy might deter some guests, as only 11.1% of listings use it. Evaluate if potential revenue protection outweighs possible lower booking rates.
- Regularly review your cancellation policy against competitors and market demand shifts in Feltre.
Feltre STR Booking Lead Time Analysis (2025)
Average Booking Lead Time by Month
Booking Lead Time Insights for Feltre
- The overall average booking lead time for vacation rentals in Feltre is 66 days.
- Guests book furthest in advance for stays during June (average 132 days), likely coinciding with peak travel demand or local events.
- The shortest booking windows occur for stays in February (average 22 days), indicating more last-minute travel plans during this time.
- Seasonally, Summer (101 days avg.) sees the longest lead times, while Winter (29 days avg.) has the shortest, reflecting typical travel planning cycles.
Recommendations for Hosts
- Use the overall average lead time (66 days) as a baseline for your pricing and availability strategy in Feltre.
- For June stays, consider implementing length-of-stay discounts or slightly higher rates for bookings made less than 132 days out to capitalize on advance planning.
- Target marketing efforts for the Summer season well in advance (at least 101 days) to capture early planners.
- Monitor your own booking lead times against these Feltre averages to identify opportunities for dynamic pricing adjustments.
Popular & Essential Airbnb Amenities in Feltre (2025)
Amenity Prevalence
Amenity Insights for Feltre
- Popular amenities like Heating, Dishes and silverware, Kitchen are common but not universal. Offering these can provide a competitive edge.
- Warning: Wifi is not universally provided but is considered essential globally. Ensure reliable Wifi is offered.
Recommendations for Hosts
- Consider adding popular differentiators like Heating or Dishes and silverware to increase appeal.
- Highlight unique or less common amenities you offer (e.g., hot tub, dedicated workspace, EV charger) in your listing description and photos.
- Regularly check competitor amenities in Feltre to stay competitive.
Feltre Airbnb Guest Demographics & Profile Analysis (2025)
Guest Profile Summary for Feltre
- The typical guest profile for Airbnb in Feltre consists of predominantly international visitors (79%), with top international origins including Germany, typically belonging to the Post-2000s (Gen Z/Alpha) group (50%), primarily speaking English or Italian.
- Domestic travelers account for 21.2% of guests.
- Key international markets include Italy (21.2%) and Germany (18.2%).
- Top languages spoken are English (38.5%) followed by Italian (13.4%).
- A significant demographic segment is the Post-2000s (Gen Z/Alpha) group, representing 50% of guests.
Recommendations for Hosts
- Focus marketing internationally, particularly towards travelers from Germany.
- Tailor amenities and listing descriptions to appeal to the dominant Post-2000s (Gen Z/Alpha) demographic (e.g., highlight fast WiFi, smart home features, local guides).
- Highlight unique local experiences or amenities relevant to the primary guest profile.
- Consider seasonal promotions aligned with peak travel times for key origin markets.
Nearby Short-Term Rental Market Comparison
How does the Feltre Airbnb market stack up against its neighbors? Compare key performance metrics like average monthly revenue, ADR, and occupancy rates in surrounding areas to understand the broader regional STR landscape.
| Market | Active Properties | Monthly Revenue | Daily Rate | Avg. Occupancy |
|---|---|---|---|---|
| Bayrischzell | 30 | $4,718 | $392.87 | 42% |
| Urtijëi - St. Ulrich in Gröden - Ortisei | 163 | $4,698 | $630.45 | 40% |
| Moos in Passeier - Moso in Passiria | 17 | $4,619 | $547.60 | 27% |
| Steinberg am Rofan | 11 | $4,394 | $311.71 | 40% |
| Brenzone sul Garda | 19 | $4,128 | $335.25 | 52% |
| Reith bei Kitzbühel | 44 | $3,766 | $308.69 | 45% |
| Pfafflar | 10 | $3,559 | $263.32 | 58% |
| Cortina d'Ampezzo | 265 | $3,522 | $379.53 | 43% |
| Venice | 6,405 | $3,454 | $238.80 | 53% |
| Wiesing | 16 | $3,222 | $208.10 | 52% |