Falcade Airbnb Market Analysis 2025: Short Term Rental Data & Vacation Rental Statistics in Veneto, Italy
Is Airbnb profitable in Falcade in 2025? Explore comprehensive Airbnb analytics for Falcade, Veneto, Italy to uncover income potential. This 2025 STR market report for Falcade, based on AirROI data from April 2024 to March 2025, reveals key trends in the niche market of 59 active listings.
Whether you're considering an Airbnb investment in Falcade, optimizing your existing vacation rental, or exploring rental arbitrage opportunities, understanding the Falcade Airbnb data is crucial. Navigating the high regulation landscape is key to maximizing your short term rental income potential. Let's dive into the specifics.
Key Falcade Airbnb Performance Metrics Overview
Monthly Airbnb Revenue Variations & Income Potential in Falcade (2025)
Understanding the monthly revenue variations for Airbnb listings in Falcade is key to maximizing your short term rental income potential. Seasonality significantly impacts earnings. Our analysis, based on data from the past 12 months, shows that the peak revenue month for STRs in Falcade is typically August, while March often presents the lowest earnings, highlighting opportunities for strategic pricing adjustments during shoulder and low seasons. Explore the typical Airbnb income in Falcade across different performance tiers:
- Best-in-class properties (Top 10%) achieve $3,398+ monthly, often utilizing dynamic pricing and superior guest experiences.
- Strong performing properties (Top 25%) earn $2,244 or more, indicating effective management and desirable locations/amenities.
- Typical properties (Median) generate around $1,370 per month, representing the average market performance.
- Entry-level properties (Bottom 25%) see earnings around $638, often with potential for optimization.
Average Monthly Airbnb Earnings Trend in Falcade
Falcade Airbnb Occupancy Rate Trends (2025)
Maximize your bookings by understanding the Falcade STR occupancy trends. Seasonal demand shifts significantly influence how often properties are booked. Typically, Augustsees the highest demand (peak season occupancy), while March experiences the lowest (low season). Effective strategies, like adjusting minimum stays or offering promotions, can boost occupancy during slower periods. Here's how different property tiers perform in Falcade:
- Best-in-class properties (Top 10%) achieve 76%+ occupancy, indicating high desirability and potentially optimized availability.
- Strong performing properties (Top 25%) maintain 52% or higher occupancy, suggesting good market fit and guest satisfaction.
- Typical properties (Median) have an occupancy rate around 31%.
- Entry-level properties (Bottom 25%) average 15% occupancy, potentially facing higher vacancy.
Average Monthly Occupancy Rate Trend in Falcade
Average Daily Rate (ADR) Airbnb Trends in Falcade (2025)
Effective short term rental pricing strategy in Falcade involves understanding monthly ADR fluctuations. The Average Daily Rate (ADR) for Airbnb in Falcade typically peaks in December and dips lowest during September. Leveraging Airbnb dynamic pricing tools or strategies based on this seasonality can significantly boost revenue. Here's a look at the typical nightly rates achieved:
- Best-in-class properties (Top 10%) command rates of $214+ per night, often due to premium features or locations.
- Strong performing properties (Top 25%) achieve nightly rates of $180 or more.
- Typical properties (Median) charge around $138 per night.
- Entry-level properties (Bottom 25%) earn around $111 per night.
Average Daily Rate (ADR) Trend by Month in Falcade
Get Live Falcade Market Intelligence 👇

Explore Real-time Analytics
Airbnb Seasonality Analysis & Trends in Falcade (2025)
Peak Season (August, July, February)
- Revenue averages $2,459 per month
- Occupancy rates average 51.2%
- Daily rates average $149
Shoulder Season
- Revenue averages $1,486 per month
- Occupancy maintains around 32.5%
- Daily rates hold near $148
Low Season (March, October, November)
- Revenue drops to average $1,164 per month
- Occupancy decreases to average 30.1%
- Daily rates adjust to average $152
Seasonality Insights for Falcade
- The Airbnb seasonality in Falcade shows highly seasonal trends requiring careful strategy. While the sections above show seasonal averages, it's also insightful to look at the extremes:
- During the high season, the absolute peak month showcases Falcade's highest earning potential, with monthly revenues capable of climbing to $2,769, occupancy reaching a high of 56.6%, and ADRs peaking at $170.
- Conversely, the slowest single month of the year, typically falling within the low season, marks the market's lowest point. In this month, revenue might dip to $1,134, occupancy could drop to 23.7%, and ADRs may adjust down to $138.
- Understanding both the seasonal averages and these monthly peaks and troughs in revenue, occupancy, and ADR is crucial for maximizing your Airbnb profit potential in Falcade.
Seasonal Strategies for Maximizing Profit
- Peak Season: Maximize revenue through premium pricing and potentially longer minimum stays. Ensure high availability.
- Low Season: Offer competitive pricing, special promotions (e.g., extended stay discounts), and flexible cancellation policies. Target off-season travelers like remote workers or budget-conscious guests.
- Shoulder Seasons: Implement dynamic pricing that balances peak and low rates. Target weekend travelers or specific events. Offer slightly more flexible terms than peak season.
- Regularly analyze your own performance against these Falcade seasonality benchmarks and adjust your pricing and availability strategy accordingly.
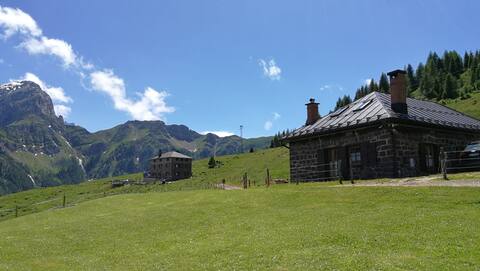
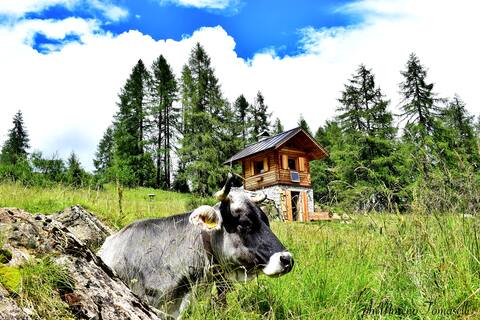
Best Areas for Airbnb Investment in Falcade (2025)
Exploring the top neighborhoods for short-term rentals in Falcade? This section highlights key areas, outlining why they are attractive for hosts and guests, along with notable local attractions. Consider these locations based on your target guest profile and investment strategy.
| Neighborhood / Area | Why Host Here? (Target Guests & Appeal) | Key Attractions & Landmarks |
|---|---|---|
| Falcade Centro | The heart of Falcade, filled with shops, restaurants, and easy access to ski lifts. Ideal for tourists wanting a complete local experience with convenience to amenities and winter sports activities. | Ski lifts to Passo San Pellegrino, Local dining options, Scenic mountain views, Falcade's historic village center, Hiking trails |
| San Pellegrino Pass | A popular area for skiing and outdoor activities, this pass attracts adventure seekers and nature lovers, making it a great location for winter sports enthusiasts and summer hikers alike. | Ski resorts, Mountain biking trails, Numerous hiking paths, Scenic views, Alpine lakes |
| Val Biois | Known for its stunning natural scenery and tranquility, Val Biois is perfect for those looking for a peaceful retreat amidst the Dolomites. A fantastic summer and winter destination with outdoor activities. | Natural parks, Hiking trails, Natural thermal baths, Scenic drives, Photogenic landscapes |
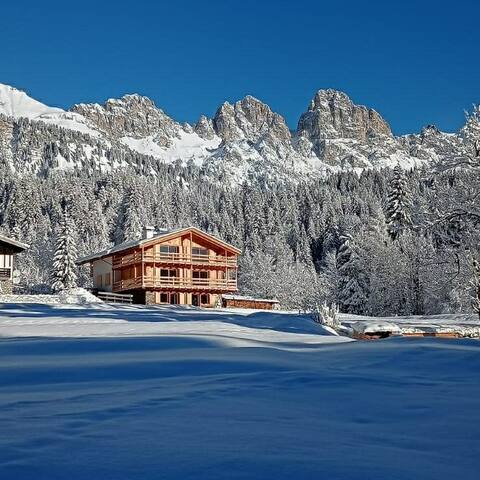
| Falcade Ski Resort | Direct access to ski slopes and winter sports facilities makes this area highly appealing for winter tourism, providing guests with the chance to ski right from their front door. | Skiing and snowboarding, Winter hiking trails, Ski schools and rentals, Snow parks, Après-ski activities |
| Loc. Le Ciare | A tranquil area just outside Falcade, offering stunning views and access to nature, ideal for those who want to escape the hustle and bustle while still being close to the main attractions. | Peaceful walking paths, Local flora and fauna, Viewpoints, Easy access to main attractions in Falcade, Nearby traditional restaurants |
| Mason di Falcade | A lovely neighborhood with a quaint atmosphere, it appeals to families and visitors seeking a homey feel with accessibility to both nature and winter sports activities. | Family-friendly activities, Local shops and eateries, Short trails, Cultural events, Scenic landscapes |
| Alleghe | Located a short drive from Falcade, Alleghe offers stunning views of the lake and surrounding mountains, and is ideal for tourists looking for watersports in the summer and skiing in the winter. | Lake Alleghe, Ski slopes, Indoor climbing gym, Hiking and cycling paths, Picturesque village charm |
| Civetta Mountain Area | A picturesque mountain area that attracts outdoor enthusiasts all year round, perfect for maintaining a steady stream of tourists interested in hiking, skiing, and climbing. | Civetta ski area, Mountain climbing routes, Hiking trails, Breathtaking landscapes, Cultural heritage sites |
Understanding Airbnb License Requirements & STR Laws in Falcade (2025)
Yes, Falcade, Veneto, Italy enforces high STR regulations. Obtaining a license and ensuring compliance is almost certainly required according to current 2025 STR laws. Always verify the latest short term rental regulations and Airbnb license requirements directly with local government authorities for Falcade to ensure full compliance before hosting.
(Source: AirROI data, 2025, based on 68% licensed listings)
Top Performing Airbnb Properties in Falcade (2025)
Benchmark your potential! Explore examples of top-performing Airbnb properties in Falcadebased on Trailing Twelve Month (TTM) revenue. Analyze their characteristics, revenue, occupancy rate, and ADR to understand what drives success in this market.
Baita Casera Caviazza
Entire Place • 2 bedrooms
Toma Cabin - Chalet in Dolomites
Entire Place • 1 bedroom

Casa Mari
Entire Place • 2 bedrooms
Tabiá sul Prá - apartment Anna
Entire Place • N/A

Tabià sui Prà - apartment Marco
Entire Place • 1 bedroom

Apartment Località Canes
Entire Place • 2 bedrooms
Note: Performance varies based on location, size, amenities, seasonality, and management quality. Data reflects the past 12 months.
Top Performing Airbnb Hosts in Falcade (2025)
Learn from the best! This table showcases top-performing Airbnb hosts in Falcade based on the number of properties managed and estimated total revenue over the past year. Analyze their scale and performance metrics.
| Host Name | Properties | Grossing Revenue | Stay Reviews | Avg Rating |
|---|---|---|---|---|
| Sergio | 27 | $259,456 | 70 | 2.27/5.0 |
| Host #479172954 | 1 | $35,878 | 0 | 0.00/5.0 |
| Ruggero | 3 | $34,757 | 17 | 4.96/5.0 |
| Moreno | 1 | $30,312 | 91 | 4.97/5.0 |
| Anna | 1 | $28,615 | 43 | 5.00/5.0 |
| Marco | 1 | $27,222 | 28 | 5.00/5.0 |
| Jacopo | 1 | $26,370 | 33 | 4.91/5.0 |
| Fabio | 1 | $20,561 | 9 | 4.78/5.0 |
| Ivan | 3 | $20,363 | 35 | 4.68/5.0 |
| Irene | 1 | $19,019 | 41 | 4.83/5.0 |
Analyzing the strategies of top hosts, such as their property selection, pricing, and guest communication, can offer valuable lessons for optimizing your own Airbnb operations in Falcade.
Dive Deeper: Advanced Falcade STR Market Data (2025)
Ready to unlock more insights? AirROI provides access to advanced metrics and comprehensive Airbnb data for Falcade. Explore detailed analytics beyond this report to refine your investment strategy, optimize pricing, and maximize your vacation rental profits.
Explore Advanced MetricsFalcade Short-Term Rental Market Composition (2025): Property & Room Types
Room Type Distribution
Property Type Distribution
Market Composition Insights for Falcade
- The Falcade Airbnb market composition is heavily skewed towards Entire Home/Apt listings, which make up 100% of the 59 active rentals. This indicates strong guest preference for privacy and space.
- Looking at the property type distribution in Falcade, Apartment/Condo properties are the most common (89.8%), reflecting the local real estate landscape.
- Smaller segments like outdoor/unique, unique stays (combined 5.1%) offer potential for unique stay experiences.
Falcade Airbnb Room Capacity Analysis (2025): Bedroom Distribution
Distribution of Listings by Number of Bedrooms
Room Capacity Insights for Falcade
- The dominant room capacity in Falcade is 1 bedroom listings, making up 40.7% of the market. This suggests a strong demand for properties suitable for couples or solo travelers.
- Together, 1 bedroom and 2 bedrooms properties represent 78.0% of the active Airbnb listings in Falcade, indicating a high concentration in these sizes.
- Listings with 3+ bedrooms (6.8%) represent a smaller niche, potentially indicating an underserved market for larger group accommodations in Falcade.
Falcade Vacation Rental Guest Capacity Trends (2025)
Distribution of Listings by Guest Capacity
Guest Capacity Insights for Falcade
- The most common guest capacity trend in Falcade vacation rentals is listings accommodating 4 guests (45.8%). This suggests the primary traveler segment is likely small families or groups.
- Properties designed for 4 guests and 6 guests dominate the Falcade STR market, accounting for 67.8% of listings.
- 23.7% of properties accommodate 6+ guests, serving the market segment for larger families or group travel in Falcade.
- On average, properties in Falcade are equipped to host 4.3 guests.
Falcade Airbnb Booking Patterns (2025): Available vs. Booked Days
Available Days Distribution
Booked Days Distribution
Booking Pattern Insights for Falcade
- The most common availability pattern in Falcade falls within the 271-366 days range, representing 66.1% of listings. This suggests many properties have significant open periods on their calendars.
- Approximately 94.9% of listings show high availability (181+ days open annually), indicating potential for increased bookings or specific owner usage patterns.
- For booked days, the 31-90 days range is most frequent in Falcade (35.6%), reflecting common guest stay durations or potential owner blocking patterns.
- A notable 6.8% of properties secure long booking periods (181+ days booked per year), highlighting successful long-term rental strategies or significant owner usage.
Falcade Airbnb Minimum Stay Requirements Analysis
Distribution of Listings by Minimum Night Requirement
1 Night
5 listings
9.1% of total
2 Nights
3 listings
5.5% of total
3 Nights
5 listings
9.1% of total
4-6 Nights
14 listings
25.5% of total
7-29 Nights
7 listings
12.7% of total
30+ Nights
21 listings
38.2% of total
Key Insights
- The most prevalent minimum stay requirement in Falcade is 30+ Nights, adopted by 38.2% of listings. This highlights the market's preference for longer commitments.
- Very short stays (1-2 nights) are less common (14.6%), suggesting hosts prefer slightly longer bookings to optimize turnover.
- A significant segment (38.2%) caters to monthly stays (30+ nights) in Falcade, pointing to opportunities in the extended-stay market.
Recommendations
- Align with the market by considering a 30+ Nights minimum stay, as 38.2% of Falcade hosts use this setting.
- If feasible, allowing 1-night stays, especially midweek or during low season, could capture last-minute bookings, as only 9.1% currently do.
- Explore offering discounts for stays of 30+ nights to attract the 38.2% of the market seeking extended stays.
- Adjust minimum nights based on seasonality – potentially shorter during low season and longer during peak demand periods in Falcade.
Falcade Airbnb Cancellation Policy Trends Analysis (2025)
Super Strict 60 Days
3 listings
6.4% of total
Super Strict 30 Days
14 listings
29.8% of total
Flexible
4 listings
8.5% of total
Moderate
13 listings
27.7% of total
Strict
13 listings
27.7% of total
Cancellation Policy Insights for Falcade
- The prevailing Airbnb cancellation policy trend in Falcade is Super Strict 30 Days, used by 29.8% of listings.
- There's a relatively balanced mix between guest-friendly (36.2%) and stricter (27.7%) policies, offering choices for different guest needs.
Recommendations for Hosts
- Consider adopting a Super Strict 30 Days policy to align with the 29.8% market standard in Falcade.
- Regularly review your cancellation policy against competitors and market demand shifts in Falcade.
Falcade STR Booking Lead Time Analysis (2025)
Average Booking Lead Time by Month
Booking Lead Time Insights for Falcade
- The overall average booking lead time for vacation rentals in Falcade is 70 days.
- Guests book furthest in advance for stays during July (average 100 days), likely coinciding with peak travel demand or local events.
- The shortest booking windows occur for stays in November (average 46 days), indicating more last-minute travel plans during this time.
- Seasonally, Summer (89 days avg.) sees the longest lead times, while Fall (60 days avg.) has the shortest, reflecting typical travel planning cycles.
Recommendations for Hosts
- Use the overall average lead time (70 days) as a baseline for your pricing and availability strategy in Falcade.
- For July stays, consider implementing length-of-stay discounts or slightly higher rates for bookings made less than 100 days out to capitalize on advance planning.
- Target marketing efforts for the Summer season well in advance (at least 89 days) to capture early planners.
- Monitor your own booking lead times against these Falcade averages to identify opportunities for dynamic pricing adjustments.
Popular & Essential Airbnb Amenities in Falcade (2025)
Amenity Prevalence
Amenity Insights for Falcade
- Essential amenities in Falcade that guests expect include: Heating, Kitchen. Lacking these (any) could significantly impact bookings.
- Popular amenities like TV, Essentials, Refrigerator are common but not universal. Offering these can provide a competitive edge.
Recommendations for Hosts
- Ensure your listing includes all essential amenities for Falcade: Heating, Kitchen.
- Prioritize adding missing essentials: Heating, Kitchen.
- Consider adding popular differentiators like TV or Essentials to increase appeal.
- Highlight unique or less common amenities you offer (e.g., hot tub, dedicated workspace, EV charger) in your listing description and photos.
- Regularly check competitor amenities in Falcade to stay competitive.
Falcade Airbnb Guest Demographics & Profile Analysis (2025)
Guest Profile Summary for Falcade
- The typical guest profile for Airbnb in Falcade consists of a mix of domestic (36%) and international guests, with top international origins including Germany, typically belonging to the Post-2000s (Gen Z/Alpha) group (50%), primarily speaking English or Italian.
- Domestic travelers account for 36.4% of guests.
- Key international markets include Italy (36.4%) and Germany (12.7%).
- Top languages spoken are English (40.7%) followed by Italian (13.3%).
- A significant demographic segment is the Post-2000s (Gen Z/Alpha) group, representing 50% of guests.
Recommendations for Hosts
- Focus marketing internationally, particularly towards travelers from Germany.
- Tailor amenities and listing descriptions to appeal to the dominant Post-2000s (Gen Z/Alpha) demographic (e.g., highlight fast WiFi, smart home features, local guides).
- Highlight unique local experiences or amenities relevant to the primary guest profile.
- Consider seasonal promotions aligned with peak travel times for key origin markets.
Nearby Short-Term Rental Market Comparison
How does the Falcade Airbnb market stack up against its neighbors? Compare key performance metrics like average monthly revenue, ADR, and occupancy rates in surrounding areas to understand the broader regional STR landscape.
| Market | Active Properties | Monthly Revenue | Daily Rate | Avg. Occupancy |
|---|---|---|---|---|
| Bayrischzell | 30 | $4,718 | $392.87 | 42% |
| Urtijëi - St. Ulrich in Gröden - Ortisei | 163 | $4,698 | $630.45 | 40% |
| Moos in Passeier - Moso in Passiria | 17 | $4,619 | $547.60 | 27% |
| Steinberg am Rofan | 11 | $4,394 | $311.71 | 40% |
| Brenzone sul Garda | 19 | $4,128 | $335.25 | 52% |
| Reith bei Kitzbühel | 44 | $3,766 | $308.69 | 45% |
| Pfafflar | 10 | $3,559 | $263.32 | 58% |
| Cortina d'Ampezzo | 265 | $3,522 | $379.53 | 43% |
| Venice | 6,405 | $3,454 | $238.80 | 53% |
| Wiesing | 16 | $3,222 | $208.10 | 52% |