Cavallino Airbnb Market Analysis 2025: Short Term Rental Data & Vacation Rental Statistics in Veneto, Italy
Is Airbnb profitable in Cavallino in 2025? Explore comprehensive Airbnb analytics for Cavallino, Veneto, Italy to uncover income potential. This 2025 STR market report for Cavallino, based on AirROI data from April 2024 to March 2025, reveals key trends in the niche market of 19 active listings.
Whether you're considering an Airbnb investment in Cavallino, optimizing your existing vacation rental, or exploring rental arbitrage opportunities, understanding the Cavallino Airbnb data is crucial. Navigating the high regulation landscape is key to maximizing your short term rental income potential. Let's dive into the specifics.
Key Cavallino Airbnb Performance Metrics Overview
Monthly Airbnb Revenue Variations & Income Potential in Cavallino (2025)
Understanding the monthly revenue variations for Airbnb listings in Cavallino is key to maximizing your short term rental income potential. Seasonality significantly impacts earnings. Our analysis, based on data from the past 12 months, shows that the peak revenue month for STRs in Cavallino is typically August, while February often presents the lowest earnings, highlighting opportunities for strategic pricing adjustments during shoulder and low seasons. Explore the typical Airbnb income in Cavallino across different performance tiers:
- Best-in-class properties (Top 10%) achieve $3,461+ monthly, often utilizing dynamic pricing and superior guest experiences.
- Strong performing properties (Top 25%) earn $2,472 or more, indicating effective management and desirable locations/amenities.
- Typical properties (Median) generate around $1,320 per month, representing the average market performance.
- Entry-level properties (Bottom 25%) see earnings around $654, often with potential for optimization.
Average Monthly Airbnb Earnings Trend in Cavallino
Cavallino Airbnb Occupancy Rate Trends (2025)
Maximize your bookings by understanding the Cavallino STR occupancy trends. Seasonal demand shifts significantly influence how often properties are booked. Typically, Augustsees the highest demand (peak season occupancy), while February experiences the lowest (low season). Effective strategies, like adjusting minimum stays or offering promotions, can boost occupancy during slower periods. Here's how different property tiers perform in Cavallino:
- Best-in-class properties (Top 10%) achieve 63%+ occupancy, indicating high desirability and potentially optimized availability.
- Strong performing properties (Top 25%) maintain 45% or higher occupancy, suggesting good market fit and guest satisfaction.
- Typical properties (Median) have an occupancy rate around 29%.
- Entry-level properties (Bottom 25%) average 14% occupancy, potentially facing higher vacancy.
Average Monthly Occupancy Rate Trend in Cavallino
Average Daily Rate (ADR) Airbnb Trends in Cavallino (2025)
Effective short term rental pricing strategy in Cavallino involves understanding monthly ADR fluctuations. The Average Daily Rate (ADR) for Airbnb in Cavallino typically peaks in August and dips lowest during November. Leveraging Airbnb dynamic pricing tools or strategies based on this seasonality can significantly boost revenue. Here's a look at the typical nightly rates achieved:
- Best-in-class properties (Top 10%) command rates of $266+ per night, often due to premium features or locations.
- Strong performing properties (Top 25%) achieve nightly rates of $177 or more.
- Typical properties (Median) charge around $132 per night.
- Entry-level properties (Bottom 25%) earn around $97 per night.
Average Daily Rate (ADR) Trend by Month in Cavallino
Get Live Cavallino Market Intelligence 👇

Explore Real-time Analytics
Airbnb Seasonality Analysis & Trends in Cavallino (2025)
Peak Season (August, July, April)
- Revenue averages $2,970 per month
- Occupancy rates average 54.0%
- Daily rates average $174
Shoulder Season
- Revenue averages $1,476 per month
- Occupancy maintains around 30.3%
- Daily rates hold near $148
Low Season (January, February, December)
- Revenue drops to average $717 per month
- Occupancy decreases to average 16.3%
- Daily rates adjust to average $138
Seasonality Insights for Cavallino
- The Airbnb seasonality in Cavallino shows highly seasonal trends requiring careful strategy. While the sections above show seasonal averages, it's also insightful to look at the extremes:
- During the high season, the absolute peak month showcases Cavallino's highest earning potential, with monthly revenues capable of climbing to $3,456, occupancy reaching a high of 61.8%, and ADRs peaking at $175.
- Conversely, the slowest single month of the year, typically falling within the low season, marks the market's lowest point. In this month, revenue might dip to $654, occupancy could drop to 15.5%, and ADRs may adjust down to $130.
- Understanding both the seasonal averages and these monthly peaks and troughs in revenue, occupancy, and ADR is crucial for maximizing your Airbnb profit potential in Cavallino.
Seasonal Strategies for Maximizing Profit
- Peak Season: Maximize revenue through premium pricing and potentially longer minimum stays. Ensure high availability.
- Low Season: Offer competitive pricing, special promotions (e.g., extended stay discounts), and flexible cancellation policies. Target off-season travelers like remote workers or budget-conscious guests.
- Shoulder Seasons: Implement dynamic pricing that balances peak and low rates. Target weekend travelers or specific events. Offer slightly more flexible terms than peak season.
- Regularly analyze your own performance against these Cavallino seasonality benchmarks and adjust your pricing and availability strategy accordingly.
Best Areas for Airbnb Investment in Cavallino (2025)
Exploring the top neighborhoods for short-term rentals in Cavallino? This section highlights key areas, outlining why they are attractive for hosts and guests, along with notable local attractions. Consider these locations based on your target guest profile and investment strategy.
| Neighborhood / Area | Why Host Here? (Target Guests & Appeal) | Key Attractions & Landmarks |
|---|---|---|
| Lignano Sabbiadoro | Famous coastal resort known for its beautiful sandy beaches and vibrant nightlife. A popular destination for families and young travelers alike, offering a variety of water sports and entertainment. | Lignano Beach, Aquasplash, Golf Club Lignano, Parco Zoo Punta Verde, Lignano Sabbiadoro Promenade |
| Caorle | Picturesque seaside town with a charming historical center. It attracts tourists with its beautiful beaches and local seafood cuisine. Offers a quieter alternative to larger beach resorts. | Caorle Cathedral, Scogliera Viva, Aquafollie, Historical Centre, Caorle Beach |
| Bibione | A famous beach resort known for its wellness services and family-friendly amenities. It's a great destination for those seeking relaxation along with recreational activities. | Bibione Beach, Thermal Spa, Bibione Lagoon, Zoo Punta Verde, Viale Aurora |
| Jesolo | A lively beach destination with a long coastline, popular with families and nightlife enthusiasts. Known for its numerous restaurants, shops, and beach sports. | Jesolo Beach, Aqualandia, Piazza Brescia, Sea Life Aquarium, Lighthouse Beach |
| Portogruaro | An inland town known for its charming medieval architecture and rich cultural heritage. Offers a unique experience for visitors interested in history and local cuisine. | Portogruaro Cathedral, Historic Centre, Bridge over the Lemene, Palazzo Pio, Chiesa di San Giovanni |
| Treviso | A beautiful city with canals and a rich history. Though not a beach, it offers a scenic Italian experience with great food and culture, attracting those looking to explore beyond the seaside. | Treviso Cathedral, Canals of Treviso, Piazza dei Signori, Buranelli, Museo di Santa Caterina |
| Cona | A less known area with beautiful natural landscapes perfect for those seeking an escape from the hustle and bustle. Attracts nature lovers and those interested in rural tourism. | Natural Parks, Local Vineyards, Cycling Paths, Birdwatching, Scenic Trails |
| Palmanova | An intriguing historical fortress town known for its unique star-shaped layout and Renaissance architecture. Attracts tourists interested in history and architecture. | Palmanova Fortress, Piazza Grande, Porte di Palmanova, Palazzo Municipale, Museo del Fante |
Understanding Airbnb License Requirements & STR Laws in Cavallino (2025)
Yes, Cavallino, Veneto, Italy enforces high STR regulations. Obtaining a license and ensuring compliance is almost certainly required according to current 2025 STR laws. Always verify the latest short term rental regulations and Airbnb license requirements directly with local government authorities for Cavallino to ensure full compliance before hosting.
(Source: AirROI data, 2025, based on 58% licensed listings)
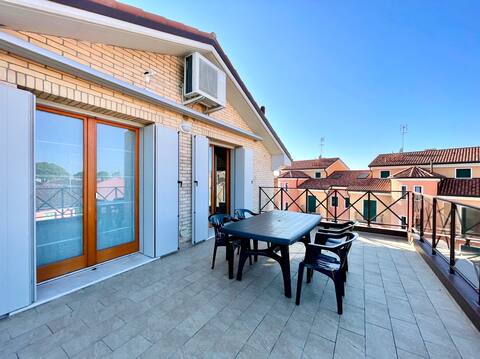
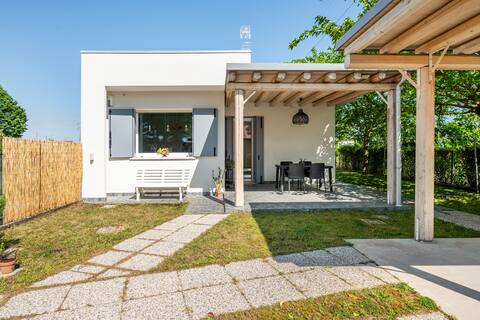
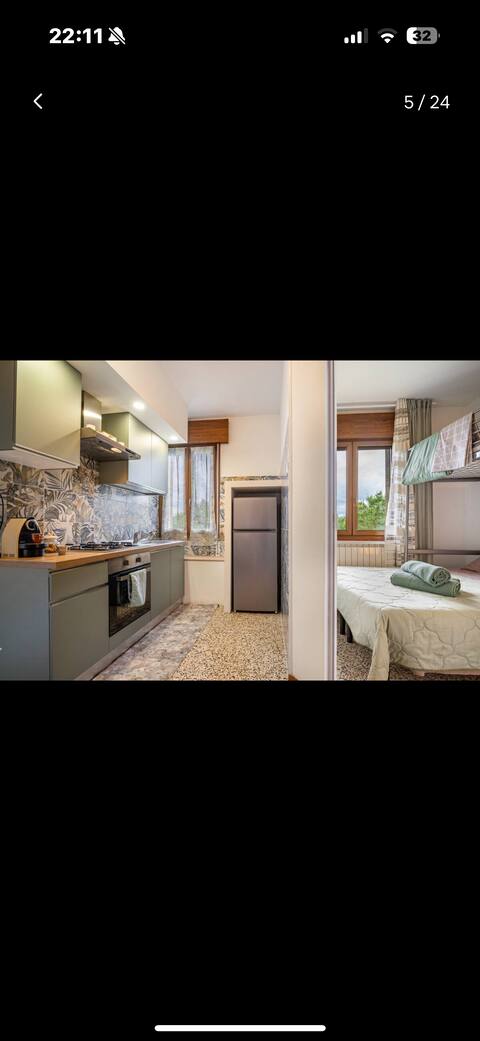
Top Performing Airbnb Properties in Cavallino (2025)
Benchmark your potential! Explore examples of top-performing Airbnb properties in Cavallinobased on Trailing Twelve Month (TTM) revenue. Analyze their characteristics, revenue, occupancy rate, and ADR to understand what drives success in this market.
Treporti 5-Carraro Immobiliare Jesolo
Entire Place • 2 bedrooms

Big Apartment Between Sea and Lagoon
Entire Place • 3 bedrooms
Salvia e Rosmarino, house with garden
Entire Place • 2 bedrooms
CASA ALMA PLAYA
Entire Place • 2 bedrooms

Single residential house with garden
Entire Place • 2 bedrooms
Apartment 100 meters from the beach
Entire Place • 1 bedroom
Note: Performance varies based on location, size, amenities, seasonality, and management quality. Data reflects the past 12 months.
Top Performing Airbnb Hosts in Cavallino (2025)
Learn from the best! This table showcases top-performing Airbnb hosts in Cavallino based on the number of properties managed and estimated total revenue over the past year. Analyze their scale and performance metrics.
| Host Name | Properties | Grossing Revenue | Stay Reviews | Avg Rating |
|---|---|---|---|---|
| Nicolò | 5 | $66,599 | 22 | 3.77/5.0 |
| Corina | 2 | $30,980 | 53 | 4.68/5.0 |
| Patrizia | 1 | $26,807 | 51 | 5.00/5.0 |
| Alan | 1 | $25,977 | 21 | 5.00/5.0 |
| Mattia | 1 | $25,752 | 50 | 4.94/5.0 |
| Regina | 1 | $24,244 | 40 | 4.95/5.0 |
| Marco | 1 | $16,406 | 52 | 4.88/5.0 |
| Benedetta | 1 | $13,021 | 16 | 5.00/5.0 |
| Giorgia | 1 | $7,099 | 4 | 5.00/5.0 |
| Host #36128835 | 1 | $6,784 | 0 | 0.00/5.0 |
Analyzing the strategies of top hosts, such as their property selection, pricing, and guest communication, can offer valuable lessons for optimizing your own Airbnb operations in Cavallino.
Dive Deeper: Advanced Cavallino STR Market Data (2025)
Ready to unlock more insights? AirROI provides access to advanced metrics and comprehensive Airbnb data for Cavallino. Explore detailed analytics beyond this report to refine your investment strategy, optimize pricing, and maximize your vacation rental profits.
Explore Advanced MetricsCavallino Short-Term Rental Market Composition (2025): Property & Room Types
Room Type Distribution
Property Type Distribution
Market Composition Insights for Cavallino
- The Cavallino Airbnb market composition is heavily skewed towards Entire Home/Apt listings, which make up 100% of the 19 active rentals. This indicates strong guest preference for privacy and space.
- Looking at the property type distribution in Cavallino, Apartment/Condo properties are the most common (63.2%), reflecting the local real estate landscape.
- Houses represent a significant 31.6% portion, catering likely to families or larger groups.
Cavallino Airbnb Room Capacity Analysis (2025): Bedroom Distribution
Distribution of Listings by Number of Bedrooms
Room Capacity Insights for Cavallino
- The dominant room capacity in Cavallino is 2 bedrooms listings, making up 73.7% of the market. This suggests a strong demand for properties suitable for couples or solo travelers.
- Together, 2 bedrooms and 1 bedroom properties represent 89.5% of the active Airbnb listings in Cavallino, indicating a high concentration in these sizes.
Cavallino Vacation Rental Guest Capacity Trends (2025)
Distribution of Listings by Guest Capacity
Guest Capacity Insights for Cavallino
- The most common guest capacity trend in Cavallino vacation rentals is listings accommodating 4 guests (36.8%). This suggests the primary traveler segment is likely small families or groups.
- Properties designed for 4 guests and 6 guests dominate the Cavallino STR market, accounting for 68.4% of listings.
- 42.2% of properties accommodate 6+ guests, serving the market segment for larger families or group travel in Cavallino.
- On average, properties in Cavallino are equipped to host 5.1 guests.
Cavallino Airbnb Booking Patterns (2025): Available vs. Booked Days
Available Days Distribution
Booked Days Distribution
Booking Pattern Insights for Cavallino
- The most common availability pattern in Cavallino falls within the 271-366 days range, representing 52.6% of listings. This suggests many properties have significant open periods on their calendars.
- Approximately 100.0% of listings show high availability (181+ days open annually), indicating potential for increased bookings or specific owner usage patterns.
- For booked days, the 91-180 days range is most frequent in Cavallino (47.4%), reflecting common guest stay durations or potential owner blocking patterns.
Cavallino Airbnb Minimum Stay Requirements Analysis
Distribution of Listings by Minimum Night Requirement
1 Night
1 listings
5.3% of total
2 Nights
1 listings
5.3% of total
3 Nights
4 listings
21.1% of total
4-6 Nights
5 listings
26.3% of total
7-29 Nights
7 listings
36.8% of total
30+ Nights
1 listings
5.3% of total
Key Insights
- The most prevalent minimum stay requirement in Cavallino is 7-29 Nights, adopted by 36.8% of listings. This highlights the market's preference for shorter, flexible bookings.
- Very short stays (1-2 nights) are less common (10.6%), suggesting hosts prefer slightly longer bookings to optimize turnover.
Recommendations
- Align with the market by considering a 7-29 Nights minimum stay, as 36.8% of Cavallino hosts use this setting.
- If feasible, allowing 1-night stays, especially midweek or during low season, could capture last-minute bookings, as only 5.3% currently do.
- Explore offering discounts for stays of 30+ nights to attract the 5.3% of the market seeking extended stays.
- Adjust minimum nights based on seasonality – potentially shorter during low season and longer during peak demand periods in Cavallino.
Cavallino Airbnb Cancellation Policy Trends Analysis (2025)
Super Strict 30 Days
4 listings
23.5% of total
Flexible
2 listings
11.8% of total
Moderate
4 listings
23.5% of total
Strict
7 listings
41.2% of total
Cancellation Policy Insights for Cavallino
- The prevailing Airbnb cancellation policy trend in Cavallino is Strict, used by 41.2% of listings.
- There's a relatively balanced mix between guest-friendly (35.3%) and stricter (41.2%) policies, offering choices for different guest needs.
Recommendations for Hosts
- Consider adopting a Strict policy to align with the 41.2% market standard in Cavallino.
- With 41.2% using Strict terms, this is a viable option in Cavallino, particularly for high-value properties or during peak demand periods.
- Regularly review your cancellation policy against competitors and market demand shifts in Cavallino.
Cavallino STR Booking Lead Time Analysis (2025)
Average Booking Lead Time by Month
Booking Lead Time Insights for Cavallino
- The overall average booking lead time for vacation rentals in Cavallino is 56 days.
- Guests book furthest in advance for stays during October (average 109 days), likely coinciding with peak travel demand or local events.
- The shortest booking windows occur for stays in March (average 44 days), indicating more last-minute travel plans during this time.
- Seasonally, Fall (83 days avg.) sees the longest lead times, while Winter (58 days avg.) has the shortest, reflecting typical travel planning cycles.
Recommendations for Hosts
- Use the overall average lead time (56 days) as a baseline for your pricing and availability strategy in Cavallino.
- For October stays, consider implementing length-of-stay discounts or slightly higher rates for bookings made less than 109 days out to capitalize on advance planning.
- Target marketing efforts for the Fall season well in advance (at least 83 days) to capture early planners.
- Monitor your own booking lead times against these Cavallino averages to identify opportunities for dynamic pricing adjustments.
Popular & Essential Airbnb Amenities in Cavallino (2025)
Amenity Prevalence
Amenity Insights for Cavallino
- Popular amenities like Kitchen, TV, Free parking on premises are common but not universal. Offering these can provide a competitive edge.
- Warning: Wifi is not universally provided but is considered essential globally. Ensure reliable Wifi is offered.
Recommendations for Hosts
- Consider adding popular differentiators like Kitchen or TV to increase appeal.
- Highlight unique or less common amenities you offer (e.g., hot tub, dedicated workspace, EV charger) in your listing description and photos.
- Regularly check competitor amenities in Cavallino to stay competitive.
Cavallino Airbnb Guest Demographics & Profile Analysis (2025)
Guest Profile Summary for Cavallino
- The typical guest profile for Airbnb in Cavallino consists of predominantly international visitors (90%), with top international origins including France, typically belonging to the Post-2000s (Gen Z/Alpha) group (50%), primarily speaking English or German.
- Domestic travelers account for 9.6% of guests.
- Key international markets include Germany (32.7%) and France (9.6%).
- Top languages spoken are English (36.8%) followed by German (17.6%).
- A significant demographic segment is the Post-2000s (Gen Z/Alpha) group, representing 50% of guests.
Recommendations for Hosts
- Focus marketing internationally, particularly towards travelers from France.
- Tailor amenities and listing descriptions to appeal to the dominant Post-2000s (Gen Z/Alpha) demographic (e.g., highlight fast WiFi, smart home features, local guides).
- Highlight unique local experiences or amenities relevant to the primary guest profile.
- Consider seasonal promotions aligned with peak travel times for key origin markets.
Nearby Short-Term Rental Market Comparison
How does the Cavallino Airbnb market stack up against its neighbors? Compare key performance metrics like average monthly revenue, ADR, and occupancy rates in surrounding areas to understand the broader regional STR landscape.
| Market | Active Properties | Monthly Revenue | Daily Rate | Avg. Occupancy |
|---|---|---|---|---|
| Urtijëi - St. Ulrich in Gröden - Ortisei | 163 | $4,698 | $630.45 | 40% |
| Moos in Passeier - Moso in Passiria | 17 | $4,619 | $547.60 | 27% |
| Selina | 14 | $4,330 | $440.33 | 47% |
| Cortina d'Ampezzo | 265 | $3,522 | $379.53 | 43% |
| Venice | 6,405 | $3,454 | $238.80 | 53% |
| La Val - Wengen - La Valle | 20 | $3,117 | $503.24 | 36% |
| Sëlva - Wolkenstein - Selva di Val Gardena | 95 | $2,923 | $414.01 | 42% |
| Colle Santa Lucia | 16 | $2,841 | $187.59 | 47% |
| Rojnići | 13 | $2,827 | $244.42 | 48% |
| Lajen - Laion | 85 | $2,777 | $498.85 | 34% |