Trevi Airbnb Market Analysis 2025: Short Term Rental Data & Vacation Rental Statistics in Umbria, Italy
Is Airbnb profitable in Trevi in 2025? Explore comprehensive Airbnb analytics for Trevi, Umbria, Italy to uncover income potential. This 2025 STR market report for Trevi, based on AirROI data from April 2024 to March 2025, reveals key trends in the niche market of 40 active listings.
Whether you're considering an Airbnb investment in Trevi, optimizing your existing vacation rental, or exploring rental arbitrage opportunities, understanding the Trevi Airbnb data is crucial. Navigating the high regulation landscape is key to maximizing your short term rental income potential. Let's dive into the specifics.
Key Trevi Airbnb Performance Metrics Overview
Monthly Airbnb Revenue Variations & Income Potential in Trevi (2025)
Understanding the monthly revenue variations for Airbnb listings in Trevi is key to maximizing your short term rental income potential. Seasonality significantly impacts earnings. Our analysis, based on data from the past 12 months, shows that the peak revenue month for STRs in Trevi is typically August, while March often presents the lowest earnings, highlighting opportunities for strategic pricing adjustments during shoulder and low seasons. Explore the typical Airbnb income in Trevi across different performance tiers:
- Best-in-class properties (Top 10%) achieve $2,579+ monthly, often utilizing dynamic pricing and superior guest experiences.
- Strong performing properties (Top 25%) earn $1,308 or more, indicating effective management and desirable locations/amenities.
- Typical properties (Median) generate around $656 per month, representing the average market performance.
- Entry-level properties (Bottom 25%) see earnings around $278, often with potential for optimization.
Average Monthly Airbnb Earnings Trend in Trevi
Trevi Airbnb Occupancy Rate Trends (2025)
Maximize your bookings by understanding the Trevi STR occupancy trends. Seasonal demand shifts significantly influence how often properties are booked. Typically, Augustsees the highest demand (peak season occupancy), while November experiences the lowest (low season). Effective strategies, like adjusting minimum stays or offering promotions, can boost occupancy during slower periods. Here's how different property tiers perform in Trevi:
- Best-in-class properties (Top 10%) achieve 60%+ occupancy, indicating high desirability and potentially optimized availability.
- Strong performing properties (Top 25%) maintain 40% or higher occupancy, suggesting good market fit and guest satisfaction.
- Typical properties (Median) have an occupancy rate around 20%.
- Entry-level properties (Bottom 25%) average 10% occupancy, potentially facing higher vacancy.
Average Monthly Occupancy Rate Trend in Trevi
Average Daily Rate (ADR) Airbnb Trends in Trevi (2025)
Effective short term rental pricing strategy in Trevi involves understanding monthly ADR fluctuations. The Average Daily Rate (ADR) for Airbnb in Trevi typically peaks in August and dips lowest during March. Leveraging Airbnb dynamic pricing tools or strategies based on this seasonality can significantly boost revenue. Here's a look at the typical nightly rates achieved:
- Best-in-class properties (Top 10%) command rates of $220+ per night, often due to premium features or locations.
- Strong performing properties (Top 25%) achieve nightly rates of $129 or more.
- Typical properties (Median) charge around $84 per night.
- Entry-level properties (Bottom 25%) earn around $65 per night.
Average Daily Rate (ADR) Trend by Month in Trevi
Get Live Trevi Market Intelligence 👇

Explore Real-time Analytics
Airbnb Seasonality Analysis & Trends in Trevi (2025)
Peak Season (August, July, September)
- Revenue averages $2,402 per month
- Occupancy rates average 37.8%
- Daily rates average $147
Shoulder Season
- Revenue averages $1,107 per month
- Occupancy maintains around 25.4%
- Daily rates hold near $138
Low Season (February, March, November)
- Revenue drops to average $555 per month
- Occupancy decreases to average 21.4%
- Daily rates adjust to average $131
Seasonality Insights for Trevi
- The Airbnb seasonality in Trevi shows highly seasonal trends requiring careful strategy. While the sections above show seasonal averages, it's also insightful to look at the extremes:
- During the high season, the absolute peak month showcases Trevi's highest earning potential, with monthly revenues capable of climbing to $2,785, occupancy reaching a high of 44.1%, and ADRs peaking at $149.
- Conversely, the slowest single month of the year, typically falling within the low season, marks the market's lowest point. In this month, revenue might dip to $516, occupancy could drop to 19.3%, and ADRs may adjust down to $129.
- Understanding both the seasonal averages and these monthly peaks and troughs in revenue, occupancy, and ADR is crucial for maximizing your Airbnb profit potential in Trevi.
Seasonal Strategies for Maximizing Profit
- Peak Season: Maximize revenue through premium pricing and potentially longer minimum stays. Ensure high availability.
- Low Season: Offer competitive pricing, special promotions (e.g., extended stay discounts), and flexible cancellation policies. Target off-season travelers like remote workers or budget-conscious guests.
- Shoulder Seasons: Implement dynamic pricing that balances peak and low rates. Target weekend travelers or specific events. Offer slightly more flexible terms than peak season.
- Regularly analyze your own performance against these Trevi seasonality benchmarks and adjust your pricing and availability strategy accordingly.
Best Areas for Airbnb Investment in Trevi (2025)
Exploring the top neighborhoods for short-term rentals in Trevi? This section highlights key areas, outlining why they are attractive for hosts and guests, along with notable local attractions. Consider these locations based on your target guest profile and investment strategy.
| Neighborhood / Area | Why Host Here? (Target Guests & Appeal) | Key Attractions & Landmarks |
|---|---|---|
| Centro Storico | The historic center of Trevi is a picturesque area filled with beautiful architecture, narrow streets, and charming squares. It attracts tourists looking to experience the authentic Italian culture and history. | Trevi Fountain, Piazza di Trevi, Santa Maria in Trivio, Palazzo Mazzancolli, Il Museo della Civiltà dell'Umbria, Local restaurants and cafes |
| Parco di Colfiorito | A beautiful natural park nearby Trevi that offers stunning views and opportunities for hiking and nature walks. Great for travelers looking to escape into nature while still being close to the town. | Colfiorito Park, Naturalistic trails, Birdwatching, Local flora and fauna, Picnic areas |
| Pieve San Felice | A quaint village just outside Trevi, known for its serene environment and beautiful countryside. Ideal for visitors seeking peace and relaxation amidst scenic landscapes. | Church of San Felice, Local farms, Countryside views, Hiking trails, Vineyards |
| Fosso di Trevi | This area is known for its tranquil rivers and lush greenery, perfect for guests seeking a nature retreat. It's close enough to Trevi to enjoy its attractions but offers a more rural experience. | River Fosso, Fishing spots, Walking paths, Picnic areas, Nature observation |
| Monte Serrano | A hilltop area providing panoramic views of the surrounding Umbrian landscape. Popular with visitors for outdoor activities like hiking and exploring historic ruins. | Monte Serrano hiking trails, Ancient ruins, Scenic viewpoints, Wildlife observation, Local flora |
| Sant’Emiliano | A serene village in the hills, perfect for those looking to experience authentic village life in Umbria. Offers a peaceful stay with traditional Umbria cuisine and culture. | Local churches, Umbria's countryside, Traditional festivals, Local markets, Agriturismo experiences |
| Cimitero di Trevi | This historic cemetery is known for its artistic tombstones and peaceful atmosphere. It attracts those interested in history and art, being close to Trevi's main sites. | Historic tombstones, Beautiful landscaping, Cultural heritage, Scenic beauty, Quiet retreats |
| Borgo Trevi | A charming neighborhood with boutique shops, restaurants, and local artisans. Great for tourists wanting to experience local culture and cuisine. | Artisan shops, Local eateries, Cultural events, Historic buildings, Community festivals |
Understanding Airbnb License Requirements & STR Laws in Trevi (2025)
Yes, Trevi, Umbria, Italy enforces high STR regulations. Obtaining a license and ensuring compliance is almost certainly required according to current 2025 STR laws. Always verify the latest short term rental regulations and Airbnb license requirements directly with local government authorities for Trevi to ensure full compliance before hosting.
(Source: AirROI data, 2025, based on 53% licensed listings)
Top Performing Airbnb Properties in Trevi (2025)
Benchmark your potential! Explore examples of top-performing Airbnb properties in Trevibased on Trailing Twelve Month (TTM) revenue. Analyze their characteristics, revenue, occupancy rate, and ADR to understand what drives success in this market.
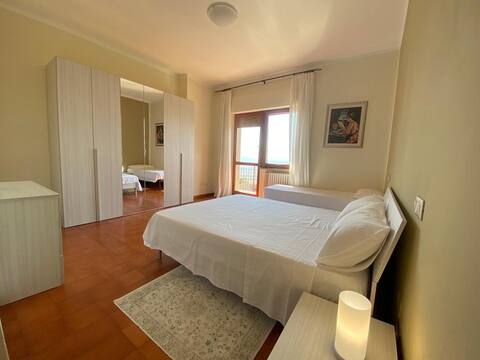
Casale in Via dei Condotti a Trevi
Entire Place • 4 bedrooms

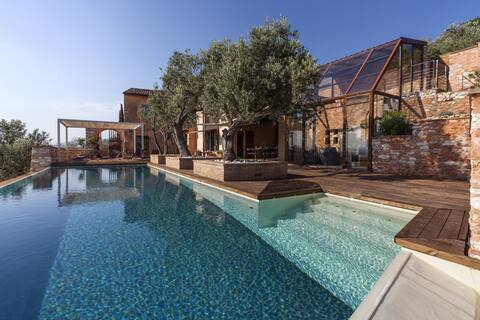
17th C. Villa Giulia: large panoramic pool, events
Entire Place • 8 bedrooms
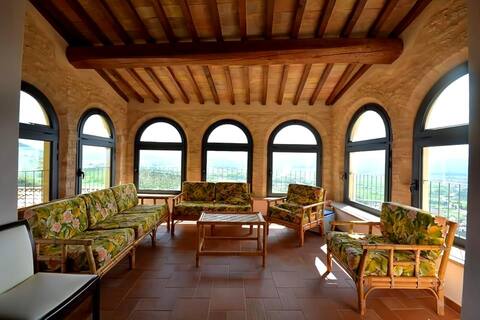
The Panorama of Trevi
Private Room • N/A
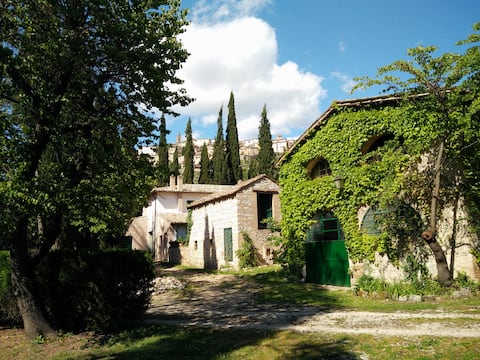
Antica Loggia
Entire Place • 3 bedrooms

Enjoy enchanting Umbria from a poetic cottage
Entire Place • 2 bedrooms
Hidden Gem in the Heart of Umbria
Entire Place • 1 bedroom
Note: Performance varies based on location, size, amenities, seasonality, and management quality. Data reflects the past 12 months.
Top Performing Airbnb Hosts in Trevi (2025)
Learn from the best! This table showcases top-performing Airbnb hosts in Trevi based on the number of properties managed and estimated total revenue over the past year. Analyze their scale and performance metrics.
| Host Name | Properties | Grossing Revenue | Stay Reviews | Avg Rating |
|---|---|---|---|---|
| Luana | 1 | $89,667 | 19 | 4.68/5.0 |
| Francesca Paola | 1 | $50,578 | 15 | 4.87/5.0 |
| Marcello | 4 | $36,262 | 110 | 4.82/5.0 |
| Edoardo | 1 | $27,504 | 5 | 4.80/5.0 |
| Claudio | 1 | $24,546 | 57 | 4.96/5.0 |
| Federico Maria | 2 | $20,834 | 35 | 2.43/5.0 |
| Raffaele | 1 | $18,842 | 67 | 4.94/5.0 |
| Flavia | 1 | $18,630 | 54 | 4.98/5.0 |
| Luca | 3 | $15,397 | 102 | 4.61/5.0 |
| Lauren | 3 | $15,335 | 13 | 4.95/5.0 |
Analyzing the strategies of top hosts, such as their property selection, pricing, and guest communication, can offer valuable lessons for optimizing your own Airbnb operations in Trevi.
Dive Deeper: Advanced Trevi STR Market Data (2025)
Ready to unlock more insights? AirROI provides access to advanced metrics and comprehensive Airbnb data for Trevi. Explore detailed analytics beyond this report to refine your investment strategy, optimize pricing, and maximize your vacation rental profits.
Explore Advanced MetricsTrevi Short-Term Rental Market Composition (2025): Property & Room Types
Room Type Distribution
Property Type Distribution
Market Composition Insights for Trevi
- The Trevi Airbnb market composition is heavily skewed towards Entire Home/Apt listings, which make up 95% of the 40 active rentals. This indicates strong guest preference for privacy and space.
- Looking at the property type distribution in Trevi, Apartment/Condo properties are the most common (62.5%), reflecting the local real estate landscape.
- Houses represent a significant 35% portion, catering likely to families or larger groups.
- Smaller segments like hotel/boutique (combined 2.5%) offer potential for unique stay experiences.
Trevi Airbnb Room Capacity Analysis (2025): Bedroom Distribution
Distribution of Listings by Number of Bedrooms
Room Capacity Insights for Trevi
- The dominant room capacity in Trevi is 1 bedroom listings, making up 52.5% of the market. This suggests a strong demand for properties suitable for couples or solo travelers.
- Together, 1 bedroom and 2 bedrooms properties represent 77.5% of the active Airbnb listings in Trevi, indicating a high concentration in these sizes.
- With over half the market (52.5%) consisting of studios or 1-bedroom units, Trevi is particularly well-suited for individuals or couples.
Trevi Vacation Rental Guest Capacity Trends (2025)
Distribution of Listings by Guest Capacity
Guest Capacity Insights for Trevi
- The most common guest capacity trend in Trevi vacation rentals is listings accommodating 2 guests (27.5%). This suggests the primary traveler segment is likely couples or solo travelers.
- Properties designed for 2 guests and 4 guests dominate the Trevi STR market, accounting for 52.5% of listings.
- 17.5% of properties accommodate 6+ guests, serving the market segment for larger families or group travel in Trevi.
- On average, properties in Trevi are equipped to host 3.9 guests.
Trevi Airbnb Booking Patterns (2025): Available vs. Booked Days
Available Days Distribution
Booked Days Distribution
Booking Pattern Insights for Trevi
- The most common availability pattern in Trevi falls within the 271-366 days range, representing 70% of listings. This suggests many properties have significant open periods on their calendars.
- Approximately 95.0% of listings show high availability (181+ days open annually), indicating potential for increased bookings or specific owner usage patterns.
- For booked days, the 31-90 days range is most frequent in Trevi (35%), reflecting common guest stay durations or potential owner blocking patterns.
- A notable 7.5% of properties secure long booking periods (181+ days booked per year), highlighting successful long-term rental strategies or significant owner usage.
Trevi Airbnb Minimum Stay Requirements Analysis
Distribution of Listings by Minimum Night Requirement
1 Night
7 listings
17.9% of total
2 Nights
13 listings
33.3% of total
3 Nights
5 listings
12.8% of total
4-6 Nights
4 listings
10.3% of total
7-29 Nights
4 listings
10.3% of total
30+ Nights
6 listings
15.4% of total
Key Insights
- The most prevalent minimum stay requirement in Trevi is 2 Nights, adopted by 33.3% of listings. This highlights the market's preference for shorter, flexible bookings.
- A significant segment (15.4%) caters to monthly stays (30+ nights) in Trevi, pointing to opportunities in the extended-stay market.
Recommendations
- Align with the market by considering a 2 Nights minimum stay, as 33.3% of Trevi hosts use this setting.
- If feasible, allowing 1-night stays, especially midweek or during low season, could capture last-minute bookings, as only 17.9% currently do.
- A 2-night minimum appears standard (33.3%). Consider this for weekends or peak periods.
- Explore offering discounts for stays of 30+ nights to attract the 15.4% of the market seeking extended stays.
- Adjust minimum nights based on seasonality – potentially shorter during low season and longer during peak demand periods in Trevi.
Trevi Airbnb Cancellation Policy Trends Analysis (2025)
Flexible
9 listings
26.5% of total
Moderate
20 listings
58.8% of total
Strict
5 listings
14.7% of total
Cancellation Policy Insights for Trevi
- The prevailing Airbnb cancellation policy trend in Trevi is Moderate, used by 58.8% of listings.
- The market strongly favors guest-friendly terms, with 85.3% of listings offering Flexible or Moderate policies. This suggests guests in Trevi may expect booking flexibility.
Recommendations for Hosts
- Consider adopting a Moderate policy to align with the 58.8% market standard in Trevi.
- Using a Strict policy might deter some guests, as only 14.7% of listings use it. Evaluate if potential revenue protection outweighs possible lower booking rates.
- Regularly review your cancellation policy against competitors and market demand shifts in Trevi.
Trevi STR Booking Lead Time Analysis (2025)
Average Booking Lead Time by Month
Booking Lead Time Insights for Trevi
- The overall average booking lead time for vacation rentals in Trevi is 56 days.
- Guests book furthest in advance for stays during April (average 79 days), likely coinciding with peak travel demand or local events.
- The shortest booking windows occur for stays in December (average 20 days), indicating more last-minute travel plans during this time.
- Seasonally, Summer (74 days avg.) sees the longest lead times, while Winter (24 days avg.) has the shortest, reflecting typical travel planning cycles.
Recommendations for Hosts
- Use the overall average lead time (56 days) as a baseline for your pricing and availability strategy in Trevi.
- For April stays, consider implementing length-of-stay discounts or slightly higher rates for bookings made less than 79 days out to capitalize on advance planning.
- Target marketing efforts for the Summer season well in advance (at least 74 days) to capture early planners.
- Monitor your own booking lead times against these Trevi averages to identify opportunities for dynamic pricing adjustments.
Popular & Essential Airbnb Amenities in Trevi (2025)
Amenity Prevalence
Amenity Insights for Trevi
- Essential amenities in Trevi that guests expect include: Essentials, Heating, Hair dryer. Lacking these (any) could significantly impact bookings.
- Popular amenities like Kitchen, Refrigerator, Hot water are common but not universal. Offering these can provide a competitive edge.
- Warning: Wifi is not universally provided but is considered essential globally. Ensure reliable Wifi is offered.
Recommendations for Hosts
- Ensure your listing includes all essential amenities for Trevi: Essentials, Heating, Hair dryer.
- Prioritize adding missing essentials: Essentials, Heating, Hair dryer.
- Consider adding popular differentiators like Kitchen or Refrigerator to increase appeal.
- Highlight unique or less common amenities you offer (e.g., hot tub, dedicated workspace, EV charger) in your listing description and photos.
- Regularly check competitor amenities in Trevi to stay competitive.
Trevi Airbnb Guest Demographics & Profile Analysis (2025)
Guest Profile Summary for Trevi
- The typical guest profile for Airbnb in Trevi consists of a mix of domestic (57%) and international guests, often arriving from nearby Rome, typically belonging to the Post-2000s (Gen Z/Alpha) group (50%), primarily speaking English or Italian.
- Domestic travelers account for 56.8% of guests.
- Key international markets include Italy (56.8%) and United States (8.8%).
- Top languages spoken are English (39.9%) followed by Italian (29.1%).
- A significant demographic segment is the Post-2000s (Gen Z/Alpha) group, representing 50% of guests.
Recommendations for Hosts
- Balance marketing efforts between domestic and international channels based on the guest mix.
- Tailor amenities and listing descriptions to appeal to the dominant Post-2000s (Gen Z/Alpha) demographic (e.g., highlight fast WiFi, smart home features, local guides).
- Highlight unique local experiences or amenities relevant to the primary guest profile.
- Consider seasonal promotions aligned with peak travel times for key origin markets.
Nearby Short-Term Rental Market Comparison
How does the Trevi Airbnb market stack up against its neighbors? Compare key performance metrics like average monthly revenue, ADR, and occupancy rates in surrounding areas to understand the broader regional STR landscape.
| Market | Active Properties | Monthly Revenue | Daily Rate | Avg. Occupancy |
|---|---|---|---|---|
| Tignano | 10 | $3,391 | $500.31 | 36% |
| Buonconvento | 59 | $3,068 | $456.70 | 46% |
| Rome | 23,290 | $2,898 | $208.87 | 51% |
| Collazzone | 28 | $2,839 | $341.11 | 36% |
| Florence | 9,598 | $2,833 | $208.48 | 52% |
| Marcialla | 25 | $2,788 | $236.61 | 54% |
| Parrano | 18 | $2,762 | $329.95 | 34% |
| Impruneta | 131 | $2,761 | $237.93 | 45% |
| Marciano della Chiana | 18 | $2,719 | $377.32 | 35% |
| Gaiole in Chianti | 206 | $2,679 | $344.49 | 39% |