San Venanzo Airbnb Market Analysis 2025: Short Term Rental Data & Vacation Rental Statistics in Umbria, Italy
Is Airbnb profitable in San Venanzo in 2025? Explore comprehensive Airbnb analytics for San Venanzo, Umbria, Italy to uncover income potential. This 2025 STR market report for San Venanzo, based on AirROI data from April 2024 to March 2025, reveals key trends in the niche market of 56 active listings.
Whether you're considering an Airbnb investment in San Venanzo, optimizing your existing vacation rental, or exploring rental arbitrage opportunities, understanding the San Venanzo Airbnb data is crucial. Navigating the high regulation landscape is key to maximizing your short term rental income potential. Let's dive into the specifics.
Key San Venanzo Airbnb Performance Metrics Overview
Monthly Airbnb Revenue Variations & Income Potential in San Venanzo (2025)
Understanding the monthly revenue variations for Airbnb listings in San Venanzo is key to maximizing your short term rental income potential. Seasonality significantly impacts earnings. Our analysis, based on data from the past 12 months, shows that the peak revenue month for STRs in San Venanzo is typically August, while February often presents the lowest earnings, highlighting opportunities for strategic pricing adjustments during shoulder and low seasons. Explore the typical Airbnb income in San Venanzo across different performance tiers:
- Best-in-class properties (Top 10%) achieve $5,498+ monthly, often utilizing dynamic pricing and superior guest experiences.
- Strong performing properties (Top 25%) earn $3,110 or more, indicating effective management and desirable locations/amenities.
- Typical properties (Median) generate around $1,581 per month, representing the average market performance.
- Entry-level properties (Bottom 25%) see earnings around $840, often with potential for optimization.
Average Monthly Airbnb Earnings Trend in San Venanzo
San Venanzo Airbnb Occupancy Rate Trends (2025)
Maximize your bookings by understanding the San Venanzo STR occupancy trends. Seasonal demand shifts significantly influence how often properties are booked. Typically, Augustsees the highest demand (peak season occupancy), while February experiences the lowest (low season). Effective strategies, like adjusting minimum stays or offering promotions, can boost occupancy during slower periods. Here's how different property tiers perform in San Venanzo:
- Best-in-class properties (Top 10%) achieve 67%+ occupancy, indicating high desirability and potentially optimized availability.
- Strong performing properties (Top 25%) maintain 51% or higher occupancy, suggesting good market fit and guest satisfaction.
- Typical properties (Median) have an occupancy rate around 31%.
- Entry-level properties (Bottom 25%) average 13% occupancy, potentially facing higher vacancy.
Average Monthly Occupancy Rate Trend in San Venanzo
Average Daily Rate (ADR) Airbnb Trends in San Venanzo (2025)
Effective short term rental pricing strategy in San Venanzo involves understanding monthly ADR fluctuations. The Average Daily Rate (ADR) for Airbnb in San Venanzo typically peaks in July and dips lowest during February. Leveraging Airbnb dynamic pricing tools or strategies based on this seasonality can significantly boost revenue. Here's a look at the typical nightly rates achieved:
- Best-in-class properties (Top 10%) command rates of $516+ per night, often due to premium features or locations.
- Strong performing properties (Top 25%) achieve nightly rates of $301 or more.
- Typical properties (Median) charge around $154 per night.
- Entry-level properties (Bottom 25%) earn around $110 per night.
Average Daily Rate (ADR) Trend by Month in San Venanzo
Get Live San Venanzo Market Intelligence 👇

Explore Real-time Analytics
Airbnb Seasonality Analysis & Trends in San Venanzo (2025)
Peak Season (August, July, May)
- Revenue averages $4,109 per month
- Occupancy rates average 52.1%
- Daily rates average $285
Shoulder Season
- Revenue averages $2,332 per month
- Occupancy maintains around 35.1%
- Daily rates hold near $254
Low Season (January, February, March)
- Revenue drops to average $743 per month
- Occupancy decreases to average 14.7%
- Daily rates adjust to average $205
Seasonality Insights for San Venanzo
- The Airbnb seasonality in San Venanzo shows highly seasonal trends requiring careful strategy. While the sections above show seasonal averages, it's also insightful to look at the extremes:
- During the high season, the absolute peak month showcases San Venanzo's highest earning potential, with monthly revenues capable of climbing to $4,298, occupancy reaching a high of 58.2%, and ADRs peaking at $293.
- Conversely, the slowest single month of the year, typically falling within the low season, marks the market's lowest point. In this month, revenue might dip to $678, occupancy could drop to 12.1%, and ADRs may adjust down to $202.
- Understanding both the seasonal averages and these monthly peaks and troughs in revenue, occupancy, and ADR is crucial for maximizing your Airbnb profit potential in San Venanzo.
Seasonal Strategies for Maximizing Profit
- Peak Season: Maximize revenue through premium pricing and potentially longer minimum stays. Ensure high availability.
- Low Season: Offer competitive pricing, special promotions (e.g., extended stay discounts), and flexible cancellation policies. Target off-season travelers like remote workers or budget-conscious guests.
- Shoulder Seasons: Implement dynamic pricing that balances peak and low rates. Target weekend travelers or specific events. Offer slightly more flexible terms than peak season.
- Regularly analyze your own performance against these San Venanzo seasonality benchmarks and adjust your pricing and availability strategy accordingly.
Best Areas for Airbnb Investment in San Venanzo (2025)
Exploring the top neighborhoods for short-term rentals in San Venanzo? This section highlights key areas, outlining why they are attractive for hosts and guests, along with notable local attractions. Consider these locations based on your target guest profile and investment strategy.
| Neighborhood / Area | Why Host Here? (Target Guests & Appeal) | Key Attractions & Landmarks |
|---|---|---|
| San Venanzo Historic Center | Charming historic area with medieval architecture and lovely town square. Ideal for travelers seeking a quaint Italian village experience, close to local shops and restaurants. | San Venanzo Historical Museum, San Bartolomeo Church, local artisan shops, beautiful countryside views, Parks and walking trails |
| Surrounding Vineyards | San Venanzo is surrounded by picturesque vineyards and olive groves, attracting wine lovers and those looking for agritourism experiences. Perfect for travelers interested in wine tasting and rural tourism. | Wine tasting tours, Antique and rustic charm of vineyards, Picnicking in the vineyards, Local farmer markets, Olive oil tastings |
| Natural Parks and Trails | The area around San Venanzo boasts beautiful natural parks and hiking trails, appealing to nature enthusiasts and outdoor lovers. An excellent choice for those looking to explore Italy's natural beauty. | Monti Martani Regional Park, Walking and hiking trails, Biking routes, Scenic viewpoints, Nature photography |
| Historical Villages Nearby | Nearby historical villages offer cultural and historical exploration opportunities, perfect for tourists looking for day trips to explore Umbria's rich history and architecture. | Todi, Deruta, Orvieto, Local museums, Historic churches |
| Local Cuisine Experiences | The region is known for its delicious Umbrian cuisine, attracting foodies and culinary tourists. Great for hosting food-centric stays or culinary classes. | Traditional restaurants, Cooking classes, Local food festivals, Food markets, Gastronomy tours |
| Art and Culture Hub | San Venanzo has a vibrant local art scene, with galleries and cultural events that attract art lovers and cultural enthusiasts. Ideal for those seeking a creative stay. | Art exhibitions, Cultural festivals, Local artisan workshops, Street art, Music and theater events |
| Wellness Retreats | With its serene environment, San Venanzo is perfect for wellness retreats and relaxation-focused experiences. Great for travelers looking for healing and rejuvenation. | Spa facilities, Yoga retreats, Nature therapy, Meditation centers, Peaceful surroundings |
| Adventure Sports | The surrounding landscape offers various adventure sports opportunities, attracting thrill-seekers and active travelers. Host stays that offer outdoor adventures like hiking and cycling. | Mountain biking, Rock climbing, Kayaking on the Tiber, Adventure tours, Outdoor sports equipment rentals |
Understanding Airbnb License Requirements & STR Laws in San Venanzo (2025)
Yes, San Venanzo, Umbria, Italy enforces high STR regulations. Obtaining a license and ensuring compliance is almost certainly required according to current 2025 STR laws. Always verify the latest short term rental regulations and Airbnb license requirements directly with local government authorities for San Venanzo to ensure full compliance before hosting.
(Source: AirROI data, 2025, based on 73% licensed listings)
Top Performing Airbnb Properties in San Venanzo (2025)
Benchmark your potential! Explore examples of top-performing Airbnb properties in San Venanzobased on Trailing Twelve Month (TTM) revenue. Analyze their characteristics, revenue, occupancy rate, and ADR to understand what drives success in this market.
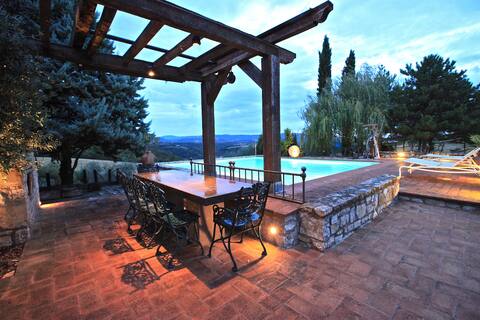
Casa Boschetto, villa with private pool
Entire Place • 5 bedrooms
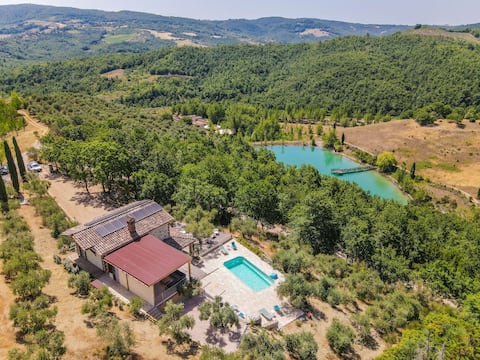
Villa with pool and hot tub
Entire Place • 4 bedrooms

Casale Moderno with swimming pool
Entire Place • 2 bedrooms
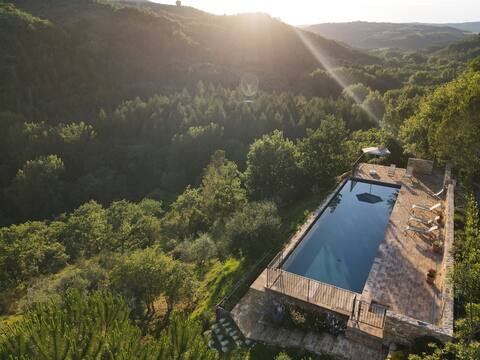
Lovely Stonehouse with Infinity swimming pool
Entire Place • 4 bedrooms
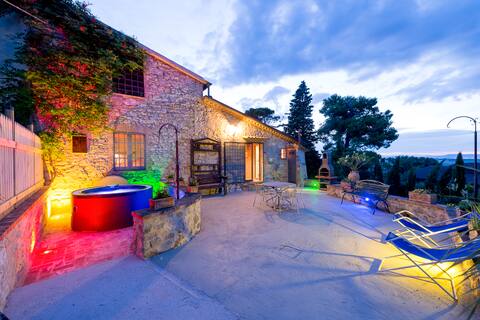
Il Granaio, villa with jacuzzi and pool
Entire Place • 2 bedrooms
Panoramic Country Retreat with Pool
Entire Place • 4 bedrooms
Note: Performance varies based on location, size, amenities, seasonality, and management quality. Data reflects the past 12 months.
Top Performing Airbnb Hosts in San Venanzo (2025)
Learn from the best! This table showcases top-performing Airbnb hosts in San Venanzo based on the number of properties managed and estimated total revenue over the past year. Analyze their scale and performance metrics.
| Host Name | Properties | Grossing Revenue | Stay Reviews | Avg Rating |
|---|---|---|---|---|
| Case Nucci | 4 | $154,921 | 399 | 4.88/5.0 |
| Monica | 4 | $90,745 | 52 | 3.75/5.0 |
| Pietro | 5 | $90,267 | 83 | 4.90/5.0 |
| Novasol | 5 | $79,823 | 72 | 4.74/5.0 |
| Guido Paul | 1 | $60,393 | 14 | 4.79/5.0 |
| Roberto | 1 | $59,558 | 25 | 4.84/5.0 |
| Piero | 3 | $56,718 | 93 | 4.92/5.0 |
| Mathias & Aurelie | 1 | $54,536 | 28 | 4.89/5.0 |
| Belinda | 1 | $49,430 | 29 | 5.00/5.0 |
| Manfredi | 1 | $45,286 | 53 | 4.94/5.0 |
Analyzing the strategies of top hosts, such as their property selection, pricing, and guest communication, can offer valuable lessons for optimizing your own Airbnb operations in San Venanzo.
Dive Deeper: Advanced San Venanzo STR Market Data (2025)
Ready to unlock more insights? AirROI provides access to advanced metrics and comprehensive Airbnb data for San Venanzo. Explore detailed analytics beyond this report to refine your investment strategy, optimize pricing, and maximize your vacation rental profits.
Explore Advanced MetricsSan Venanzo Short-Term Rental Market Composition (2025): Property & Room Types
Room Type Distribution
Property Type Distribution
Market Composition Insights for San Venanzo
- The San Venanzo Airbnb market composition is heavily skewed towards Entire Home/Apt listings, which make up 100% of the 56 active rentals. This indicates strong guest preference for privacy and space.
- Looking at the property type distribution in San Venanzo, House properties are the most common (41.1%), reflecting the local real estate landscape.
- Houses represent a significant 41.1% portion, catering likely to families or larger groups.
San Venanzo Airbnb Room Capacity Analysis (2025): Bedroom Distribution
Distribution of Listings by Number of Bedrooms
Room Capacity Insights for San Venanzo
- The dominant room capacity in San Venanzo is 2 bedrooms listings, making up 44.6% of the market. This suggests a strong demand for properties suitable for couples or solo travelers.
- Together, 2 bedrooms and 1 bedroom properties represent 69.6% of the active Airbnb listings in San Venanzo, indicating a high concentration in these sizes.
- A significant 30.3% of listings offer 3+ bedrooms, catering to larger groups and families seeking more space in San Venanzo.
San Venanzo Vacation Rental Guest Capacity Trends (2025)
Distribution of Listings by Guest Capacity
Guest Capacity Insights for San Venanzo
- The most common guest capacity trend in San Venanzo vacation rentals is listings accommodating 4 guests (28.6%). This suggests the primary traveler segment is likely small families or groups.
- Properties designed for 4 guests and 6 guests dominate the San Venanzo STR market, accounting for 55.4% of listings.
- 55.4% of properties accommodate 6+ guests, serving the market segment for larger families or group travel in San Venanzo.
- On average, properties in San Venanzo are equipped to host 5.6 guests.
San Venanzo Airbnb Booking Patterns (2025): Available vs. Booked Days
Available Days Distribution
Booked Days Distribution
Booking Pattern Insights for San Venanzo
- The most common availability pattern in San Venanzo falls within the 271-366 days range, representing 50% of listings. This suggests many properties have significant open periods on their calendars.
- Approximately 89.3% of listings show high availability (181+ days open annually), indicating potential for increased bookings or specific owner usage patterns.
- For booked days, the 91-180 days range is most frequent in San Venanzo (39.3%), reflecting common guest stay durations or potential owner blocking patterns.
- A notable 10.7% of properties secure long booking periods (181+ days booked per year), highlighting successful long-term rental strategies or significant owner usage.
San Venanzo Airbnb Minimum Stay Requirements Analysis
Distribution of Listings by Minimum Night Requirement
1 Night
14 listings
25.9% of total
2 Nights
9 listings
16.7% of total
3 Nights
19 listings
35.2% of total
4-6 Nights
7 listings
13% of total
7-29 Nights
2 listings
3.7% of total
30+ Nights
3 listings
5.6% of total
Key Insights
- The most prevalent minimum stay requirement in San Venanzo is 3 Nights, adopted by 35.2% of listings. This highlights the market's preference for longer commitments.
Recommendations
- Align with the market by considering a 3 Nights minimum stay, as 35.2% of San Venanzo hosts use this setting.
- If feasible, allowing 1-night stays, especially midweek or during low season, could capture last-minute bookings, as only 25.9% currently do.
- Explore offering discounts for stays of 30+ nights to attract the 5.6% of the market seeking extended stays.
- Adjust minimum nights based on seasonality – potentially shorter during low season and longer during peak demand periods in San Venanzo.
San Venanzo Airbnb Cancellation Policy Trends Analysis (2025)
Super Strict 60 Days
10 listings
17.9% of total
Super Strict 30 Days
2 listings
3.6% of total
Flexible
9 listings
16.1% of total
Moderate
19 listings
33.9% of total
Strict
16 listings
28.6% of total
Cancellation Policy Insights for San Venanzo
- The prevailing Airbnb cancellation policy trend in San Venanzo is Moderate, used by 33.9% of listings.
- There's a relatively balanced mix between guest-friendly (50.0%) and stricter (28.6%) policies, offering choices for different guest needs.
Recommendations for Hosts
- Consider adopting a Moderate policy to align with the 33.9% market standard in San Venanzo.
- Regularly review your cancellation policy against competitors and market demand shifts in San Venanzo.
San Venanzo STR Booking Lead Time Analysis (2025)
Average Booking Lead Time by Month
Booking Lead Time Insights for San Venanzo
- The overall average booking lead time for vacation rentals in San Venanzo is 95 days.
- Guests book furthest in advance for stays during November (average 142 days), likely coinciding with peak travel demand or local events.
- The shortest booking windows occur for stays in March (average 30 days), indicating more last-minute travel plans during this time.
- Seasonally, Fall (113 days avg.) sees the longest lead times, while Winter (58 days avg.) has the shortest, reflecting typical travel planning cycles.
Recommendations for Hosts
- Use the overall average lead time (95 days) as a baseline for your pricing and availability strategy in San Venanzo.
- For November stays, consider implementing length-of-stay discounts or slightly higher rates for bookings made less than 142 days out to capitalize on advance planning.
- Target marketing efforts for the Fall season well in advance (at least 113 days) to capture early planners.
- Monitor your own booking lead times against these San Venanzo averages to identify opportunities for dynamic pricing adjustments.
Popular & Essential Airbnb Amenities in San Venanzo (2025)
Amenity Prevalence
Amenity Insights for San Venanzo
- Essential amenities in San Venanzo that guests expect include: Kitchen, Wifi, Free parking on premises. Lacking these (any) could significantly impact bookings.
- Popular amenities like Dishes and silverware, Heating, Hangers are common but not universal. Offering these can provide a competitive edge.
Recommendations for Hosts
- Ensure your listing includes all essential amenities for San Venanzo: Kitchen, Wifi, Free parking on premises.
- Prioritize adding missing essentials: Wifi, Free parking on premises.
- Consider adding popular differentiators like Dishes and silverware or Heating to increase appeal.
- Highlight unique or less common amenities you offer (e.g., hot tub, dedicated workspace, EV charger) in your listing description and photos.
- Regularly check competitor amenities in San Venanzo to stay competitive.
San Venanzo Airbnb Guest Demographics & Profile Analysis (2025)
Guest Profile Summary for San Venanzo
- The typical guest profile for Airbnb in San Venanzo consists of predominantly international visitors (73%), with top international origins including Germany, typically belonging to the Post-2000s (Gen Z/Alpha) group (50%), primarily speaking English or Italian.
- Domestic travelers account for 27.5% of guests.
- Key international markets include Italy (27.5%) and Germany (17.4%).
- Top languages spoken are English (37.5%) followed by Italian (16.6%).
- A significant demographic segment is the Post-2000s (Gen Z/Alpha) group, representing 50% of guests.
Recommendations for Hosts
- Focus marketing internationally, particularly towards travelers from Germany.
- Tailor amenities and listing descriptions to appeal to the dominant Post-2000s (Gen Z/Alpha) demographic (e.g., highlight fast WiFi, smart home features, local guides).
- Highlight unique local experiences or amenities relevant to the primary guest profile.
- Consider seasonal promotions aligned with peak travel times for key origin markets.
Nearby Short-Term Rental Market Comparison
How does the San Venanzo Airbnb market stack up against its neighbors? Compare key performance metrics like average monthly revenue, ADR, and occupancy rates in surrounding areas to understand the broader regional STR landscape.
| Market | Active Properties | Monthly Revenue | Daily Rate | Avg. Occupancy |
|---|---|---|---|---|
| Tignano | 10 | $3,391 | $500.31 | 36% |
| Buonconvento | 59 | $3,068 | $456.70 | 46% |
| Rome | 23,290 | $2,898 | $208.87 | 51% |
| Collazzone | 28 | $2,839 | $341.11 | 36% |
| Florence | 9,598 | $2,833 | $208.48 | 52% |
| Marcialla | 25 | $2,788 | $236.61 | 54% |
| Parrano | 18 | $2,762 | $329.95 | 34% |
| Impruneta | 131 | $2,761 | $237.93 | 45% |
| Marciano della Chiana | 18 | $2,719 | $377.32 | 35% |
| Gaiole in Chianti | 206 | $2,679 | $344.49 | 39% |