Gubbio Airbnb Market Analysis 2025: Short Term Rental Data & Vacation Rental Statistics in Umbria, Italy
Is Airbnb profitable in Gubbio in 2025? Explore comprehensive Airbnb analytics for Gubbio, Umbria, Italy to uncover income potential. This 2025 STR market report for Gubbio, based on AirROI data from April 2024 to March 2025, reveals key trends in the niche market of 162 active listings.
Whether you're considering an Airbnb investment in Gubbio, optimizing your existing vacation rental, or exploring rental arbitrage opportunities, understanding the Gubbio Airbnb data is crucial. Navigating the high regulation landscape is key to maximizing your short term rental income potential. Let's dive into the specifics.
Key Gubbio Airbnb Performance Metrics Overview
Monthly Airbnb Revenue Variations & Income Potential in Gubbio (2025)
Understanding the monthly revenue variations for Airbnb listings in Gubbio is key to maximizing your short term rental income potential. Seasonality significantly impacts earnings. Our analysis, based on data from the past 12 months, shows that the peak revenue month for STRs in Gubbio is typically August, while February often presents the lowest earnings, highlighting opportunities for strategic pricing adjustments during shoulder and low seasons. Explore the typical Airbnb income in Gubbio across different performance tiers:
- Best-in-class properties (Top 10%) achieve $3,199+ monthly, often utilizing dynamic pricing and superior guest experiences.
- Strong performing properties (Top 25%) earn $1,885 or more, indicating effective management and desirable locations/amenities.
- Typical properties (Median) generate around $1,048 per month, representing the average market performance.
- Entry-level properties (Bottom 25%) see earnings around $509, often with potential for optimization.
Average Monthly Airbnb Earnings Trend in Gubbio
Gubbio Airbnb Occupancy Rate Trends (2025)
Maximize your bookings by understanding the Gubbio STR occupancy trends. Seasonal demand shifts significantly influence how often properties are booked. Typically, Augustsees the highest demand (peak season occupancy), while March experiences the lowest (low season). Effective strategies, like adjusting minimum stays or offering promotions, can boost occupancy during slower periods. Here's how different property tiers perform in Gubbio:
- Best-in-class properties (Top 10%) achieve 59%+ occupancy, indicating high desirability and potentially optimized availability.
- Strong performing properties (Top 25%) maintain 40% or higher occupancy, suggesting good market fit and guest satisfaction.
- Typical properties (Median) have an occupancy rate around 23%.
- Entry-level properties (Bottom 25%) average 12% occupancy, potentially facing higher vacancy.
Average Monthly Occupancy Rate Trend in Gubbio
Average Daily Rate (ADR) Airbnb Trends in Gubbio (2025)
Effective short term rental pricing strategy in Gubbio involves understanding monthly ADR fluctuations. The Average Daily Rate (ADR) for Airbnb in Gubbio typically peaks in July and dips lowest during February. Leveraging Airbnb dynamic pricing tools or strategies based on this seasonality can significantly boost revenue. Here's a look at the typical nightly rates achieved:
- Best-in-class properties (Top 10%) command rates of $362+ per night, often due to premium features or locations.
- Strong performing properties (Top 25%) achieve nightly rates of $183 or more.
- Typical properties (Median) charge around $123 per night.
- Entry-level properties (Bottom 25%) earn around $88 per night.
Average Daily Rate (ADR) Trend by Month in Gubbio
Get Live Gubbio Market Intelligence 👇

Explore Real-time Analytics
Airbnb Seasonality Analysis & Trends in Gubbio (2025)
Peak Season (August, July, May)
- Revenue averages $2,497 per month
- Occupancy rates average 39.1%
- Daily rates average $227
Shoulder Season
- Revenue averages $1,629 per month
- Occupancy maintains around 28.3%
- Daily rates hold near $208
Low Season (January, February, March)
- Revenue drops to average $649 per month
- Occupancy decreases to average 17.4%
- Daily rates adjust to average $174
Seasonality Insights for Gubbio
- The Airbnb seasonality in Gubbio shows highly seasonal trends requiring careful strategy. While the sections above show seasonal averages, it's also insightful to look at the extremes:
- During the high season, the absolute peak month showcases Gubbio's highest earning potential, with monthly revenues capable of climbing to $2,896, occupancy reaching a high of 46.6%, and ADRs peaking at $229.
- Conversely, the slowest single month of the year, typically falling within the low season, marks the market's lowest point. In this month, revenue might dip to $534, occupancy could drop to 16.2%, and ADRs may adjust down to $172.
- Understanding both the seasonal averages and these monthly peaks and troughs in revenue, occupancy, and ADR is crucial for maximizing your Airbnb profit potential in Gubbio.
Seasonal Strategies for Maximizing Profit
- Peak Season: Maximize revenue through premium pricing and potentially longer minimum stays. Ensure high availability.
- Low Season: Offer competitive pricing, special promotions (e.g., extended stay discounts), and flexible cancellation policies. Target off-season travelers like remote workers or budget-conscious guests.
- Shoulder Seasons: Implement dynamic pricing that balances peak and low rates. Target weekend travelers or specific events. Offer slightly more flexible terms than peak season.
- Regularly analyze your own performance against these Gubbio seasonality benchmarks and adjust your pricing and availability strategy accordingly.
Best Areas for Airbnb Investment in Gubbio (2025)
Exploring the top neighborhoods for short-term rentals in Gubbio? This section highlights key areas, outlining why they are attractive for hosts and guests, along with notable local attractions. Consider these locations based on your target guest profile and investment strategy.
| Neighborhood / Area | Why Host Here? (Target Guests & Appeal) | Key Attractions & Landmarks |
|---|---|---|
| Historic Center | The picturesque medieval heart of Gubbio, full of stunning architecture and rich history. Perfect for tourists who want to immerse themselves in the local culture and enjoy breathtaking views of the surrounding hills. | Piazza Grande, Palazzo dei Consoli, Gubbio Roman Theater, Church of San Francesco, Eugubine Tablets |
| Piazza 40 Martiri | A vibrant area with restaurants, cafes, and shops, making it a popular spot for both locals and tourists. Ideal for guests seeking convenience and local flavor. | Cafes and restaurants, Shopping, Cultural events held in the square, Local artisan shops |
| Via dei Consoli | A charming street lined with historical buildings, perfect for guests wanting a quiet yet central place to stay. Visitors can enjoy easy access to several attractions on foot. | Palazzo del Capitano del Popolo, Sculptures and historic markers, Strolls with scenic views |
| San Martino | A residential area that offers a mix of local life and close proximity to Gubbio's main attractions. A good choice for longer stays with families or groups. | Local markets, Parks and open spaces, Family-run restaurants |
| Mount Ingino | For nature lovers and outdoor enthusiasts, this area provides a fantastic location for hiking and enjoying the stunning Umbrian landscapes. An ideal retreat for those seeking tranquility. | Hiking trails, Scenic overlooks, Natural parks |
| Fantovaglia | A quieter, suburban area that offers a more relaxed atmosphere while still being a short distance from Gubbio's main sights. Great for travelers looking for peace and quiet. | Quiet residential views, Outdoor activities, Local wineries |
| Via della Repubblica | This street is close to local markets and offers a lively atmosphere, perfect for those wanting a taste of everyday life in Gubbio. Attractive to tourists wishing to blend in with locals. | Market days, Small local shops, Cafes with outdoor seating |
| Gubbio Golf Club | An appealing area for golf lovers and those looking for leisure activities, surrounded by beautiful scenery. Attracts guests looking for a sporting holiday. | Golf courses, Clubhouse events, Scenic golf views |
Understanding Airbnb License Requirements & STR Laws in Gubbio (2025)
Yes, Gubbio, Umbria, Italy enforces high STR regulations. Obtaining a license and ensuring compliance is almost certainly required according to current 2025 STR laws. Always verify the latest short term rental regulations and Airbnb license requirements directly with local government authorities for Gubbio to ensure full compliance before hosting.
(Source: AirROI data, 2025, based on 56% licensed listings)
Top Performing Airbnb Properties in Gubbio (2025)
Benchmark your potential! Explore examples of top-performing Airbnb properties in Gubbiobased on Trailing Twelve Month (TTM) revenue. Analyze their characteristics, revenue, occupancy rate, and ADR to understand what drives success in this market.
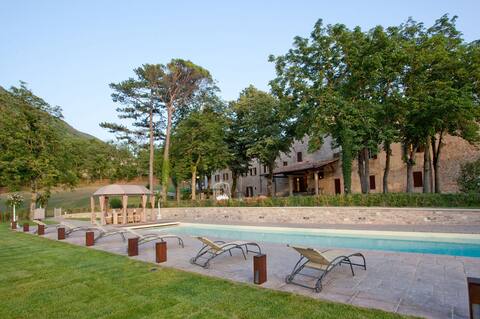
Villa Benveduti
Entire Place • 10 bedrooms
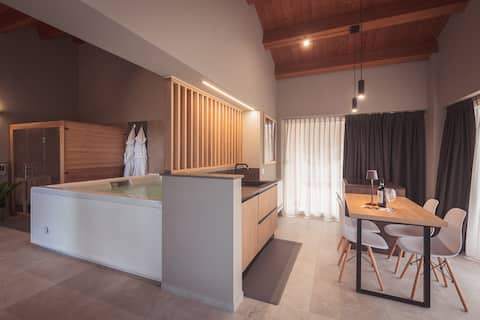
Agriturismo Querceto with Umbria pool
Entire Place • 1 bedroom
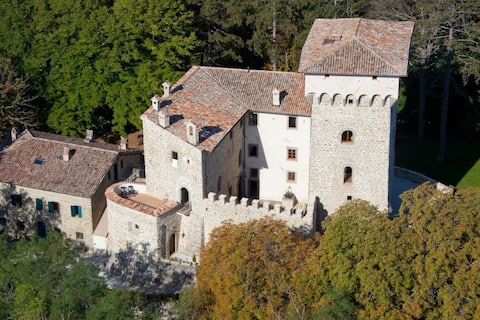
Gubbio's Finest Castle
Entire Place • 15 bedrooms
Casalotto Franciscan
Entire Place • 4 bedrooms
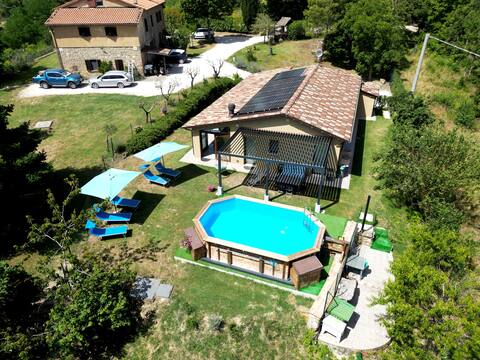
Surrounded by greenery a few minutes from downtown.
Entire Place • 3 bedrooms
Romantic Apartment Chicco di Grano - Superior
Entire Place • 1 bedroom
Note: Performance varies based on location, size, amenities, seasonality, and management quality. Data reflects the past 12 months.
Top Performing Airbnb Hosts in Gubbio (2025)
Learn from the best! This table showcases top-performing Airbnb hosts in Gubbio based on the number of properties managed and estimated total revenue over the past year. Analyze their scale and performance metrics.
| Host Name | Properties | Grossing Revenue | Stay Reviews | Avg Rating |
|---|---|---|---|---|
| Silvia | 4 | $80,634 | 48 | 4.96/5.0 |
| Silvia | 5 | $79,713 | 42 | 3.99/5.0 |
| Novasol | 4 | $77,129 | 71 | 4.68/5.0 |
| Host #137790683 | 1 | $71,133 | 0 | 0.00/5.0 |
| Susanna | 5 | $68,413 | 85 | 4.93/5.0 |
| Giuseppe | 4 | $54,939 | 38 | 4.80/5.0 |
| Claudia | 4 | $48,827 | 35 | 4.89/5.0 |
| Loreno | 5 | $40,953 | 110 | 2.98/5.0 |
| Diego | 4 | $33,260 | 37 | 4.79/5.0 |
| Host #2770598 | 1 | $32,789 | 0 | 0.00/5.0 |
Analyzing the strategies of top hosts, such as their property selection, pricing, and guest communication, can offer valuable lessons for optimizing your own Airbnb operations in Gubbio.
Dive Deeper: Advanced Gubbio STR Market Data (2025)
Ready to unlock more insights? AirROI provides access to advanced metrics and comprehensive Airbnb data for Gubbio. Explore detailed analytics beyond this report to refine your investment strategy, optimize pricing, and maximize your vacation rental profits.
Explore Advanced MetricsGubbio Short-Term Rental Market Composition (2025): Property & Room Types
Room Type Distribution
Property Type Distribution
Market Composition Insights for Gubbio
- The Gubbio Airbnb market composition is heavily skewed towards Entire Home/Apt listings, which make up 87% of the 162 active rentals. This indicates strong guest preference for privacy and space.
- Looking at the property type distribution in Gubbio, Apartment/Condo properties are the most common (59.9%), reflecting the local real estate landscape.
- Houses represent a significant 26.5% portion, catering likely to families or larger groups.
- Smaller segments like hotel/boutique, unique stays, others (combined 7.4%) offer potential for unique stay experiences.
Gubbio Airbnb Room Capacity Analysis (2025): Bedroom Distribution
Distribution of Listings by Number of Bedrooms
Room Capacity Insights for Gubbio
- The dominant room capacity in Gubbio is 1 bedroom listings, making up 44.4% of the market. This suggests a strong demand for properties suitable for couples or solo travelers.
- Together, 1 bedroom and 2 bedrooms properties represent 70.3% of the active Airbnb listings in Gubbio, indicating a high concentration in these sizes.
- A significant 22.9% of listings offer 3+ bedrooms, catering to larger groups and families seeking more space in Gubbio.
Gubbio Vacation Rental Guest Capacity Trends (2025)
Distribution of Listings by Guest Capacity
Guest Capacity Insights for Gubbio
- The most common guest capacity trend in Gubbio vacation rentals is listings accommodating 4 guests (33.3%). This suggests the primary traveler segment is likely small families or groups.
- Properties designed for 4 guests and 6 guests dominate the Gubbio STR market, accounting for 47.5% of listings.
- 29.1% of properties accommodate 6+ guests, serving the market segment for larger families or group travel in Gubbio.
- On average, properties in Gubbio are equipped to host 4.3 guests.
Gubbio Airbnb Booking Patterns (2025): Available vs. Booked Days
Available Days Distribution
Booked Days Distribution
Booking Pattern Insights for Gubbio
- The most common availability pattern in Gubbio falls within the 271-366 days range, representing 71.6% of listings. This suggests many properties have significant open periods on their calendars.
- Approximately 93.8% of listings show high availability (181+ days open annually), indicating potential for increased bookings or specific owner usage patterns.
- For booked days, the 31-90 days range is most frequent in Gubbio (42.6%), reflecting common guest stay durations or potential owner blocking patterns.
- A notable 6.2% of properties secure long booking periods (181+ days booked per year), highlighting successful long-term rental strategies or significant owner usage.
Gubbio Airbnb Minimum Stay Requirements Analysis
Distribution of Listings by Minimum Night Requirement
1 Night
66 listings
42.9% of total
2 Nights
48 listings
31.2% of total
3 Nights
9 listings
5.8% of total
4-6 Nights
4 listings
2.6% of total
7-29 Nights
16 listings
10.4% of total
30+ Nights
11 listings
7.1% of total
Key Insights
- The most prevalent minimum stay requirement in Gubbio is 1 Night, adopted by 42.9% of listings. This highlights the market's preference for shorter, flexible bookings.
- A strong majority (74.1%) of the Gubbio Airbnb data shows acceptance of very short stays (1-2 nights), indicating a dynamic, high-turnover market.
Recommendations
- Align with the market by considering a 1 Night minimum stay, as 42.9% of Gubbio hosts use this setting.
- Explore offering discounts for stays of 30+ nights to attract the 7.1% of the market seeking extended stays.
- Adjust minimum nights based on seasonality – potentially shorter during low season and longer during peak demand periods in Gubbio.
Gubbio Airbnb Cancellation Policy Trends Analysis (2025)
Super Strict 30 Days
10 listings
7.7% of total
Super Strict 60 Days
11 listings
8.5% of total
Flexible
37 listings
28.5% of total
Moderate
55 listings
42.3% of total
Strict
17 listings
13.1% of total
Cancellation Policy Insights for Gubbio
- The prevailing Airbnb cancellation policy trend in Gubbio is Moderate, used by 42.3% of listings.
- The market strongly favors guest-friendly terms, with 70.8% of listings offering Flexible or Moderate policies. This suggests guests in Gubbio may expect booking flexibility.
Recommendations for Hosts
- Consider adopting a Moderate policy to align with the 42.3% market standard in Gubbio.
- Using a Strict policy might deter some guests, as only 13.1% of listings use it. Evaluate if potential revenue protection outweighs possible lower booking rates.
- Regularly review your cancellation policy against competitors and market demand shifts in Gubbio.
Gubbio STR Booking Lead Time Analysis (2025)
Average Booking Lead Time by Month
Booking Lead Time Insights for Gubbio
- The overall average booking lead time for vacation rentals in Gubbio is 58 days.
- Guests book furthest in advance for stays during May (average 114 days), likely coinciding with peak travel demand or local events.
- The shortest booking windows occur for stays in February (average 22 days), indicating more last-minute travel plans during this time.
- Seasonally, Spring (79 days avg.) sees the longest lead times, while Winter (38 days avg.) has the shortest, reflecting typical travel planning cycles.
Recommendations for Hosts
- Use the overall average lead time (58 days) as a baseline for your pricing and availability strategy in Gubbio.
- For May stays, consider implementing length-of-stay discounts or slightly higher rates for bookings made less than 114 days out to capitalize on advance planning.
- Target marketing efforts for the Spring season well in advance (at least 79 days) to capture early planners.
- Monitor your own booking lead times against these Gubbio averages to identify opportunities for dynamic pricing adjustments.
Popular & Essential Airbnb Amenities in Gubbio (2025)
Amenity Prevalence
Amenity Insights for Gubbio
- Popular amenities like Heating, Kitchen, Essentials are common but not universal. Offering these can provide a competitive edge.
- Warning: Wifi is not universally provided but is considered essential globally. Ensure reliable Wifi is offered.
Recommendations for Hosts
- Consider adding popular differentiators like Heating or Kitchen to increase appeal.
- Highlight unique or less common amenities you offer (e.g., hot tub, dedicated workspace, EV charger) in your listing description and photos.
- Regularly check competitor amenities in Gubbio to stay competitive.
Gubbio Airbnb Guest Demographics & Profile Analysis (2025)
Guest Profile Summary for Gubbio
- The typical guest profile for Airbnb in Gubbio consists of a mix of domestic (56%) and international guests, often arriving from nearby Rome, typically belonging to the Post-2000s (Gen Z/Alpha) group (50%), primarily speaking English or Italian.
- Domestic travelers account for 55.6% of guests.
- Key international markets include Italy (55.6%) and United States (11.4%).
- Top languages spoken are English (37.7%) followed by Italian (27.2%).
- A significant demographic segment is the Post-2000s (Gen Z/Alpha) group, representing 50% of guests.
Recommendations for Hosts
- Balance marketing efforts between domestic and international channels based on the guest mix.
- Tailor amenities and listing descriptions to appeal to the dominant Post-2000s (Gen Z/Alpha) demographic (e.g., highlight fast WiFi, smart home features, local guides).
- Highlight unique local experiences or amenities relevant to the primary guest profile.
- Consider seasonal promotions aligned with peak travel times for key origin markets.
Nearby Short-Term Rental Market Comparison
How does the Gubbio Airbnb market stack up against its neighbors? Compare key performance metrics like average monthly revenue, ADR, and occupancy rates in surrounding areas to understand the broader regional STR landscape.
| Market | Active Properties | Monthly Revenue | Daily Rate | Avg. Occupancy |
|---|---|---|---|---|
| Tignano | 10 | $3,391 | $500.31 | 36% |
| Buonconvento | 59 | $3,068 | $456.70 | 46% |
| Collazzone | 28 | $2,839 | $341.11 | 36% |
| Florence | 9,598 | $2,833 | $208.48 | 52% |
| Marcialla | 25 | $2,788 | $236.61 | 54% |
| Parrano | 18 | $2,762 | $329.95 | 34% |
| Impruneta | 131 | $2,761 | $237.93 | 45% |
| Marciano della Chiana | 18 | $2,719 | $377.32 | 35% |
| Gaiole in Chianti | 206 | $2,679 | $344.49 | 39% |
| Barberino Tavarnelle | 83 | $2,667 | $356.47 | 43% |