Ferentillo Airbnb Market Analysis 2025: Short Term Rental Data & Vacation Rental Statistics in Umbria, Italy
Is Airbnb profitable in Ferentillo in 2025? Explore comprehensive Airbnb analytics for Ferentillo, Umbria, Italy to uncover income potential. This 2025 STR market report for Ferentillo, based on AirROI data from April 2024 to March 2025, reveals key trends in the niche market of 21 active listings.
Whether you're considering an Airbnb investment in Ferentillo, optimizing your existing vacation rental, or exploring rental arbitrage opportunities, understanding the Ferentillo Airbnb data is crucial. Navigating the high regulation landscape is key to maximizing your short term rental income potential. Let's dive into the specifics.
Key Ferentillo Airbnb Performance Metrics Overview
Monthly Airbnb Revenue Variations & Income Potential in Ferentillo (2025)
Understanding the monthly revenue variations for Airbnb listings in Ferentillo is key to maximizing your short term rental income potential. Seasonality significantly impacts earnings. Our analysis, based on data from the past 12 months, shows that the peak revenue month for STRs in Ferentillo is typically March, while November often presents the lowest earnings, highlighting opportunities for strategic pricing adjustments during shoulder and low seasons. Explore the typical Airbnb income in Ferentillo across different performance tiers:
- Best-in-class properties (Top 10%) achieve $2,299+ monthly, often utilizing dynamic pricing and superior guest experiences.
- Strong performing properties (Top 25%) earn $1,273 or more, indicating effective management and desirable locations/amenities.
- Typical properties (Median) generate around $585 per month, representing the average market performance.
- Entry-level properties (Bottom 25%) see earnings around $308, often with potential for optimization.
Average Monthly Airbnb Earnings Trend in Ferentillo
Ferentillo Airbnb Occupancy Rate Trends (2025)
Maximize your bookings by understanding the Ferentillo STR occupancy trends. Seasonal demand shifts significantly influence how often properties are booked. Typically, Augustsees the highest demand (peak season occupancy), while February experiences the lowest (low season). Effective strategies, like adjusting minimum stays or offering promotions, can boost occupancy during slower periods. Here's how different property tiers perform in Ferentillo:
- Best-in-class properties (Top 10%) achieve 54%+ occupancy, indicating high desirability and potentially optimized availability.
- Strong performing properties (Top 25%) maintain 23% or higher occupancy, suggesting good market fit and guest satisfaction.
- Typical properties (Median) have an occupancy rate around 14%.
- Entry-level properties (Bottom 25%) average 8% occupancy, potentially facing higher vacancy.
Average Monthly Occupancy Rate Trend in Ferentillo
Average Daily Rate (ADR) Airbnb Trends in Ferentillo (2025)
Effective short term rental pricing strategy in Ferentillo involves understanding monthly ADR fluctuations. The Average Daily Rate (ADR) for Airbnb in Ferentillo typically peaks in January and dips lowest during May. Leveraging Airbnb dynamic pricing tools or strategies based on this seasonality can significantly boost revenue. Here's a look at the typical nightly rates achieved:
- Best-in-class properties (Top 10%) command rates of $358+ per night, often due to premium features or locations.
- Strong performing properties (Top 25%) achieve nightly rates of $161 or more.
- Typical properties (Median) charge around $95 per night.
- Entry-level properties (Bottom 25%) earn around $73 per night.
Average Daily Rate (ADR) Trend by Month in Ferentillo
Get Live Ferentillo Market Intelligence 👇

Explore Real-time Analytics
Airbnb Seasonality Analysis & Trends in Ferentillo (2025)
Peak Season (March, December, May)
- Revenue averages $1,312 per month
- Occupancy rates average 20.9%
- Daily rates average $169
Shoulder Season
- Revenue averages $1,017 per month
- Occupancy maintains around 23.6%
- Daily rates hold near $161
Low Season (January, June, November)
- Revenue drops to average $514 per month
- Occupancy decreases to average 13.7%
- Daily rates adjust to average $170
Seasonality Insights for Ferentillo
- The Airbnb seasonality in Ferentillo shows highly seasonal trends requiring careful strategy. While the sections above show seasonal averages, it's also insightful to look at the extremes:
- During the high season, the absolute peak month showcases Ferentillo's highest earning potential, with monthly revenues capable of climbing to $1,370, occupancy reaching a high of 36.5%, and ADRs peaking at $180.
- Conversely, the slowest single month of the year, typically falling within the low season, marks the market's lowest point. In this month, revenue might dip to $305, occupancy could drop to 10.2%, and ADRs may adjust down to $154.
- Understanding both the seasonal averages and these monthly peaks and troughs in revenue, occupancy, and ADR is crucial for maximizing your Airbnb profit potential in Ferentillo.
Seasonal Strategies for Maximizing Profit
- Peak Season: Maximize revenue through premium pricing and potentially longer minimum stays. Ensure high availability.
- Low Season: Offer competitive pricing, special promotions (e.g., extended stay discounts), and flexible cancellation policies. Target off-season travelers like remote workers or budget-conscious guests.
- Shoulder Seasons: Implement dynamic pricing that balances peak and low rates. Target weekend travelers or specific events. Offer slightly more flexible terms than peak season.
- Regularly analyze your own performance against these Ferentillo seasonality benchmarks and adjust your pricing and availability strategy accordingly.
Best Areas for Airbnb Investment in Ferentillo (2025)
Exploring the top neighborhoods for short-term rentals in Ferentillo? This section highlights key areas, outlining why they are attractive for hosts and guests, along with notable local attractions. Consider these locations based on your target guest profile and investment strategy.
| Neighborhood / Area | Why Host Here? (Target Guests & Appeal) | Key Attractions & Landmarks |
|---|---|---|
| Ferentillo Centro | The charming historical center of Ferentillo, surrounded by picturesque landscapes and historic architecture. A perfect spot for tourists seeking a rustic Italian experience with easy access to amenities. | Chiesa di Santa Maria, Abbazia di San Pietro in Valle, Trekking trails, Local restaurants and cafes |
| Valle di Ferentillo | A beautiful valley offering stunning nature views and outdoor activities. Ideal for nature enthusiasts and those looking for tranquility away from the city hustle. | Natural parks, Hiking trails, River activities, Scenic viewpoints |
| Monte Solaio | A mountainous area ideal for hiking and nature walks. Attracts adventure seekers and families looking to enjoy the beauty of the Umbria region. | Hiking trails, Panoramic views, Wildlife observation |
| Poggio di Ferentillo | A tranquil hillside area offering magnificent views of the surrounding countryside. Popular for its peaceful atmosphere and proximity to nature. | Countryside views, Local farms, Wine tasting opportunities |
| La Rocca | Located near ancient ruins and castles, this area attracts history buffs and those interested in cultural heritage. | Castle ruins, Historical sites, Cultural events |
| Fiume Nera | Famous for its river activities, this area is perfect for those seeking outdoor sports and adventure, as well as families. | Kayaking, Fishing, River walking paths |
| Castel San Felice | A beautiful small village offering a glimpse into traditional life in Umbria. Great for guests looking to escape to a quiet, authentic setting. | Historic architecture, Local festivals, Artisan shops |
| Cascate delle Marmore | One of the tallest man-made waterfalls in the world, it's a must-see attraction for tourists visiting the region, making it a prime location for short-term rentals. | Marmore Falls, Nature trails, Visitor center |
Understanding Airbnb License Requirements & STR Laws in Ferentillo (2025)
Yes, Ferentillo, Umbria, Italy enforces high STR regulations. Obtaining a license and ensuring compliance is almost certainly required according to current 2025 STR laws. Always verify the latest short term rental regulations and Airbnb license requirements directly with local government authorities for Ferentillo to ensure full compliance before hosting.
(Source: AirROI data, 2025, based on 71% licensed listings)
Top Performing Airbnb Properties in Ferentillo (2025)
Benchmark your potential! Explore examples of top-performing Airbnb properties in Ferentillobased on Trailing Twelve Month (TTM) revenue. Analyze their characteristics, revenue, occupancy rate, and ADR to understand what drives success in this market.
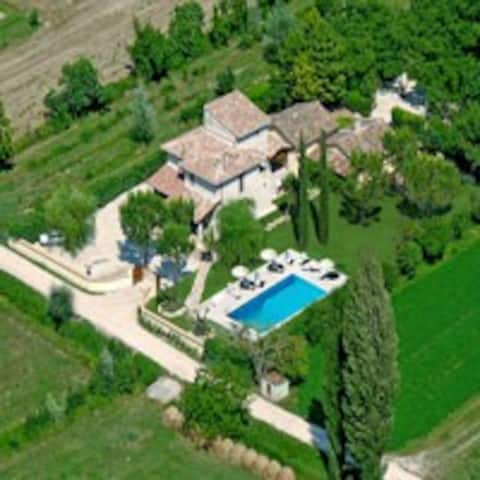
Agriturismo I Terzieri with pool and jacuzzi
Entire Place • 6 bedrooms
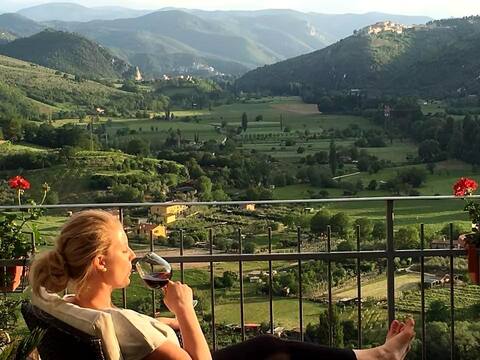
Casa Smeraldo with Pool Beautiful view Umbria
Entire Place • 1 bedroom
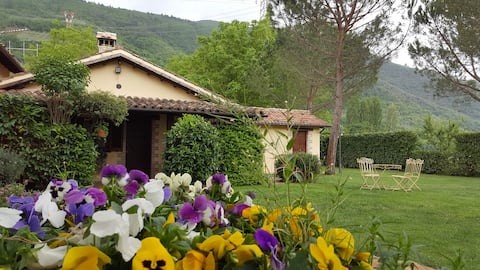
Farmhouse with pool and whirlpool:"Casa Senape"
Entire Place • 2 bedrooms
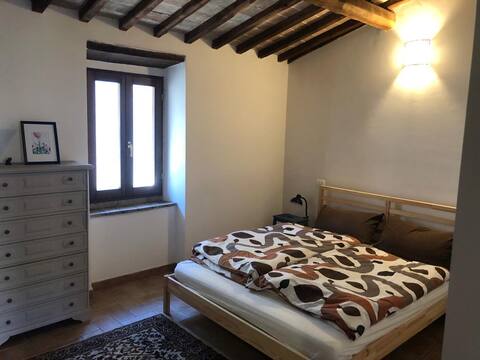
La casetta
Entire Place • 1 bedroom

Farmhouse with pool and whirlpool:"Casa Lavanda"
Entire Place • 1 bedroom

Holiday home with pool and Jacuzzi
Entire Place • 1 bedroom
Note: Performance varies based on location, size, amenities, seasonality, and management quality. Data reflects the past 12 months.
Top Performing Airbnb Hosts in Ferentillo (2025)
Learn from the best! This table showcases top-performing Airbnb hosts in Ferentillo based on the number of properties managed and estimated total revenue over the past year. Analyze their scale and performance metrics.
| Host Name | Properties | Grossing Revenue | Stay Reviews | Avg Rating |
|---|---|---|---|---|
| AZ. AGR. I TERZIERI Anna Maria | 5 | $71,057 | 28 | 4.97/5.0 |
| Nicoletta | 4 | $23,935 | 43 | 4.88/5.0 |
| Letizia | 4 | $19,501 | 15 | 2.27/5.0 |
| Paolo | 1 | $14,372 | 136 | 4.87/5.0 |
| Danilo | 2 | $9,535 | 43 | 4.92/5.0 |
| Laura | 1 | $9,293 | 6 | 5.00/5.0 |
| Roberta | 2 | $7,683 | 50 | 4.72/5.0 |
| Host #79845242 | 1 | $3,640 | 2 | 0.00/5.0 |
| Paolo | 1 | $3,193 | 43 | 4.67/5.0 |
Analyzing the strategies of top hosts, such as their property selection, pricing, and guest communication, can offer valuable lessons for optimizing your own Airbnb operations in Ferentillo.
Dive Deeper: Advanced Ferentillo STR Market Data (2025)
Ready to unlock more insights? AirROI provides access to advanced metrics and comprehensive Airbnb data for Ferentillo. Explore detailed analytics beyond this report to refine your investment strategy, optimize pricing, and maximize your vacation rental profits.
Explore Advanced MetricsFerentillo Short-Term Rental Market Composition (2025): Property & Room Types
Room Type Distribution
Property Type Distribution
Market Composition Insights for Ferentillo
- The Ferentillo Airbnb market composition is heavily skewed towards Entire Home/Apt listings, which make up 81% of the 21 active rentals. This indicates strong guest preference for privacy and space.
- Looking at the property type distribution in Ferentillo, House properties are the most common (42.9%), reflecting the local real estate landscape.
- Houses represent a significant 42.9% portion, catering likely to families or larger groups.
- The presence of 14.3% Hotel/Boutique listings indicates integration with traditional hospitality.
Ferentillo Airbnb Room Capacity Analysis (2025): Bedroom Distribution
Distribution of Listings by Number of Bedrooms
Room Capacity Insights for Ferentillo
- The dominant room capacity in Ferentillo is 1 bedroom listings, making up 57.1% of the market. This suggests a strong demand for properties suitable for couples or solo travelers.
- Together, 1 bedroom and 2 bedrooms properties represent 71.4% of the active Airbnb listings in Ferentillo, indicating a high concentration in these sizes.
- With over half the market (57.1%) consisting of studios or 1-bedroom units, Ferentillo is particularly well-suited for individuals or couples.
- Listings with 3+ bedrooms (4.8%) represent a smaller niche, potentially indicating an underserved market for larger group accommodations in Ferentillo.
Ferentillo Vacation Rental Guest Capacity Trends (2025)
Distribution of Listings by Guest Capacity
Guest Capacity Insights for Ferentillo
- The most common guest capacity trend in Ferentillo vacation rentals is listings accommodating 4 guests (33.3%). This suggests the primary traveler segment is likely small families or groups.
- Properties designed for 4 guests and 2 guests dominate the Ferentillo STR market, accounting for 47.6% of listings.
- 19.0% of properties accommodate 6+ guests, serving the market segment for larger families or group travel in Ferentillo.
- On average, properties in Ferentillo are equipped to host 3.6 guests.
Ferentillo Airbnb Booking Patterns (2025): Available vs. Booked Days
Available Days Distribution
Booked Days Distribution
Booking Pattern Insights for Ferentillo
- The most common availability pattern in Ferentillo falls within the 271-366 days range, representing 81% of listings. This suggests many properties have significant open periods on their calendars.
- Approximately 95.3% of listings show high availability (181+ days open annually), indicating potential for increased bookings or specific owner usage patterns.
- For booked days, the 31-90 days range is most frequent in Ferentillo (71.4%), reflecting common guest stay durations or potential owner blocking patterns.
- A notable 4.8% of properties secure long booking periods (181+ days booked per year), highlighting successful long-term rental strategies or significant owner usage.
Ferentillo Airbnb Minimum Stay Requirements Analysis
Distribution of Listings by Minimum Night Requirement
1 Night
6 listings
30% of total
2 Nights
8 listings
40% of total
3 Nights
4 listings
20% of total
7-29 Nights
2 listings
10% of total
Key Insights
- The most prevalent minimum stay requirement in Ferentillo is 2 Nights, adopted by 40% of listings. This highlights the market's preference for shorter, flexible bookings.
- A strong majority (70.0%) of the Ferentillo Airbnb data shows acceptance of very short stays (1-2 nights), indicating a dynamic, high-turnover market.
Recommendations
- Align with the market by considering a 2 Nights minimum stay, as 40% of Ferentillo hosts use this setting.
- Adjust minimum nights based on seasonality – potentially shorter during low season and longer during peak demand periods in Ferentillo.
Ferentillo Airbnb Cancellation Policy Trends Analysis (2025)
Flexible
10 listings
55.6% of total
Strict
8 listings
44.4% of total
Cancellation Policy Insights for Ferentillo
- The prevailing Airbnb cancellation policy trend in Ferentillo is Flexible, used by 55.6% of listings.
- There's a relatively balanced mix between guest-friendly (55.6%) and stricter (44.4%) policies, offering choices for different guest needs.
Recommendations for Hosts
- Consider adopting a Flexible policy to align with the 55.6% market standard in Ferentillo.
- Given the high prevalence of Flexible policies (55.6%), offering this can enhance booking appeal, especially during shoulder seasons.
- With 44.4% using Strict terms, this is a viable option in Ferentillo, particularly for high-value properties or during peak demand periods.
- Regularly review your cancellation policy against competitors and market demand shifts in Ferentillo.
Ferentillo STR Booking Lead Time Analysis (2025)
Average Booking Lead Time by Month
Booking Lead Time Insights for Ferentillo
- The overall average booking lead time for vacation rentals in Ferentillo is 51 days.
- Guests book furthest in advance for stays during May (average 151 days), likely coinciding with peak travel demand or local events.
- The shortest booking windows occur for stays in December (average 7 days), indicating more last-minute travel plans during this time.
- Seasonally, Spring (86 days avg.) sees the longest lead times, while Winter (27 days avg.) has the shortest, reflecting typical travel planning cycles.
Recommendations for Hosts
- Use the overall average lead time (51 days) as a baseline for your pricing and availability strategy in Ferentillo.
- For May stays, consider implementing length-of-stay discounts or slightly higher rates for bookings made less than 151 days out to capitalize on advance planning.
- During December, focus on last-minute booking availability and promotions, as guests book with very short notice (7 days avg.).
- Target marketing efforts for the Spring season well in advance (at least 86 days) to capture early planners.
- Monitor your own booking lead times against these Ferentillo averages to identify opportunities for dynamic pricing adjustments.
Popular & Essential Airbnb Amenities in Ferentillo (2025)
Amenity Prevalence
Amenity Insights for Ferentillo
- Essential amenities in Ferentillo that guests expect include: Hair dryer, Essentials, Heating. Lacking these (any) could significantly impact bookings.
- Popular amenities like Hangers, Private entrance, Free parking on premises are common but not universal. Offering these can provide a competitive edge.
Recommendations for Hosts
- Ensure your listing includes all essential amenities for Ferentillo: Hair dryer, Essentials, Heating.
- Prioritize adding missing essentials: Essentials, Heating.
- Consider adding popular differentiators like Hangers or Private entrance to increase appeal.
- Highlight unique or less common amenities you offer (e.g., hot tub, dedicated workspace, EV charger) in your listing description and photos.
- Regularly check competitor amenities in Ferentillo to stay competitive.
Ferentillo Airbnb Guest Demographics & Profile Analysis (2025)
Guest Profile Summary for Ferentillo
- The typical guest profile for Airbnb in Ferentillo consists of a mix of domestic (65%) and international guests, often arriving from nearby Rome, typically belonging to the Post-2000s (Gen Z/Alpha) group (50%), primarily speaking English or Italian.
- Domestic travelers account for 64.9% of guests.
- Key international markets include Italy (64.9%) and Netherlands (10.8%).
- Top languages spoken are English (44.2%) followed by Italian (30.2%).
- A significant demographic segment is the Post-2000s (Gen Z/Alpha) group, representing 50% of guests.
Recommendations for Hosts
- Target domestic marketing efforts towards travelers from Rome and Verona.
- Tailor amenities and listing descriptions to appeal to the dominant Post-2000s (Gen Z/Alpha) demographic (e.g., highlight fast WiFi, smart home features, local guides).
- Highlight unique local experiences or amenities relevant to the primary guest profile.
- Consider seasonal promotions aligned with peak travel times for key origin markets.
Nearby Short-Term Rental Market Comparison
How does the Ferentillo Airbnb market stack up against its neighbors? Compare key performance metrics like average monthly revenue, ADR, and occupancy rates in surrounding areas to understand the broader regional STR landscape.
| Market | Active Properties | Monthly Revenue | Daily Rate | Avg. Occupancy |
|---|---|---|---|---|
| Tignano | 10 | $3,391 | $500.31 | 36% |
| Buonconvento | 59 | $3,068 | $456.70 | 46% |
| Rome | 23,290 | $2,898 | $208.87 | 51% |
| Collazzone | 28 | $2,839 | $341.11 | 36% |
| Florence | 9,598 | $2,833 | $208.48 | 52% |
| Marcialla | 25 | $2,788 | $236.61 | 54% |
| Parrano | 18 | $2,762 | $329.95 | 34% |
| Impruneta | 131 | $2,761 | $237.93 | 45% |
| Marciano della Chiana | 18 | $2,719 | $377.32 | 35% |
| Gaiole in Chianti | 206 | $2,679 | $344.49 | 39% |