Riparbella Airbnb Market Analysis 2025: Short Term Rental Data & Vacation Rental Statistics in Tuscany, Italy
Is Airbnb profitable in Riparbella in 2025? Explore comprehensive Airbnb analytics for Riparbella, Tuscany, Italy to uncover income potential. This 2025 STR market report for Riparbella, based on AirROI data from April 2024 to March 2025, reveals key trends in the niche market of 115 active listings.
Whether you're considering an Airbnb investment in Riparbella, optimizing your existing vacation rental, or exploring rental arbitrage opportunities, understanding the Riparbella Airbnb data is crucial. Navigating the high regulation landscape is key to maximizing your short term rental income potential. Let's dive into the specifics.
Key Riparbella Airbnb Performance Metrics Overview
Monthly Airbnb Revenue Variations & Income Potential in Riparbella (2025)
Understanding the monthly revenue variations for Airbnb listings in Riparbella is key to maximizing your short term rental income potential. Seasonality significantly impacts earnings. Our analysis, based on data from the past 12 months, shows that the peak revenue month for STRs in Riparbella is typically August, while February often presents the lowest earnings, highlighting opportunities for strategic pricing adjustments during shoulder and low seasons. Explore the typical Airbnb income in Riparbella across different performance tiers:
- Best-in-class properties (Top 10%) achieve $4,606+ monthly, often utilizing dynamic pricing and superior guest experiences.
- Strong performing properties (Top 25%) earn $2,715 or more, indicating effective management and desirable locations/amenities.
- Typical properties (Median) generate around $1,436 per month, representing the average market performance.
- Entry-level properties (Bottom 25%) see earnings around $668, often with potential for optimization.
Average Monthly Airbnb Earnings Trend in Riparbella
Riparbella Airbnb Occupancy Rate Trends (2025)
Maximize your bookings by understanding the Riparbella STR occupancy trends. Seasonal demand shifts significantly influence how often properties are booked. Typically, Augustsees the highest demand (peak season occupancy), while February experiences the lowest (low season). Effective strategies, like adjusting minimum stays or offering promotions, can boost occupancy during slower periods. Here's how different property tiers perform in Riparbella:
- Best-in-class properties (Top 10%) achieve 66%+ occupancy, indicating high desirability and potentially optimized availability.
- Strong performing properties (Top 25%) maintain 51% or higher occupancy, suggesting good market fit and guest satisfaction.
- Typical properties (Median) have an occupancy rate around 28%.
- Entry-level properties (Bottom 25%) average 13% occupancy, potentially facing higher vacancy.
Average Monthly Occupancy Rate Trend in Riparbella
Average Daily Rate (ADR) Airbnb Trends in Riparbella (2025)
Effective short term rental pricing strategy in Riparbella involves understanding monthly ADR fluctuations. The Average Daily Rate (ADR) for Airbnb in Riparbella typically peaks in August and dips lowest during December. Leveraging Airbnb dynamic pricing tools or strategies based on this seasonality can significantly boost revenue. Here's a look at the typical nightly rates achieved:
- Best-in-class properties (Top 10%) command rates of $313+ per night, often due to premium features or locations.
- Strong performing properties (Top 25%) achieve nightly rates of $174 or more.
- Typical properties (Median) charge around $126 per night.
- Entry-level properties (Bottom 25%) earn around $92 per night.
Average Daily Rate (ADR) Trend by Month in Riparbella
Get Live Riparbella Market Intelligence 👇

Explore Real-time Analytics
Airbnb Seasonality Analysis & Trends in Riparbella (2025)
Peak Season (August, July, May)
- Revenue averages $3,378 per month
- Occupancy rates average 53.1%
- Daily rates average $227
Shoulder Season
- Revenue averages $1,993 per month
- Occupancy maintains around 30.0%
- Daily rates hold near $202
Low Season (January, February, March)
- Revenue drops to average $1,038 per month
- Occupancy decreases to average 21.6%
- Daily rates adjust to average $169
Seasonality Insights for Riparbella
- The Airbnb seasonality in Riparbella shows highly seasonal trends requiring careful strategy. While the sections above show seasonal averages, it's also insightful to look at the extremes:
- During the high season, the absolute peak month showcases Riparbella's highest earning potential, with monthly revenues capable of climbing to $3,758, occupancy reaching a high of 66.1%, and ADRs peaking at $229.
- Conversely, the slowest single month of the year, typically falling within the low season, marks the market's lowest point. In this month, revenue might dip to $895, occupancy could drop to 17.8%, and ADRs may adjust down to $168.
- Understanding both the seasonal averages and these monthly peaks and troughs in revenue, occupancy, and ADR is crucial for maximizing your Airbnb profit potential in Riparbella.
Seasonal Strategies for Maximizing Profit
- Peak Season: Maximize revenue through premium pricing and potentially longer minimum stays. Ensure high availability.
- Low Season: Offer competitive pricing, special promotions (e.g., extended stay discounts), and flexible cancellation policies. Target off-season travelers like remote workers or budget-conscious guests.
- Shoulder Seasons: Implement dynamic pricing that balances peak and low rates. Target weekend travelers or specific events. Offer slightly more flexible terms than peak season.
- Regularly analyze your own performance against these Riparbella seasonality benchmarks and adjust your pricing and availability strategy accordingly.
Best Areas for Airbnb Investment in Riparbella (2025)
Exploring the top neighborhoods for short-term rentals in Riparbella? This section highlights key areas, outlining why they are attractive for hosts and guests, along with notable local attractions. Consider these locations based on your target guest profile and investment strategy.
| Neighborhood / Area | Why Host Here? (Target Guests & Appeal) | Key Attractions & Landmarks |
|---|---|---|
| Marina di Bibbona | Close to the sandy beaches of the Etruscan Coast, popular with both locals and tourists looking for seaside relaxation and water activities. | Bibbona Beach, Cecina Mare, Parco Gallorose, Cavallino Matto, Etruscan Coast |
| Bolgheri | Famous for its beautiful vineyards and wine production, Bolgheri attracts wine enthusiasts and nature lovers, providing a perfect backdrop for rural tourism. | Bolgheri Vineyards, Castello di Bolgheri, Cypress Avenue, Etruscan archaeological sites, Wine tasting tours |
| Castagneto Carducci | A picturesque hillside town known for its medieval charm and proximity to the sea, appealing to travelers seeking a tranquil and authentic Tuscan experience. | Castagneto Carducci Old Town, Beach of Marina di Castagneto, Wine paths, Scenic countryside, Local restaurants |
| Volterra | Rich in history and architecture, with stunning views over the Tuscan landscape, Volterra is perfect for those interested in cultural tourism and historical sites. | Roman Theatre, Etruscan Museum, Volterra’s Fortress, Piazza dei Priori, Local handicraft shops |
| Sassetta | Set in the heart of the wooded hills, Sassetta offers a serene environment for nature lovers and those looking to escape the hustle and bustle of city life. | Sassetta Nature Reserve, Thermal baths, Local hiking trails, Scenic viewpoints, Wine tasting experiences |
| Castiglioncello | A beach destination popular for its clear waters and attractive coastal scenery, great for families and visitors looking for beach activities. | Castiglioncello Beach, Scoglio della Madonnina, Pine Forest of Castiglioncello, Local seafood restaurants, Cultural summer events |
| Cecina | A vibrant town with a mix of beach life and local culture, ideal for families and tourists looking for a variety of attractions and activities. | Cecina Beach, Acqua Village Water Park, Archaeological Park of Volterra, Local markets, Cultural events throughout the summer |
| Riotorto | A quaint village close to the coast, ideal for visitors who appreciate a quiet retreat with access to beautiful beaches and nature. | Riotorto Beach, Scenic coastal trails, Local artisanal shops, Biodiversity in natural parks, Proximity to Elba Island ferry |
Understanding Airbnb License Requirements & STR Laws in Riparbella (2025)
Yes, Riparbella, Tuscany, Italy enforces high STR regulations. Obtaining a license and ensuring compliance is almost certainly required according to current 2025 STR laws. Always verify the latest short term rental regulations and Airbnb license requirements directly with local government authorities for Riparbella to ensure full compliance before hosting.
(Source: AirROI data, 2025, based on 52% licensed listings)
Top Performing Airbnb Properties in Riparbella (2025)
Benchmark your potential! Explore examples of top-performing Airbnb properties in Riparbellabased on Trailing Twelve Month (TTM) revenue. Analyze their characteristics, revenue, occupancy rate, and ADR to understand what drives success in this market.
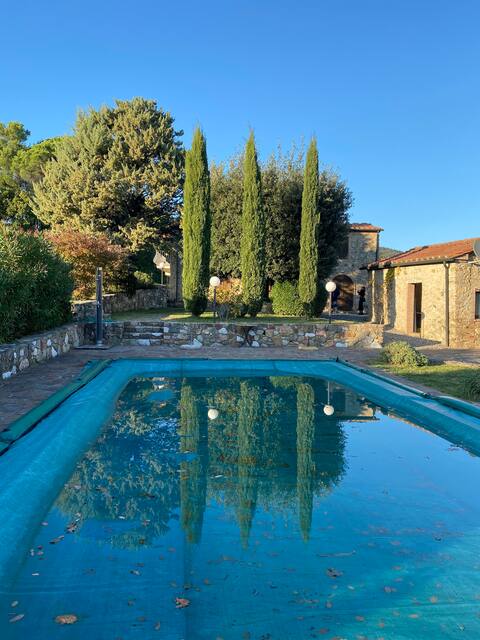
Beautiful cottage with infinity pool
Entire Place • 3 bedrooms
Casa Danilo up to 11 beds PrivatePool near Seaside
Entire Place • 5 bedrooms

Villa Cristina
Entire Place • 4 bedrooms
Maison Cipressi
Entire Place • 3 bedrooms
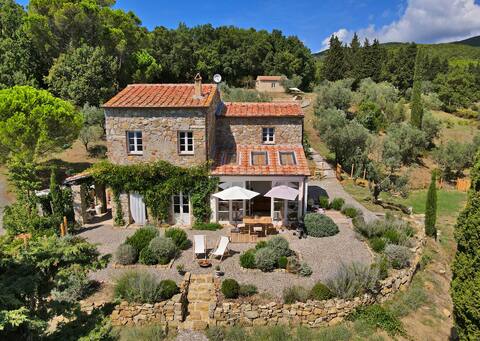
Stunning Tuscan Farm House with an Olive Grove
Entire Place • 4 bedrooms
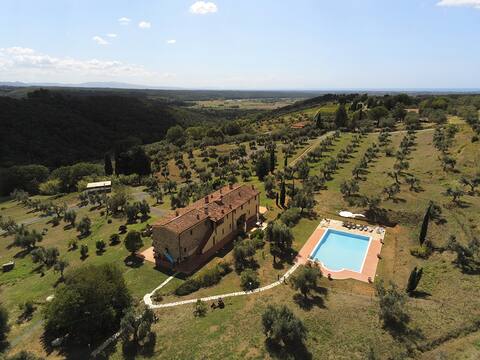
Tuscan countryside & pool - 20 min from the beach
Entire Place • 2 bedrooms
Note: Performance varies based on location, size, amenities, seasonality, and management quality. Data reflects the past 12 months.
Top Performing Airbnb Hosts in Riparbella (2025)
Learn from the best! This table showcases top-performing Airbnb hosts in Riparbella based on the number of properties managed and estimated total revenue over the past year. Analyze their scale and performance metrics.
| Host Name | Properties | Grossing Revenue | Stay Reviews | Avg Rating |
|---|---|---|---|---|
| Chris | 12 | $315,860 | 268 | 4.73/5.0 |
| Jutta - Interhome Group | 18 | $147,956 | 30 | 1.03/5.0 |
| Chiara | 8 | $145,586 | 38 | 3.13/5.0 |
| Matthias | 5 | $109,997 | 8 | 1.85/5.0 |
| Alessandra | 6 | $83,506 | 142 | 4.07/5.0 |
| Christoph | 1 | $80,279 | 20 | 4.80/5.0 |
| Holidu | 1 | $54,458 | 7 | 4.71/5.0 |
| Sandra | 2 | $50,385 | 26 | 4.58/5.0 |
| Elena - Interhome Group | 5 | $50,024 | 14 | 0.98/5.0 |
| Sophie | 1 | $41,389 | 5 | 5.00/5.0 |
Analyzing the strategies of top hosts, such as their property selection, pricing, and guest communication, can offer valuable lessons for optimizing your own Airbnb operations in Riparbella.
Dive Deeper: Advanced Riparbella STR Market Data (2025)
Ready to unlock more insights? AirROI provides access to advanced metrics and comprehensive Airbnb data for Riparbella. Explore detailed analytics beyond this report to refine your investment strategy, optimize pricing, and maximize your vacation rental profits.
Explore Advanced MetricsRiparbella Short-Term Rental Market Composition (2025): Property & Room Types
Room Type Distribution
Property Type Distribution
Market Composition Insights for Riparbella
- The Riparbella Airbnb market composition is heavily skewed towards Entire Home/Apt listings, which make up 99.1% of the 115 active rentals. This indicates strong guest preference for privacy and space.
- Looking at the property type distribution in Riparbella, Apartment/Condo properties are the most common (61.7%), reflecting the local real estate landscape.
- Houses represent a significant 33% portion, catering likely to families or larger groups.
- Smaller segments like outdoor/unique, others (combined 5.2%) offer potential for unique stay experiences.
Riparbella Airbnb Room Capacity Analysis (2025): Bedroom Distribution
Distribution of Listings by Number of Bedrooms
Room Capacity Insights for Riparbella
- The dominant room capacity in Riparbella is 1 bedroom listings, making up 42.6% of the market. This suggests a strong demand for properties suitable for couples or solo travelers.
- Together, 1 bedroom and 2 bedrooms properties represent 79.1% of the active Airbnb listings in Riparbella, indicating a high concentration in these sizes.
Riparbella Vacation Rental Guest Capacity Trends (2025)
Distribution of Listings by Guest Capacity
Guest Capacity Insights for Riparbella
- The most common guest capacity trend in Riparbella vacation rentals is listings accommodating 4 guests (34.8%). This suggests the primary traveler segment is likely small families or groups.
- Properties designed for 4 guests and 6 guests dominate the Riparbella STR market, accounting for 63.5% of listings.
- 43.5% of properties accommodate 6+ guests, serving the market segment for larger families or group travel in Riparbella.
- On average, properties in Riparbella are equipped to host 5.0 guests.
Riparbella Airbnb Booking Patterns (2025): Available vs. Booked Days
Available Days Distribution
Booked Days Distribution
Booking Pattern Insights for Riparbella
- The most common availability pattern in Riparbella falls within the 271-366 days range, representing 67% of listings. This suggests many properties have significant open periods on their calendars.
- Approximately 97.4% of listings show high availability (181+ days open annually), indicating potential for increased bookings or specific owner usage patterns.
- For booked days, the 31-90 days range is most frequent in Riparbella (37.4%), reflecting common guest stay durations or potential owner blocking patterns.
- A notable 4.3% of properties secure long booking periods (181+ days booked per year), highlighting successful long-term rental strategies or significant owner usage.
Riparbella Airbnb Minimum Stay Requirements Analysis
Distribution of Listings by Minimum Night Requirement
1 Night
40 listings
36.7% of total
2 Nights
22 listings
20.2% of total
3 Nights
16 listings
14.7% of total
4-6 Nights
8 listings
7.3% of total
7-29 Nights
7 listings
6.4% of total
30+ Nights
16 listings
14.7% of total
Key Insights
- The most prevalent minimum stay requirement in Riparbella is 1 Night, adopted by 36.7% of listings. This highlights the market's preference for shorter, flexible bookings.
- A significant segment (14.7%) caters to monthly stays (30+ nights) in Riparbella, pointing to opportunities in the extended-stay market.
Recommendations
- Align with the market by considering a 1 Night minimum stay, as 36.7% of Riparbella hosts use this setting.
- Explore offering discounts for stays of 30+ nights to attract the 14.7% of the market seeking extended stays.
- Adjust minimum nights based on seasonality – potentially shorter during low season and longer during peak demand periods in Riparbella.
Riparbella Airbnb Cancellation Policy Trends Analysis (2025)
Super Strict 30 Days
11 listings
13.6% of total
Flexible
12 listings
14.8% of total
Moderate
40 listings
49.4% of total
Strict
18 listings
22.2% of total
Cancellation Policy Insights for Riparbella
- The prevailing Airbnb cancellation policy trend in Riparbella is Moderate, used by 49.4% of listings.
- There's a relatively balanced mix between guest-friendly (64.2%) and stricter (22.2%) policies, offering choices for different guest needs.
Recommendations for Hosts
- Consider adopting a Moderate policy to align with the 49.4% market standard in Riparbella.
- Regularly review your cancellation policy against competitors and market demand shifts in Riparbella.
Riparbella STR Booking Lead Time Analysis (2025)
Average Booking Lead Time by Month
Booking Lead Time Insights for Riparbella
- The overall average booking lead time for vacation rentals in Riparbella is 65 days.
- Guests book furthest in advance for stays during May (average 136 days), likely coinciding with peak travel demand or local events.
- The shortest booking windows occur for stays in February (average 0 days), indicating more last-minute travel plans during this time.
- Seasonally, Spring (97 days avg.) sees the longest lead times, while Winter (39 days avg.) has the shortest, reflecting typical travel planning cycles.
Recommendations for Hosts
- Use the overall average lead time (65 days) as a baseline for your pricing and availability strategy in Riparbella.
- For May stays, consider implementing length-of-stay discounts or slightly higher rates for bookings made less than 136 days out to capitalize on advance planning.
- During February, focus on last-minute booking availability and promotions, as guests book with very short notice (0 days avg.).
- Target marketing efforts for the Spring season well in advance (at least 97 days) to capture early planners.
- Monitor your own booking lead times against these Riparbella averages to identify opportunities for dynamic pricing adjustments.
Popular & Essential Airbnb Amenities in Riparbella (2025)
Amenity Prevalence
Amenity Insights for Riparbella
- Essential amenities in Riparbella that guests expect include: Kitchen. Lacking these (this) could significantly impact bookings.
- Popular amenities like Free parking on premises, TV, Heating are common but not universal. Offering these can provide a competitive edge.
- Warning: Wifi is not universally provided but is considered essential globally. Ensure reliable Wifi is offered.
Recommendations for Hosts
- Ensure your listing includes all essential amenities for Riparbella: Kitchen.
- Prioritize adding missing essentials: Kitchen.
- Consider adding popular differentiators like Free parking on premises or TV to increase appeal.
- Highlight unique or less common amenities you offer (e.g., hot tub, dedicated workspace, EV charger) in your listing description and photos.
- Regularly check competitor amenities in Riparbella to stay competitive.
Riparbella Airbnb Guest Demographics & Profile Analysis (2025)
Guest Profile Summary for Riparbella
- The typical guest profile for Airbnb in Riparbella consists of predominantly international visitors (80%), with top international origins including Italy, typically belonging to the Post-2000s (Gen Z/Alpha) group (50%), primarily speaking English or German.
- Domestic travelers account for 19.9% of guests.
- Key international markets include Germany (24.6%) and Italy (19.9%).
- Top languages spoken are English (39.6%) followed by German (16.2%).
- A significant demographic segment is the Post-2000s (Gen Z/Alpha) group, representing 50% of guests.
Recommendations for Hosts
- Focus marketing internationally, particularly towards travelers from Italy.
- Tailor amenities and listing descriptions to appeal to the dominant Post-2000s (Gen Z/Alpha) demographic (e.g., highlight fast WiFi, smart home features, local guides).
- Highlight unique local experiences or amenities relevant to the primary guest profile.
- Consider seasonal promotions aligned with peak travel times for key origin markets.
Nearby Short-Term Rental Market Comparison
How does the Riparbella Airbnb market stack up against its neighbors? Compare key performance metrics like average monthly revenue, ADR, and occupancy rates in surrounding areas to understand the broader regional STR landscape.
| Market | Active Properties | Monthly Revenue | Daily Rate | Avg. Occupancy |
|---|---|---|---|---|
| Portofino | 68 | $4,086 | $454.35 | 44% |
| Crespina | 16 | $3,526 | $493.64 | 48% |
| Tignano | 10 | $3,391 | $500.31 | 36% |
| Luni Mare | 11 | $3,102 | $169.59 | 40% |
| Buonconvento | 59 | $3,068 | $456.70 | 46% |
| Monterosso al Mare | 350 | $2,958 | $248.25 | 57% |
| Castelfranco di Sotto | 47 | $2,881 | $294.54 | 38% |
| Florence | 9,598 | $2,833 | $208.48 | 52% |
| Riomaggiore | 640 | $2,789 | $196.57 | 57% |
| Marcialla | 25 | $2,788 | $236.61 | 54% |