Pescaglia Airbnb Market Analysis 2025: Short Term Rental Data & Vacation Rental Statistics in Tuscany, Italy
Is Airbnb profitable in Pescaglia in 2025? Explore comprehensive Airbnb analytics for Pescaglia, Tuscany, Italy to uncover income potential. This 2025 STR market report for Pescaglia, based on AirROI data from April 2024 to March 2025, reveals key trends in the niche market of 85 active listings.
Whether you're considering an Airbnb investment in Pescaglia, optimizing your existing vacation rental, or exploring rental arbitrage opportunities, understanding the Pescaglia Airbnb data is crucial. Navigating the high regulation landscape is key to maximizing your short term rental income potential. Let's dive into the specifics.
Key Pescaglia Airbnb Performance Metrics Overview
Monthly Airbnb Revenue Variations & Income Potential in Pescaglia (2025)
Understanding the monthly revenue variations for Airbnb listings in Pescaglia is key to maximizing your short term rental income potential. Seasonality significantly impacts earnings. Our analysis, based on data from the past 12 months, shows that the peak revenue month for STRs in Pescaglia is typically August, while March often presents the lowest earnings, highlighting opportunities for strategic pricing adjustments during shoulder and low seasons. Explore the typical Airbnb income in Pescaglia across different performance tiers:
- Best-in-class properties (Top 10%) achieve $5,633+ monthly, often utilizing dynamic pricing and superior guest experiences.
- Strong performing properties (Top 25%) earn $3,063 or more, indicating effective management and desirable locations/amenities.
- Typical properties (Median) generate around $1,312 per month, representing the average market performance.
- Entry-level properties (Bottom 25%) see earnings around $497, often with potential for optimization.
Average Monthly Airbnb Earnings Trend in Pescaglia
Pescaglia Airbnb Occupancy Rate Trends (2025)
Maximize your bookings by understanding the Pescaglia STR occupancy trends. Seasonal demand shifts significantly influence how often properties are booked. Typically, Augustsees the highest demand (peak season occupancy), while March experiences the lowest (low season). Effective strategies, like adjusting minimum stays or offering promotions, can boost occupancy during slower periods. Here's how different property tiers perform in Pescaglia:
- Best-in-class properties (Top 10%) achieve 73%+ occupancy, indicating high desirability and potentially optimized availability.
- Strong performing properties (Top 25%) maintain 47% or higher occupancy, suggesting good market fit and guest satisfaction.
- Typical properties (Median) have an occupancy rate around 28%.
- Entry-level properties (Bottom 25%) average 13% occupancy, potentially facing higher vacancy.
Average Monthly Occupancy Rate Trend in Pescaglia
Average Daily Rate (ADR) Airbnb Trends in Pescaglia (2025)
Effective short term rental pricing strategy in Pescaglia involves understanding monthly ADR fluctuations. The Average Daily Rate (ADR) for Airbnb in Pescaglia typically peaks in July and dips lowest during April. Leveraging Airbnb dynamic pricing tools or strategies based on this seasonality can significantly boost revenue. Here's a look at the typical nightly rates achieved:
- Best-in-class properties (Top 10%) command rates of $361+ per night, often due to premium features or locations.
- Strong performing properties (Top 25%) achieve nightly rates of $226 or more.
- Typical properties (Median) charge around $141 per night.
- Entry-level properties (Bottom 25%) earn around $102 per night.
Average Daily Rate (ADR) Trend by Month in Pescaglia
Get Live Pescaglia Market Intelligence 👇

Explore Real-time Analytics
Airbnb Seasonality Analysis & Trends in Pescaglia (2025)
Peak Season (August, July, May)
- Revenue averages $4,310 per month
- Occupancy rates average 54.3%
- Daily rates average $195
Shoulder Season
- Revenue averages $2,257 per month
- Occupancy maintains around 32.2%
- Daily rates hold near $190
Low Season (January, March, December)
- Revenue drops to average $717 per month
- Occupancy decreases to average 14.8%
- Daily rates adjust to average $194
Seasonality Insights for Pescaglia
- The Airbnb seasonality in Pescaglia shows highly seasonal trends requiring careful strategy. While the sections above show seasonal averages, it's also insightful to look at the extremes:
- During the high season, the absolute peak month showcases Pescaglia's highest earning potential, with monthly revenues capable of climbing to $4,937, occupancy reaching a high of 64.2%, and ADRs peaking at $199.
- Conversely, the slowest single month of the year, typically falling within the low season, marks the market's lowest point. In this month, revenue might dip to $520, occupancy could drop to 12.9%, and ADRs may adjust down to $181.
- Understanding both the seasonal averages and these monthly peaks and troughs in revenue, occupancy, and ADR is crucial for maximizing your Airbnb profit potential in Pescaglia.
Seasonal Strategies for Maximizing Profit
- Peak Season: Maximize revenue through premium pricing and potentially longer minimum stays. Ensure high availability.
- Low Season: Offer competitive pricing, special promotions (e.g., extended stay discounts), and flexible cancellation policies. Target off-season travelers like remote workers or budget-conscious guests.
- Shoulder Seasons: Implement dynamic pricing that balances peak and low rates. Target weekend travelers or specific events. Offer slightly more flexible terms than peak season.
- Regularly analyze your own performance against these Pescaglia seasonality benchmarks and adjust your pricing and availability strategy accordingly.
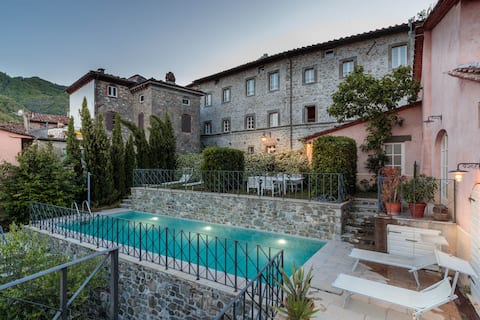
Best Areas for Airbnb Investment in Pescaglia (2025)
Exploring the top neighborhoods for short-term rentals in Pescaglia? This section highlights key areas, outlining why they are attractive for hosts and guests, along with notable local attractions. Consider these locations based on your target guest profile and investment strategy.
| Neighborhood / Area | Why Host Here? (Target Guests & Appeal) | Key Attractions & Landmarks |
|---|---|---|
| Coreglia Antelminelli | Charming medieval village known for its picturesque streets and historical architecture. Offers a tranquil experience amidst nature, appealing to tourists seeking peace and cultural immersion. | Pieve di San Bartolomeo, Museo dell'Immigrazione, Castello di Coreglia, Antica Strada di Vallombrosa, Parco Nazionale della Garfagnana |
| Barga | Known for its stunning views and well-preserved historic center. Attracts visitors for its beautiful landscapes and rich cultural events throughout the year. | Barga Cathedral, Piazza Salvi, Ponte di Barga, Teatro dei Differenti, Casa Pascoli |
| Pietrasanta | Famous for its marble sculptures and art scene. It's a popular spot for those interested in art, attracting tourists who wish to experience its vibrant culture and galleries. | Museo dei Bozzetti, Chiesa di Sant'Agostino, Piazza del Duomo, Cattedrale di Pietrasanta, Villa La Versiliana |
| Lucca | Historic walled city with beautiful architecture and vibrant street life. Ideal for visitors exploring Tuscany, thanks to its central location and rich history. | Lucca Walls, Torre Guinigi, Piazza dell'Anfiteatro, Basilica di San Frediano, Puccini Museum |
| Versilia | Coastal area known for its sandy beaches and lively summer nightlife. Attracts tourists looking for sun, beach, and entertainment during the warm months. | Forte dei Marmi beach, Viareggio promenade, Pietrasanta beaches, Marina di Massa, Parco della Versiliana |
| Camaiore | Beautiful town surrounded by nature and with a rich historical background. Offers accessibility to outdoor activities and is a gateway to the nearby mountains and beaches. | Camaiore Abbey, Civico Museo Archeologico, Piazza San Bernardino, Mount Cava |
| San Romano in Garfagnana | Quaint village in the heart of the Garfagnana valley, perfect for nature lovers and those seeking an authentic Italian experience off the beaten path. | Castello di San Romano, Parco Avventura Garfagnana, Garfagnana hiking trails, Local chestnut festivals |
| Bagni di Lucca | Known for its thermal baths and natural beauty, attracting wellness tourists looking for relaxation and adventure in nature. | Terme di Bagni di Lucca, Ponte della Maddalena, Historical spas, Hiking in the surrounding mountains, Local gastronomy experiences |
Understanding Airbnb License Requirements & STR Laws in Pescaglia (2025)
Yes, Pescaglia, Tuscany, Italy enforces high STR regulations. Obtaining a license and ensuring compliance is almost certainly required according to current 2025 STR laws. Always verify the latest short term rental regulations and Airbnb license requirements directly with local government authorities for Pescaglia to ensure full compliance before hosting.
(Source: AirROI data, 2025, based on 47% licensed listings)
Top Performing Airbnb Properties in Pescaglia (2025)
Benchmark your potential! Explore examples of top-performing Airbnb properties in Pescagliabased on Trailing Twelve Month (TTM) revenue. Analyze their characteristics, revenue, occupancy rate, and ADR to understand what drives success in this market.
Palazzo Giusti: Understated Luxury with a Welcomin
Entire Place • 7 bedrooms

Villa Grema, a Farmhouse with Private Infinity Poo
Entire Place • 5 bedrooms
Fantastic villa family welcome / pets friendly
Entire Place • 5 bedrooms

Poggio al Leccio, superbe villa Toscane
Entire Place • 5 bedrooms
Villa Cristina modern farmhouse with Private Pool
Entire Place • 3 bedrooms

Podere il Giardino Lucca - with private pool
Entire Place • 2 bedrooms
Note: Performance varies based on location, size, amenities, seasonality, and management quality. Data reflects the past 12 months.
Top Performing Airbnb Hosts in Pescaglia (2025)
Learn from the best! This table showcases top-performing Airbnb hosts in Pescaglia based on the number of properties managed and estimated total revenue over the past year. Analyze their scale and performance metrics.
| Host Name | Properties | Grossing Revenue | Stay Reviews | Avg Rating |
|---|---|---|---|---|
| Lucca Apartments And Villas S. | 3 | $336,140 | 31 | 4.90/5.0 |
| Mimicha | 4 | $150,829 | 173 | 4.74/5.0 |
| Joanna | 2 | $133,906 | 170 | 4.76/5.0 |
| Giuseppe | 6 | $123,072 | 233 | 4.72/5.0 |
| Birgit - Interhome Group | 3 | $79,920 | 50 | 4.88/5.0 |
| Host #7293304 | 1 | $64,850 | 0 | 0.00/5.0 |
| Gian Luca | 3 | $63,444 | 15 | 4.63/5.0 |
| Cristina | 1 | $61,834 | 12 | 5.00/5.0 |
| Maurizio | 1 | $61,654 | 27 | 4.81/5.0 |
| Enrico | 1 | $49,482 | 11 | 4.73/5.0 |
Analyzing the strategies of top hosts, such as their property selection, pricing, and guest communication, can offer valuable lessons for optimizing your own Airbnb operations in Pescaglia.
Dive Deeper: Advanced Pescaglia STR Market Data (2025)
Ready to unlock more insights? AirROI provides access to advanced metrics and comprehensive Airbnb data for Pescaglia. Explore detailed analytics beyond this report to refine your investment strategy, optimize pricing, and maximize your vacation rental profits.
Explore Advanced MetricsPescaglia Short-Term Rental Market Composition (2025): Property & Room Types
Room Type Distribution
Property Type Distribution
Market Composition Insights for Pescaglia
- The Pescaglia Airbnb market composition is heavily skewed towards Entire Home/Apt listings, which make up 92.9% of the 85 active rentals. This indicates strong guest preference for privacy and space.
- Looking at the property type distribution in Pescaglia, House properties are the most common (71.8%), reflecting the local real estate landscape.
- Houses represent a significant 71.8% portion, catering likely to families or larger groups.
- Smaller segments like hotel/boutique, outdoor/unique (combined 4.8%) offer potential for unique stay experiences.
Pescaglia Airbnb Room Capacity Analysis (2025): Bedroom Distribution
Distribution of Listings by Number of Bedrooms
Room Capacity Insights for Pescaglia
- The dominant room capacity in Pescaglia is 2 bedrooms listings, making up 31.8% of the market. This suggests a strong demand for properties suitable for couples or solo travelers.
- Together, 2 bedrooms and 3 bedrooms properties represent 58.9% of the active Airbnb listings in Pescaglia, indicating a high concentration in these sizes.
- A significant 43.6% of listings offer 3+ bedrooms, catering to larger groups and families seeking more space in Pescaglia.
Pescaglia Vacation Rental Guest Capacity Trends (2025)
Distribution of Listings by Guest Capacity
Guest Capacity Insights for Pescaglia
- The most common guest capacity trend in Pescaglia vacation rentals is listings accommodating 8+ guests (21.2%). This suggests the primary traveler segment is likely larger groups.
- Properties designed for 8+ guests and 4 guests dominate the Pescaglia STR market, accounting for 42.4% of listings.
- 45.9% of properties accommodate 6+ guests, serving the market segment for larger families or group travel in Pescaglia.
- On average, properties in Pescaglia are equipped to host 5.1 guests.
Pescaglia Airbnb Booking Patterns (2025): Available vs. Booked Days
Available Days Distribution
Booked Days Distribution
Booking Pattern Insights for Pescaglia
- The most common availability pattern in Pescaglia falls within the 271-366 days range, representing 55.3% of listings. This suggests many properties have significant open periods on their calendars.
- Approximately 92.9% of listings show high availability (181+ days open annually), indicating potential for increased bookings or specific owner usage patterns.
- For booked days, the 91-180 days range is most frequent in Pescaglia (41.2%), reflecting common guest stay durations or potential owner blocking patterns.
- A notable 7.1% of properties secure long booking periods (181+ days booked per year), highlighting successful long-term rental strategies or significant owner usage.
Pescaglia Airbnb Minimum Stay Requirements Analysis
Distribution of Listings by Minimum Night Requirement
1 Night
17 listings
21.8% of total
2 Nights
6 listings
7.7% of total
3 Nights
18 listings
23.1% of total
4-6 Nights
19 listings
24.4% of total
7-29 Nights
14 listings
17.9% of total
30+ Nights
4 listings
5.1% of total
Key Insights
- The most prevalent minimum stay requirement in Pescaglia is 4-6 Nights, adopted by 24.4% of listings. This highlights the market's preference for longer commitments.
Recommendations
- Align with the market by considering a 4-6 Nights minimum stay, as 24.4% of Pescaglia hosts use this setting.
- If feasible, allowing 1-night stays, especially midweek or during low season, could capture last-minute bookings, as only 21.8% currently do.
- Explore offering discounts for stays of 30+ nights to attract the 5.1% of the market seeking extended stays.
- Adjust minimum nights based on seasonality – potentially shorter during low season and longer during peak demand periods in Pescaglia.
Pescaglia Airbnb Cancellation Policy Trends Analysis (2025)
Super Strict 30 Days
11 listings
15.9% of total
Super Strict 60 Days
3 listings
4.3% of total
Flexible
10 listings
14.5% of total
Moderate
25 listings
36.2% of total
Strict
20 listings
29% of total
Cancellation Policy Insights for Pescaglia
- The prevailing Airbnb cancellation policy trend in Pescaglia is Moderate, used by 36.2% of listings.
- There's a relatively balanced mix between guest-friendly (50.7%) and stricter (29.0%) policies, offering choices for different guest needs.
Recommendations for Hosts
- Consider adopting a Moderate policy to align with the 36.2% market standard in Pescaglia.
- Regularly review your cancellation policy against competitors and market demand shifts in Pescaglia.
Pescaglia STR Booking Lead Time Analysis (2025)
Average Booking Lead Time by Month
Booking Lead Time Insights for Pescaglia
- The overall average booking lead time for vacation rentals in Pescaglia is 88 days.
- Guests book furthest in advance for stays during July (average 127 days), likely coinciding with peak travel demand or local events.
- The shortest booking windows occur for stays in January (average 31 days), indicating more last-minute travel plans during this time.
- Seasonally, Summer (112 days avg.) sees the longest lead times, while Winter (65 days avg.) has the shortest, reflecting typical travel planning cycles.
Recommendations for Hosts
- Use the overall average lead time (88 days) as a baseline for your pricing and availability strategy in Pescaglia.
- For July stays, consider implementing length-of-stay discounts or slightly higher rates for bookings made less than 127 days out to capitalize on advance planning.
- Target marketing efforts for the Summer season well in advance (at least 112 days) to capture early planners.
- Monitor your own booking lead times against these Pescaglia averages to identify opportunities for dynamic pricing adjustments.
Popular & Essential Airbnb Amenities in Pescaglia (2025)
Amenity Prevalence
Amenity Insights for Pescaglia
- Essential amenities in Pescaglia that guests expect include: Kitchen. Lacking these (this) could significantly impact bookings.
- Popular amenities like Washer, Hot water, TV are common but not universal. Offering these can provide a competitive edge.
- Warning: Wifi is not universally provided but is considered essential globally. Ensure reliable Wifi is offered.
Recommendations for Hosts
- Ensure your listing includes all essential amenities for Pescaglia: Kitchen.
- Prioritize adding missing essentials: Kitchen.
- Consider adding popular differentiators like Washer or Hot water to increase appeal.
- Highlight unique or less common amenities you offer (e.g., hot tub, dedicated workspace, EV charger) in your listing description and photos.
- Regularly check competitor amenities in Pescaglia to stay competitive.
Pescaglia Airbnb Guest Demographics & Profile Analysis (2025)
Guest Profile Summary for Pescaglia
- The typical guest profile for Airbnb in Pescaglia consists of predominantly international visitors (89%), with top international origins including United Kingdom, typically belonging to the Post-2000s (Gen Z/Alpha) group (50%), primarily speaking English or German.
- Domestic travelers account for 11.0% of guests.
- Key international markets include Germany (29.1%) and United Kingdom (12.4%).
- Top languages spoken are English (39%) followed by German (19.9%).
- A significant demographic segment is the Post-2000s (Gen Z/Alpha) group, representing 50% of guests.
Recommendations for Hosts
- Focus marketing internationally, particularly towards travelers from United Kingdom.
- Tailor amenities and listing descriptions to appeal to the dominant Post-2000s (Gen Z/Alpha) demographic (e.g., highlight fast WiFi, smart home features, local guides).
- Highlight unique local experiences or amenities relevant to the primary guest profile.
- Consider seasonal promotions aligned with peak travel times for key origin markets.
Nearby Short-Term Rental Market Comparison
How does the Pescaglia Airbnb market stack up against its neighbors? Compare key performance metrics like average monthly revenue, ADR, and occupancy rates in surrounding areas to understand the broader regional STR landscape.
| Market | Active Properties | Monthly Revenue | Daily Rate | Avg. Occupancy |
|---|---|---|---|---|
| Portofino | 68 | $4,086 | $454.35 | 44% |
| Crespina | 16 | $3,526 | $493.64 | 48% |
| Tignano | 10 | $3,391 | $500.31 | 36% |
| Luni Mare | 11 | $3,102 | $169.59 | 40% |
| Buonconvento | 59 | $3,068 | $456.70 | 46% |
| Monterosso al Mare | 350 | $2,958 | $248.25 | 57% |
| Castelfranco di Sotto | 47 | $2,881 | $294.54 | 38% |
| Florence | 9,598 | $2,833 | $208.48 | 52% |
| Riomaggiore | 640 | $2,789 | $196.57 | 57% |
| Marcialla | 25 | $2,788 | $236.61 | 54% |