Pelago Airbnb Market Analysis 2025: Short Term Rental Data & Vacation Rental Statistics in Tuscany, Italy
Is Airbnb profitable in Pelago in 2025? Explore comprehensive Airbnb analytics for Pelago, Tuscany, Italy to uncover income potential. This 2025 STR market report for Pelago, based on AirROI data from April 2024 to March 2025, reveals key trends in the niche market of 85 active listings.
Whether you're considering an Airbnb investment in Pelago, optimizing your existing vacation rental, or exploring rental arbitrage opportunities, understanding the Pelago Airbnb data is crucial. Navigating the high regulation landscape is key to maximizing your short term rental income potential. Let's dive into the specifics.
Key Pelago Airbnb Performance Metrics Overview
Monthly Airbnb Revenue Variations & Income Potential in Pelago (2025)
Understanding the monthly revenue variations for Airbnb listings in Pelago is key to maximizing your short term rental income potential. Seasonality significantly impacts earnings. Our analysis, based on data from the past 12 months, shows that the peak revenue month for STRs in Pelago is typically August, while February often presents the lowest earnings, highlighting opportunities for strategic pricing adjustments during shoulder and low seasons. Explore the typical Airbnb income in Pelago across different performance tiers:
- Best-in-class properties (Top 10%) achieve $3,980+ monthly, often utilizing dynamic pricing and superior guest experiences.
- Strong performing properties (Top 25%) earn $2,418 or more, indicating effective management and desirable locations/amenities.
- Typical properties (Median) generate around $1,215 per month, representing the average market performance.
- Entry-level properties (Bottom 25%) see earnings around $613, often with potential for optimization.
Average Monthly Airbnb Earnings Trend in Pelago
Pelago Airbnb Occupancy Rate Trends (2025)
Maximize your bookings by understanding the Pelago STR occupancy trends. Seasonal demand shifts significantly influence how often properties are booked. Typically, Augustsees the highest demand (peak season occupancy), while January experiences the lowest (low season). Effective strategies, like adjusting minimum stays or offering promotions, can boost occupancy during slower periods. Here's how different property tiers perform in Pelago:
- Best-in-class properties (Top 10%) achieve 70%+ occupancy, indicating high desirability and potentially optimized availability.
- Strong performing properties (Top 25%) maintain 50% or higher occupancy, suggesting good market fit and guest satisfaction.
- Typical properties (Median) have an occupancy rate around 32%.
- Entry-level properties (Bottom 25%) average 14% occupancy, potentially facing higher vacancy.
Average Monthly Occupancy Rate Trend in Pelago
Average Daily Rate (ADR) Airbnb Trends in Pelago (2025)
Effective short term rental pricing strategy in Pelago involves understanding monthly ADR fluctuations. The Average Daily Rate (ADR) for Airbnb in Pelago typically peaks in August and dips lowest during March. Leveraging Airbnb dynamic pricing tools or strategies based on this seasonality can significantly boost revenue. Here's a look at the typical nightly rates achieved:
- Best-in-class properties (Top 10%) command rates of $341+ per night, often due to premium features or locations.
- Strong performing properties (Top 25%) achieve nightly rates of $171 or more.
- Typical properties (Median) charge around $125 per night.
- Entry-level properties (Bottom 25%) earn around $90 per night.
Average Daily Rate (ADR) Trend by Month in Pelago
Get Live Pelago Market Intelligence 👇

Explore Real-time Analytics
Airbnb Seasonality Analysis & Trends in Pelago (2025)
Peak Season (August, July, May)
- Revenue averages $3,092 per month
- Occupancy rates average 47.7%
- Daily rates average $200
Shoulder Season
- Revenue averages $1,781 per month
- Occupancy maintains around 35.1%
- Daily rates hold near $184
Low Season (February, March, December)
- Revenue drops to average $809 per month
- Occupancy decreases to average 22.3%
- Daily rates adjust to average $161
Seasonality Insights for Pelago
- The Airbnb seasonality in Pelago shows highly seasonal trends requiring careful strategy. While the sections above show seasonal averages, it's also insightful to look at the extremes:
- During the high season, the absolute peak month showcases Pelago's highest earning potential, with monthly revenues capable of climbing to $3,611, occupancy reaching a high of 57.8%, and ADRs peaking at $204.
- Conversely, the slowest single month of the year, typically falling within the low season, marks the market's lowest point. In this month, revenue might dip to $747, occupancy could drop to 19.0%, and ADRs may adjust down to $159.
- Understanding both the seasonal averages and these monthly peaks and troughs in revenue, occupancy, and ADR is crucial for maximizing your Airbnb profit potential in Pelago.
Seasonal Strategies for Maximizing Profit
- Peak Season: Maximize revenue through premium pricing and potentially longer minimum stays. Ensure high availability.
- Low Season: Offer competitive pricing, special promotions (e.g., extended stay discounts), and flexible cancellation policies. Target off-season travelers like remote workers or budget-conscious guests.
- Shoulder Seasons: Implement dynamic pricing that balances peak and low rates. Target weekend travelers or specific events. Offer slightly more flexible terms than peak season.
- Regularly analyze your own performance against these Pelago seasonality benchmarks and adjust your pricing and availability strategy accordingly.
Best Areas for Airbnb Investment in Pelago (2025)
Exploring the top neighborhoods for short-term rentals in Pelago? This section highlights key areas, outlining why they are attractive for hosts and guests, along with notable local attractions. Consider these locations based on your target guest profile and investment strategy.
| Neighborhood / Area | Why Host Here? (Target Guests & Appeal) | Key Attractions & Landmarks |
|---|---|---|
| Pelago Centro | Charming town center with historical architecture and a local market. Ideal for travelers wanting an authentic Tuscan experience close to amenities and local culture. | Pieve di San Bartolomeo, San Francesco Convent, Local cafes and restaurants, Pelago Market, Scenic countryside views |
| Cortona | Famed Tuscan hilltown known for its stunning views and rich history. Attracts tourists for its art, culture, and proximity to Lake Trasimeno. | Etruscan Academy Museum of the Etruscan Civilization, Bramasole, Cortona town walls, Lake Trasimeno, Incredible hillside vistas |
| Fiesole | Picturesque town just outside Florence, known for its archaeological sites and incredible views of the Florence skyline. Perfect for visitors looking to explore both Fiesole and Florence. | Roman Theatre of Fiesole, Fiesole Cathedral, San Francesco Monastery, Museo Bandini, Beautiful hiking trails |
| San Giovanni Valdarno | A historic town with a vibrant atmosphere, known for its delicious cuisine and local festivals, making it a great choice for families and food lovers. | Piazza Masaccio, Museo della Basilica di Santa Maria delle Grazie, Local eateries, San Giovanni Historical Center, Surrounding vineyards |
| Trequanda | A lesser-known gem in the Chianti region, perfect for those seeking peace and tranquility amid stunning landscapes and fine wines. | Castello di trequanda, Vineyards and wineries, Local olive oil production, Scenic countryside hikes, Traditional Tuscan villas |
| Montefioralle | A small medieval hamlet that offers an authentic experience of Tuscany, with enchanting views and a sense of history. | Ancient stone walls, Charming narrow streets, Local wine cellars, Surrounding vineyards, Picturesque landscapes |
| Greve in Chianti | Town is the heart of the Chianti wine region, known for its wine production and beautiful countryside. A great base for wine lovers. | Piazza Matteotti, Chianti Wine Museum, Enoteca Falorni, Surrounding vineyards, Wine tours and tastings |
| Rignano sull'Arno | Located along the Arno River, it offers beautiful views and proximity to Florence, appealing for those wanting to explore the nearby city while enjoying nature. | Castello di Nipozzano, Beautiful walking trails, Local gardens, Rignano Historic Center, Views along the Arno River |
Understanding Airbnb License Requirements & STR Laws in Pelago (2025)
Yes, Pelago, Tuscany, Italy enforces high STR regulations. Obtaining a license and ensuring compliance is almost certainly required according to current 2025 STR laws. Always verify the latest short term rental regulations and Airbnb license requirements directly with local government authorities for Pelago to ensure full compliance before hosting.
(Source: AirROI data, 2025, based on 59% licensed listings)
Top Performing Airbnb Properties in Pelago (2025)
Benchmark your potential! Explore examples of top-performing Airbnb properties in Pelagobased on Trailing Twelve Month (TTM) revenue. Analyze their characteristics, revenue, occupancy rate, and ADR to understand what drives success in this market.
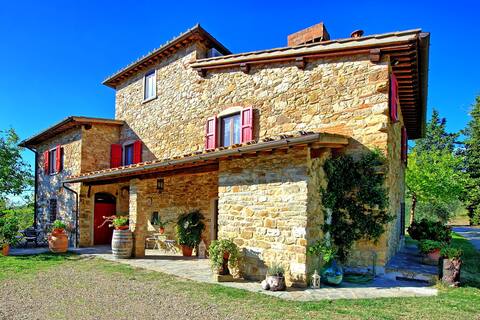
San Guido - Country house with pool near Florence,
Entire Place • 3 bedrooms
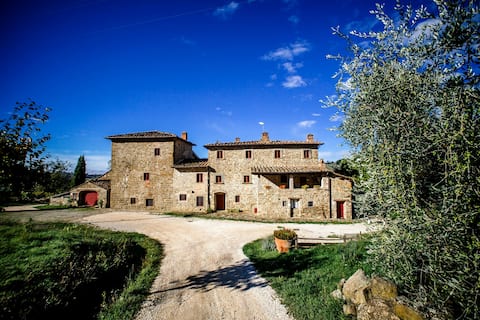
FARMHOUSE PALAIA near Florence all in exclusive
Entire Place • 10 bedrooms

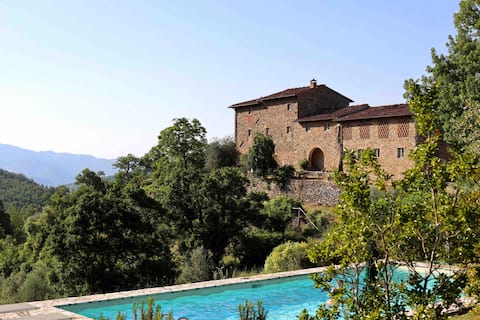
The Castle of Ferrano - Castle in Tuscany
Entire Place • 1 bedroom
Villa in Collina with Pool
Entire Place • 4 bedrooms
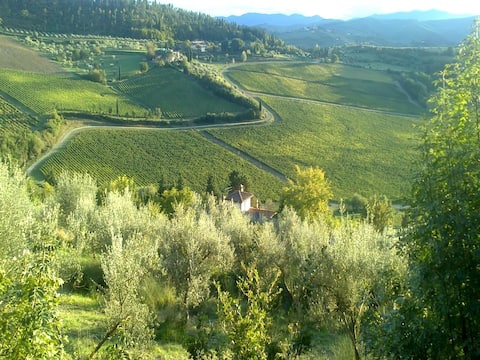
Tuscan vineyard home. Near Florence
Entire Place • 3 bedrooms

Camera Deluxe Tenuta Risalpiano
Entire Place • N/A
Note: Performance varies based on location, size, amenities, seasonality, and management quality. Data reflects the past 12 months.
Top Performing Airbnb Hosts in Pelago (2025)
Learn from the best! This table showcases top-performing Airbnb hosts in Pelago based on the number of properties managed and estimated total revenue over the past year. Analyze their scale and performance metrics.
| Host Name | Properties | Grossing Revenue | Stay Reviews | Avg Rating |
|---|---|---|---|---|
| Azienda Agricola Palaia | 4 | $154,587 | 216 | 4.84/5.0 |
| Valentina | 4 | $113,204 | 463 | 4.89/5.0 |
| Jane | 4 | $110,547 | 95 | 4.99/5.0 |
| Posarelli Villas | 1 | $91,659 | 22 | 5.00/5.0 |
| Fabrizio | 1 | $75,153 | 182 | 4.99/5.0 |
| Villa Toscanna | 4 | $67,174 | 45 | 4.63/5.0 |
| Susannah Caroline | 7 | $59,788 | 62 | 2.84/5.0 |
| Tom | 5 | $51,857 | 32 | 5.00/5.0 |
| Adele | 1 | $37,071 | 12 | 4.92/5.0 |
| Italy D'Elite | 1 | $26,909 | 5 | 4.60/5.0 |
Analyzing the strategies of top hosts, such as their property selection, pricing, and guest communication, can offer valuable lessons for optimizing your own Airbnb operations in Pelago.
Dive Deeper: Advanced Pelago STR Market Data (2025)
Ready to unlock more insights? AirROI provides access to advanced metrics and comprehensive Airbnb data for Pelago. Explore detailed analytics beyond this report to refine your investment strategy, optimize pricing, and maximize your vacation rental profits.
Explore Advanced MetricsPelago Short-Term Rental Market Composition (2025): Property & Room Types
Room Type Distribution
Property Type Distribution
Market Composition Insights for Pelago
- The Pelago Airbnb market composition is heavily skewed towards Entire Home/Apt listings, which make up 75.3% of the 85 active rentals. This indicates strong guest preference for privacy and space.
- Looking at the property type distribution in Pelago, Apartment/Condo properties are the most common (37.6%), reflecting the local real estate landscape.
- Houses represent a significant 31.8% portion, catering likely to families or larger groups.
- The presence of 15.3% Hotel/Boutique listings indicates integration with traditional hospitality.
- Smaller segments like unique stays, others (combined 4.7%) offer potential for unique stay experiences.
Pelago Airbnb Room Capacity Analysis (2025): Bedroom Distribution
Distribution of Listings by Number of Bedrooms
Room Capacity Insights for Pelago
- The dominant room capacity in Pelago is 1 bedroom listings, making up 34.1% of the market. This suggests a strong demand for properties suitable for couples or solo travelers.
- Together, 1 bedroom and 2 bedrooms properties represent 58.8% of the active Airbnb listings in Pelago, indicating a high concentration in these sizes.
- A significant 22.4% of listings offer 3+ bedrooms, catering to larger groups and families seeking more space in Pelago.
Pelago Vacation Rental Guest Capacity Trends (2025)
Distribution of Listings by Guest Capacity
Guest Capacity Insights for Pelago
- The most common guest capacity trend in Pelago vacation rentals is listings accommodating 4 guests (29.4%). This suggests the primary traveler segment is likely small families or groups.
- Properties designed for 4 guests and 8+ guests dominate the Pelago STR market, accounting for 43.5% of listings.
- 27.1% of properties accommodate 6+ guests, serving the market segment for larger families or group travel in Pelago.
- On average, properties in Pelago are equipped to host 3.9 guests.
Pelago Airbnb Booking Patterns (2025): Available vs. Booked Days
Available Days Distribution
Booked Days Distribution
Booking Pattern Insights for Pelago
- The most common availability pattern in Pelago falls within the 271-366 days range, representing 64.7% of listings. This suggests many properties have significant open periods on their calendars.
- Approximately 87.1% of listings show high availability (181+ days open annually), indicating potential for increased bookings or specific owner usage patterns.
- For booked days, the 31-90 days range is most frequent in Pelago (32.9%), reflecting common guest stay durations or potential owner blocking patterns.
- A notable 13.0% of properties secure long booking periods (181+ days booked per year), highlighting successful long-term rental strategies or significant owner usage.
Pelago Airbnb Minimum Stay Requirements Analysis
Distribution of Listings by Minimum Night Requirement
1 Night
21 listings
25% of total
2 Nights
13 listings
15.5% of total
3 Nights
19 listings
22.6% of total
4-6 Nights
12 listings
14.3% of total
7-29 Nights
11 listings
13.1% of total
30+ Nights
8 listings
9.5% of total
Key Insights
- The most prevalent minimum stay requirement in Pelago is 1 Night, adopted by 25% of listings. This highlights the market's preference for shorter, flexible bookings.
Recommendations
- Align with the market by considering a 1 Night minimum stay, as 25% of Pelago hosts use this setting.
- If feasible, allowing 1-night stays, especially midweek or during low season, could capture last-minute bookings, as only 25% currently do.
- Explore offering discounts for stays of 30+ nights to attract the 9.5% of the market seeking extended stays.
- Adjust minimum nights based on seasonality – potentially shorter during low season and longer during peak demand periods in Pelago.
Pelago Airbnb Cancellation Policy Trends Analysis (2025)
Super Strict 30 Days
12 listings
16.2% of total
Super Strict 60 Days
2 listings
2.7% of total
Flexible
22 listings
29.7% of total
Moderate
31 listings
41.9% of total
Strict
7 listings
9.5% of total
Cancellation Policy Insights for Pelago
- The prevailing Airbnb cancellation policy trend in Pelago is Moderate, used by 41.9% of listings.
- The market strongly favors guest-friendly terms, with 71.6% of listings offering Flexible or Moderate policies. This suggests guests in Pelago may expect booking flexibility.
- Strict cancellation policies are quite rare (9.5%), potentially making listings with this policy less competitive unless justified by high demand or property type.
Recommendations for Hosts
- Consider adopting a Moderate policy to align with the 41.9% market standard in Pelago.
- Using a Strict policy might deter some guests, as only 9.5% of listings use it. Evaluate if potential revenue protection outweighs possible lower booking rates.
- Regularly review your cancellation policy against competitors and market demand shifts in Pelago.
Pelago STR Booking Lead Time Analysis (2025)
Average Booking Lead Time by Month
Booking Lead Time Insights for Pelago
- The overall average booking lead time for vacation rentals in Pelago is 67 days.
- Guests book furthest in advance for stays during September (average 121 days), likely coinciding with peak travel demand or local events.
- The shortest booking windows occur for stays in March (average 23 days), indicating more last-minute travel plans during this time.
- Seasonally, Summer (95 days avg.) sees the longest lead times, while Winter (64 days avg.) has the shortest, reflecting typical travel planning cycles.
Recommendations for Hosts
- Use the overall average lead time (67 days) as a baseline for your pricing and availability strategy in Pelago.
- For September stays, consider implementing length-of-stay discounts or slightly higher rates for bookings made less than 121 days out to capitalize on advance planning.
- Target marketing efforts for the Summer season well in advance (at least 95 days) to capture early planners.
- Monitor your own booking lead times against these Pelago averages to identify opportunities for dynamic pricing adjustments.
Popular & Essential Airbnb Amenities in Pelago (2025)
Amenity Prevalence
Amenity Insights for Pelago
- Popular amenities like Heating, Free parking on premises, Hot water are common but not universal. Offering these can provide a competitive edge.
- Warning: Wifi is not universally provided but is considered essential globally. Ensure reliable Wifi is offered.
Recommendations for Hosts
- Consider adding popular differentiators like Heating or Free parking on premises to increase appeal.
- Highlight unique or less common amenities you offer (e.g., hot tub, dedicated workspace, EV charger) in your listing description and photos.
- Regularly check competitor amenities in Pelago to stay competitive.
Pelago Airbnb Guest Demographics & Profile Analysis (2025)
Guest Profile Summary for Pelago
- The typical guest profile for Airbnb in Pelago consists of predominantly international visitors (93%), with top international origins including Germany, typically belonging to the Post-2000s (Gen Z/Alpha) group (50%), primarily speaking English or German.
- Domestic travelers account for 6.7% of guests.
- Key international markets include United States (20.4%) and Germany (13.7%).
- Top languages spoken are English (44.5%) followed by German (10.9%).
- A significant demographic segment is the Post-2000s (Gen Z/Alpha) group, representing 50% of guests.
Recommendations for Hosts
- Focus marketing internationally, particularly towards travelers from Germany.
- Tailor amenities and listing descriptions to appeal to the dominant Post-2000s (Gen Z/Alpha) demographic (e.g., highlight fast WiFi, smart home features, local guides).
- Highlight unique local experiences or amenities relevant to the primary guest profile.
- Consider seasonal promotions aligned with peak travel times for key origin markets.
Nearby Short-Term Rental Market Comparison
How does the Pelago Airbnb market stack up against its neighbors? Compare key performance metrics like average monthly revenue, ADR, and occupancy rates in surrounding areas to understand the broader regional STR landscape.
| Market | Active Properties | Monthly Revenue | Daily Rate | Avg. Occupancy |
|---|---|---|---|---|
| Crespina | 16 | $3,526 | $493.64 | 48% |
| Tignano | 10 | $3,391 | $500.31 | 36% |
| Luni Mare | 11 | $3,102 | $169.59 | 40% |
| Buonconvento | 59 | $3,068 | $456.70 | 46% |
| Castelfranco di Sotto | 47 | $2,881 | $294.54 | 38% |
| Collazzone | 28 | $2,839 | $341.11 | 36% |
| Florence | 9,598 | $2,833 | $208.48 | 52% |
| Marcialla | 25 | $2,788 | $236.61 | 54% |
| Parrano | 18 | $2,762 | $329.95 | 34% |
| Impruneta | 131 | $2,761 | $237.93 | 45% |