Montieri Airbnb Market Analysis 2025: Short Term Rental Data & Vacation Rental Statistics in Tuscany, Italy
Is Airbnb profitable in Montieri in 2025? Explore comprehensive Airbnb analytics for Montieri, Tuscany, Italy to uncover income potential. This 2025 STR market report for Montieri, based on AirROI data from April 2024 to March 2025, reveals key trends in the niche market of 51 active listings.
Whether you're considering an Airbnb investment in Montieri, optimizing your existing vacation rental, or exploring rental arbitrage opportunities, understanding the Montieri Airbnb data is crucial. Navigating the high regulation landscape is key to maximizing your short term rental income potential. Let's dive into the specifics.
Key Montieri Airbnb Performance Metrics Overview
Monthly Airbnb Revenue Variations & Income Potential in Montieri (2025)
Understanding the monthly revenue variations for Airbnb listings in Montieri is key to maximizing your short term rental income potential. Seasonality significantly impacts earnings. Our analysis, based on data from the past 12 months, shows that the peak revenue month for STRs in Montieri is typically August, while December often presents the lowest earnings, highlighting opportunities for strategic pricing adjustments during shoulder and low seasons. Explore the typical Airbnb income in Montieri across different performance tiers:
- Best-in-class properties (Top 10%) achieve $2,117+ monthly, often utilizing dynamic pricing and superior guest experiences.
- Strong performing properties (Top 25%) earn $1,292 or more, indicating effective management and desirable locations/amenities.
- Typical properties (Median) generate around $654 per month, representing the average market performance.
- Entry-level properties (Bottom 25%) see earnings around $255, often with potential for optimization.
Average Monthly Airbnb Earnings Trend in Montieri
Montieri Airbnb Occupancy Rate Trends (2025)
Maximize your bookings by understanding the Montieri STR occupancy trends. Seasonal demand shifts significantly influence how often properties are booked. Typically, Augustsees the highest demand (peak season occupancy), while April experiences the lowest (low season). Effective strategies, like adjusting minimum stays or offering promotions, can boost occupancy during slower periods. Here's how different property tiers perform in Montieri:
- Best-in-class properties (Top 10%) achieve 59%+ occupancy, indicating high desirability and potentially optimized availability.
- Strong performing properties (Top 25%) maintain 41% or higher occupancy, suggesting good market fit and guest satisfaction.
- Typical properties (Median) have an occupancy rate around 24%.
- Entry-level properties (Bottom 25%) average 10% occupancy, potentially facing higher vacancy.
Average Monthly Occupancy Rate Trend in Montieri
Average Daily Rate (ADR) Airbnb Trends in Montieri (2025)
Effective short term rental pricing strategy in Montieri involves understanding monthly ADR fluctuations. The Average Daily Rate (ADR) for Airbnb in Montieri typically peaks in July and dips lowest during November. Leveraging Airbnb dynamic pricing tools or strategies based on this seasonality can significantly boost revenue. Here's a look at the typical nightly rates achieved:
- Best-in-class properties (Top 10%) command rates of $162+ per night, often due to premium features or locations.
- Strong performing properties (Top 25%) achieve nightly rates of $119 or more.
- Typical properties (Median) charge around $89 per night.
- Entry-level properties (Bottom 25%) earn around $62 per night.
Average Daily Rate (ADR) Trend by Month in Montieri
Get Live Montieri Market Intelligence 👇

Explore Real-time Analytics
Airbnb Seasonality Analysis & Trends in Montieri (2025)
Peak Season (August, July, May)
- Revenue averages $1,391 per month
- Occupancy rates average 41.5%
- Daily rates average $100
Shoulder Season
- Revenue averages $852 per month
- Occupancy maintains around 23.6%
- Daily rates hold near $97
Low Season (February, October, December)
- Revenue drops to average $668 per month
- Occupancy decreases to average 22.0%
- Daily rates adjust to average $96
Seasonality Insights for Montieri
- The Airbnb seasonality in Montieri shows highly seasonal trends requiring careful strategy. While the sections above show seasonal averages, it's also insightful to look at the extremes:
- During the high season, the absolute peak month showcases Montieri's highest earning potential, with monthly revenues capable of climbing to $1,739, occupancy reaching a high of 55.7%, and ADRs peaking at $102.
- Conversely, the slowest single month of the year, typically falling within the low season, marks the market's lowest point. In this month, revenue might dip to $631, occupancy could drop to 19.0%, and ADRs may adjust down to $92.
- Understanding both the seasonal averages and these monthly peaks and troughs in revenue, occupancy, and ADR is crucial for maximizing your Airbnb profit potential in Montieri.
Seasonal Strategies for Maximizing Profit
- Peak Season: Maximize revenue through premium pricing and potentially longer minimum stays. Ensure high availability.
- Low Season: Offer competitive pricing, special promotions (e.g., extended stay discounts), and flexible cancellation policies. Target off-season travelers like remote workers or budget-conscious guests.
- Shoulder Seasons: Implement dynamic pricing that balances peak and low rates. Target weekend travelers or specific events. Offer slightly more flexible terms than peak season.
- Regularly analyze your own performance against these Montieri seasonality benchmarks and adjust your pricing and availability strategy accordingly.
Best Areas for Airbnb Investment in Montieri (2025)
Exploring the top neighborhoods for short-term rentals in Montieri? This section highlights key areas, outlining why they are attractive for hosts and guests, along with notable local attractions. Consider these locations based on your target guest profile and investment strategy.
| Neighborhood / Area | Why Host Here? (Target Guests & Appeal) | Key Attractions & Landmarks |
|---|---|---|
| Montieri Village | A charming medieval village known for its rich history and picturesque surroundings. Ideal for guests looking for a quaint, authentic Tuscan experience with local traditions. | Historic center of Montieri, Nearby nature trails, Local wineries, Traditional Tuscan cuisine, San Bartolomeo Church, Annual local festivals |
| Roccastrada | A nearby town with stunning views and a variety of outdoor activities. Perfect for tourists interested in nature, hiking, and exploring the Tuscan countryside. | Roccastrada town center, Nature parks, Hiking trails, Local olive oil farms, Scenic viewpoints, Agriturismo experiences |
| Grosseto | The capital of the province, offering urban amenities, history, and proximity to beautiful beaches. Great for those wanting a mix of city life and beach activities. | Grosseto Cathedral, Mura Medicee (Medici Walls), Museo Archeologico, Grosseto’s sandy beaches, Shopping streets, Historical architecture |
| Scansano | Famous for its Morellino di Scansano wine, this area attracts wine lovers and those seeking a rural retreat with stunning views and vineyards. | Wine tasting tours, Scansano city center, Local vineyard tours, Countryside cycling paths, Natural hot springs |
| Pitigliano | Known as 'Little Jerusalem', this town is famous for its unique architecture and historical significance. Ideal for heritage tourism and cultural experiences. | Pitigliano's old town, Etruscan caves, Synagogue and Jewish history, Beautiful architecture, Frescoes and ancient churches |
| Siena | A historical city with stunning medieval architecture and vibrant local culture. Popular among tourists for its art, history, and famous Palio horse race. | Piazza del Campo, Siena Cathedral, Palazzo Pubblico, Museo dell'Opera, Local food tours, Historic festivals |
| Castiglione della Pescaia | A coastal town known for its beaches and lively atmosphere. Attracts families and beachgoers looking for sun, sea, and outdoor activities. | Beautiful beaches, Castiglione Castle, Water sports, Local seafood restaurants, Scenic waterfront |
| Cinigiano | A quiet, rural area with breathtaking landscapes. An attractive option for guests looking for relaxation, wine tours, and rustic charm. | Local wineries, Countryside views, Cinigiano town center, Nature walks, Agricultural experiences |
Understanding Airbnb License Requirements & STR Laws in Montieri (2025)
Yes, Montieri, Tuscany, Italy enforces high STR regulations. Obtaining a license and ensuring compliance is almost certainly required according to current 2025 STR laws. Always verify the latest short term rental regulations and Airbnb license requirements directly with local government authorities for Montieri to ensure full compliance before hosting.
(Source: AirROI data, 2025, based on 51% licensed listings)
Top Performing Airbnb Properties in Montieri (2025)
Benchmark your potential! Explore examples of top-performing Airbnb properties in Montieribased on Trailing Twelve Month (TTM) revenue. Analyze their characteristics, revenue, occupancy rate, and ADR to understand what drives success in this market.
La Casina by Interhome
Entire Place • 3 bedrooms
Podere Rachele - Casa del Owl
Entire Place • 2 bedrooms
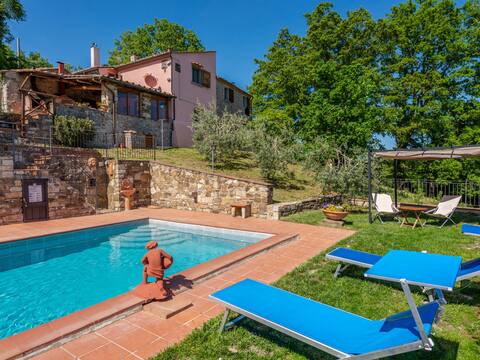
Detached idyllic house with a view
Entire Place • 1 bedroom

Idyllisches Landgut "Rocca Prataia" Casa Lavanda
Entire Place • 1 bedroom
The Island of Boccheggiano
Entire Place • 1 bedroom
Irene by Interhome
Entire Place • 1 bedroom
Note: Performance varies based on location, size, amenities, seasonality, and management quality. Data reflects the past 12 months.
Top Performing Airbnb Hosts in Montieri (2025)
Learn from the best! This table showcases top-performing Airbnb hosts in Montieri based on the number of properties managed and estimated total revenue over the past year. Analyze their scale and performance metrics.
| Host Name | Properties | Grossing Revenue | Stay Reviews | Avg Rating |
|---|---|---|---|---|
| Sandra - Interhome Group | 8 | $59,242 | 51 | 1.90/5.0 |
| Anja | 3 | $45,978 | 25 | 5.00/5.0 |
| Francesco | 3 | $35,439 | 67 | 4.76/5.0 |
| Giacomo | 2 | $18,763 | 68 | 4.95/5.0 |
| Sandra - Interhome Group | 3 | $18,145 | 12 | 4.54/5.0 |
| Claudia | 2 | $17,934 | 10 | 2.45/5.0 |
| Miriam | 3 | $16,783 | 26 | 4.90/5.0 |
| Massimo | 1 | $14,976 | 9 | 4.89/5.0 |
| Lucia | 1 | $12,695 | 45 | 4.93/5.0 |
| Elena | 1 | $10,069 | 121 | 4.84/5.0 |
Analyzing the strategies of top hosts, such as their property selection, pricing, and guest communication, can offer valuable lessons for optimizing your own Airbnb operations in Montieri.
Dive Deeper: Advanced Montieri STR Market Data (2025)
Ready to unlock more insights? AirROI provides access to advanced metrics and comprehensive Airbnb data for Montieri. Explore detailed analytics beyond this report to refine your investment strategy, optimize pricing, and maximize your vacation rental profits.
Explore Advanced MetricsMontieri Short-Term Rental Market Composition (2025): Property & Room Types
Room Type Distribution
Property Type Distribution
Market Composition Insights for Montieri
- The Montieri Airbnb market composition is heavily skewed towards Entire Home/Apt listings, which make up 86.3% of the 51 active rentals. This indicates strong guest preference for privacy and space.
- Looking at the property type distribution in Montieri, House properties are the most common (49%), reflecting the local real estate landscape.
- Houses represent a significant 49% portion, catering likely to families or larger groups.
- Smaller segments like hotel/boutique, unique stays, others (combined 7.9%) offer potential for unique stay experiences.
Montieri Airbnb Room Capacity Analysis (2025): Bedroom Distribution
Distribution of Listings by Number of Bedrooms
Room Capacity Insights for Montieri
- The dominant room capacity in Montieri is 1 bedroom listings, making up 45.1% of the market. This suggests a strong demand for properties suitable for couples or solo travelers.
- Together, 1 bedroom and 2 bedrooms properties represent 74.5% of the active Airbnb listings in Montieri, indicating a high concentration in these sizes.
Montieri Vacation Rental Guest Capacity Trends (2025)
Distribution of Listings by Guest Capacity
Guest Capacity Insights for Montieri
- The most common guest capacity trend in Montieri vacation rentals is listings accommodating 4 guests (25.5%). This suggests the primary traveler segment is likely small families or groups.
- Properties designed for 4 guests and 2 guests dominate the Montieri STR market, accounting for 47.1% of listings.
- 25.4% of properties accommodate 6+ guests, serving the market segment for larger families or group travel in Montieri.
- On average, properties in Montieri are equipped to host 4.0 guests.
Montieri Airbnb Booking Patterns (2025): Available vs. Booked Days
Available Days Distribution
Booked Days Distribution
Booking Pattern Insights for Montieri
- The most common availability pattern in Montieri falls within the 271-366 days range, representing 66.7% of listings. This suggests many properties have significant open periods on their calendars.
- Approximately 96.1% of listings show high availability (181+ days open annually), indicating potential for increased bookings or specific owner usage patterns.
- For booked days, the 1-30 days range is most frequent in Montieri (35.3%), reflecting common guest stay durations or potential owner blocking patterns.
- A notable 3.9% of properties secure long booking periods (181+ days booked per year), highlighting successful long-term rental strategies or significant owner usage.
Montieri Airbnb Minimum Stay Requirements Analysis
Distribution of Listings by Minimum Night Requirement
1 Night
18 listings
37.5% of total
2 Nights
10 listings
20.8% of total
3 Nights
1 listings
2.1% of total
4-6 Nights
3 listings
6.3% of total
7-29 Nights
15 listings
31.3% of total
30+ Nights
1 listings
2.1% of total
Key Insights
- The most prevalent minimum stay requirement in Montieri is 1 Night, adopted by 37.5% of listings. This highlights the market's preference for shorter, flexible bookings.
- Dedicated monthly rentals (30+ nights) represent a small niche (2.1%), possibly an untapped area for hosts.
Recommendations
- Align with the market by considering a 1 Night minimum stay, as 37.5% of Montieri hosts use this setting.
- Adjust minimum nights based on seasonality – potentially shorter during low season and longer during peak demand periods in Montieri.
Montieri Airbnb Cancellation Policy Trends Analysis (2025)
Super Strict 30 Days
12 listings
26.1% of total
Flexible
8 listings
17.4% of total
Moderate
15 listings
32.6% of total
Strict
11 listings
23.9% of total
Cancellation Policy Insights for Montieri
- The prevailing Airbnb cancellation policy trend in Montieri is Moderate, used by 32.6% of listings.
- There's a relatively balanced mix between guest-friendly (50.0%) and stricter (23.9%) policies, offering choices for different guest needs.
Recommendations for Hosts
- Consider adopting a Moderate policy to align with the 32.6% market standard in Montieri.
- Regularly review your cancellation policy against competitors and market demand shifts in Montieri.
Montieri STR Booking Lead Time Analysis (2025)
Average Booking Lead Time by Month
Booking Lead Time Insights for Montieri
- The overall average booking lead time for vacation rentals in Montieri is 58 days.
- Guests book furthest in advance for stays during November (average 164 days), likely coinciding with peak travel demand or local events.
- The shortest booking windows occur for stays in February (average 0 days), indicating more last-minute travel plans during this time.
- Seasonally, Fall (112 days avg.) sees the longest lead times, while Winter (13 days avg.) has the shortest, reflecting typical travel planning cycles.
Recommendations for Hosts
- Use the overall average lead time (58 days) as a baseline for your pricing and availability strategy in Montieri.
- For November stays, consider implementing length-of-stay discounts or slightly higher rates for bookings made less than 164 days out to capitalize on advance planning.
- During February, focus on last-minute booking availability and promotions, as guests book with very short notice (0 days avg.).
- Target marketing efforts for the Fall season well in advance (at least 112 days) to capture early planners.
- Monitor your own booking lead times against these Montieri averages to identify opportunities for dynamic pricing adjustments.
Popular & Essential Airbnb Amenities in Montieri (2025)
Amenity Prevalence
Amenity Insights for Montieri
- Popular amenities like Kitchen, Hot water, Hangers are common but not universal. Offering these can provide a competitive edge.
- Warning: Wifi is not universally provided but is considered essential globally. Ensure reliable Wifi is offered.
Recommendations for Hosts
- Consider adding popular differentiators like Kitchen or Hot water to increase appeal.
- Highlight unique or less common amenities you offer (e.g., hot tub, dedicated workspace, EV charger) in your listing description and photos.
- Regularly check competitor amenities in Montieri to stay competitive.
Montieri Airbnb Guest Demographics & Profile Analysis (2025)
Guest Profile Summary for Montieri
- The typical guest profile for Airbnb in Montieri consists of predominantly international visitors (66%), with top international origins including Germany, typically belonging to the Post-2000s (Gen Z/Alpha) group (50%), primarily speaking English or Italian.
- Domestic travelers account for 33.6% of guests.
- Key international markets include Italy (33.6%) and Germany (19%).
- Top languages spoken are English (37%) followed by Italian (15.1%).
- A significant demographic segment is the Post-2000s (Gen Z/Alpha) group, representing 50% of guests.
Recommendations for Hosts
- Focus marketing internationally, particularly towards travelers from Germany.
- Tailor amenities and listing descriptions to appeal to the dominant Post-2000s (Gen Z/Alpha) demographic (e.g., highlight fast WiFi, smart home features, local guides).
- Highlight unique local experiences or amenities relevant to the primary guest profile.
- Consider seasonal promotions aligned with peak travel times for key origin markets.
Nearby Short-Term Rental Market Comparison
How does the Montieri Airbnb market stack up against its neighbors? Compare key performance metrics like average monthly revenue, ADR, and occupancy rates in surrounding areas to understand the broader regional STR landscape.
| Market | Active Properties | Monthly Revenue | Daily Rate | Avg. Occupancy |
|---|---|---|---|---|
| Crespina | 16 | $3,526 | $493.64 | 48% |
| Tignano | 10 | $3,391 | $500.31 | 36% |
| Luni Mare | 11 | $3,102 | $169.59 | 40% |
| Buonconvento | 59 | $3,068 | $456.70 | 46% |
| Castelfranco di Sotto | 47 | $2,881 | $294.54 | 38% |
| Collazzone | 28 | $2,839 | $341.11 | 36% |
| Florence | 9,598 | $2,833 | $208.48 | 52% |
| Marcialla | 25 | $2,788 | $236.61 | 54% |
| Parrano | 18 | $2,762 | $329.95 | 34% |
| Impruneta | 131 | $2,761 | $237.93 | 45% |