Montevarchi Airbnb Market Analysis 2025: Short Term Rental Data & Vacation Rental Statistics in Tuscany, Italy
Is Airbnb profitable in Montevarchi in 2025? Explore comprehensive Airbnb analytics for Montevarchi, Tuscany, Italy to uncover income potential. This 2025 STR market report for Montevarchi, based on AirROI data from April 2024 to March 2025, reveals key trends in the niche market of 64 active listings.
Whether you're considering an Airbnb investment in Montevarchi, optimizing your existing vacation rental, or exploring rental arbitrage opportunities, understanding the Montevarchi Airbnb data is crucial. Navigating the high regulation landscape is key to maximizing your short term rental income potential. Let's dive into the specifics.
Key Montevarchi Airbnb Performance Metrics Overview
Monthly Airbnb Revenue Variations & Income Potential in Montevarchi (2025)
Understanding the monthly revenue variations for Airbnb listings in Montevarchi is key to maximizing your short term rental income potential. Seasonality significantly impacts earnings. Our analysis, based on data from the past 12 months, shows that the peak revenue month for STRs in Montevarchi is typically July, while January often presents the lowest earnings, highlighting opportunities for strategic pricing adjustments during shoulder and low seasons. Explore the typical Airbnb income in Montevarchi across different performance tiers:
- Best-in-class properties (Top 10%) achieve $4,020+ monthly, often utilizing dynamic pricing and superior guest experiences.
- Strong performing properties (Top 25%) earn $2,141 or more, indicating effective management and desirable locations/amenities.
- Typical properties (Median) generate around $1,047 per month, representing the average market performance.
- Entry-level properties (Bottom 25%) see earnings around $411, often with potential for optimization.
Average Monthly Airbnb Earnings Trend in Montevarchi
Montevarchi Airbnb Occupancy Rate Trends (2025)
Maximize your bookings by understanding the Montevarchi STR occupancy trends. Seasonal demand shifts significantly influence how often properties are booked. Typically, Augustsees the highest demand (peak season occupancy), while January experiences the lowest (low season). Effective strategies, like adjusting minimum stays or offering promotions, can boost occupancy during slower periods. Here's how different property tiers perform in Montevarchi:
- Best-in-class properties (Top 10%) achieve 64%+ occupancy, indicating high desirability and potentially optimized availability.
- Strong performing properties (Top 25%) maintain 44% or higher occupancy, suggesting good market fit and guest satisfaction.
- Typical properties (Median) have an occupancy rate around 23%.
- Entry-level properties (Bottom 25%) average 11% occupancy, potentially facing higher vacancy.
Average Monthly Occupancy Rate Trend in Montevarchi
Average Daily Rate (ADR) Airbnb Trends in Montevarchi (2025)
Effective short term rental pricing strategy in Montevarchi involves understanding monthly ADR fluctuations. The Average Daily Rate (ADR) for Airbnb in Montevarchi typically peaks in July and dips lowest during April. Leveraging Airbnb dynamic pricing tools or strategies based on this seasonality can significantly boost revenue. Here's a look at the typical nightly rates achieved:
- Best-in-class properties (Top 10%) command rates of $378+ per night, often due to premium features or locations.
- Strong performing properties (Top 25%) achieve nightly rates of $218 or more.
- Typical properties (Median) charge around $118 per night.
- Entry-level properties (Bottom 25%) earn around $78 per night.
Average Daily Rate (ADR) Trend by Month in Montevarchi
Get Live Montevarchi Market Intelligence 👇

Explore Real-time Analytics
Airbnb Seasonality Analysis & Trends in Montevarchi (2025)
Peak Season (July, August, April)
- Revenue averages $2,579 per month
- Occupancy rates average 39.3%
- Daily rates average $179
Shoulder Season
- Revenue averages $1,635 per month
- Occupancy maintains around 29.2%
- Daily rates hold near $175
Low Season (January, February, March)
- Revenue drops to average $668 per month
- Occupancy decreases to average 23.1%
- Daily rates adjust to average $171
Seasonality Insights for Montevarchi
- The Airbnb seasonality in Montevarchi shows highly seasonal trends requiring careful strategy. While the sections above show seasonal averages, it's also insightful to look at the extremes:
- During the high season, the absolute peak month showcases Montevarchi's highest earning potential, with monthly revenues capable of climbing to $2,892, occupancy reaching a high of 41.6%, and ADRs peaking at $184.
- Conversely, the slowest single month of the year, typically falling within the low season, marks the market's lowest point. In this month, revenue might dip to $538, occupancy could drop to 16.0%, and ADRs may adjust down to $170.
- Understanding both the seasonal averages and these monthly peaks and troughs in revenue, occupancy, and ADR is crucial for maximizing your Airbnb profit potential in Montevarchi.
Seasonal Strategies for Maximizing Profit
- Peak Season: Maximize revenue through premium pricing and potentially longer minimum stays. Ensure high availability.
- Low Season: Offer competitive pricing, special promotions (e.g., extended stay discounts), and flexible cancellation policies. Target off-season travelers like remote workers or budget-conscious guests.
- Shoulder Seasons: Implement dynamic pricing that balances peak and low rates. Target weekend travelers or specific events. Offer slightly more flexible terms than peak season.
- Regularly analyze your own performance against these Montevarchi seasonality benchmarks and adjust your pricing and availability strategy accordingly.
Best Areas for Airbnb Investment in Montevarchi (2025)
Exploring the top neighborhoods for short-term rentals in Montevarchi? This section highlights key areas, outlining why they are attractive for hosts and guests, along with notable local attractions. Consider these locations based on your target guest profile and investment strategy.
| Neighborhood / Area | Why Host Here? (Target Guests & Appeal) | Key Attractions & Landmarks |
|---|---|---|
| Centro Storico | The historical center of Montevarchi is rich in culture and history, attracting tourists who want to experience the authentic Tuscan life and local traditions. | Piazza Vittorio Emanuele II, Montevarchi Museum of Historical Memories, Sant'Angelo Church, Local wine shops, Traditional Tuscan restaurants |
| Parco del Boscolo | A peaceful neighborhood with access to parks and outdoor activities, perfect for families and nature lovers looking for a relaxing getaway. | Parco del Boscolo, Nature trails, Playgrounds, Picnic areas, Cafes |
| Via Roma | A vibrant street lined with shops, cafes, and restaurants that offers a lively atmosphere and easy access to local attractions. | Shops and boutiques, Cafes, Local eateries, Artisan markets, Historic buildings |
| Zona Universitaria | Close to educational institutions and popular among students and visiting families, this area offers affordable accommodations and a youthful vibe. | University campus, Student events, Affordable dining options, Libraries, Cultural events |
| Borgo San Lorenzo | A picturesque area with traditional Tuscan architecture and charming streets, ideal for guests looking to embrace local culture. | Charming streets, Local markets, Historic architecture, Artisan shops, Parks |
| Local Vineyards | Surrounded by stunning vineyards in the Chianti region, this area attracts wine lovers and tourists looking for wine tours and tastings. | Wine tasting tours, Scenic vineyards, Local wineries, Gastronomy experiences, Workshops |
| San Lorenzo | A quaint neighborhood known for its culinary scene, perfect for food enthusiasts who want to sample authentic Tuscan cuisine. | Local restaurants, Food markets, Cooking classes, Culinary workshops, Vineyard tours |
| Outdoor Recreational Areas | Perfect for adventure seekers with many opportunities for hiking, biking, and enjoying outdoor sports in the surrounding countryside. | Hiking trails, Biking routes, Outdoor sports facilities, Scenic views, Nature experiences |
Understanding Airbnb License Requirements & STR Laws in Montevarchi (2025)
Yes, Montevarchi, Tuscany, Italy enforces high STR regulations. Obtaining a license and ensuring compliance is almost certainly required according to current 2025 STR laws. Always verify the latest short term rental regulations and Airbnb license requirements directly with local government authorities for Montevarchi to ensure full compliance before hosting.
(Source: AirROI data, 2025, based on 53% licensed listings)
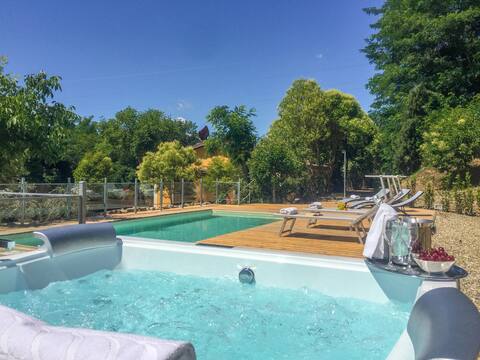
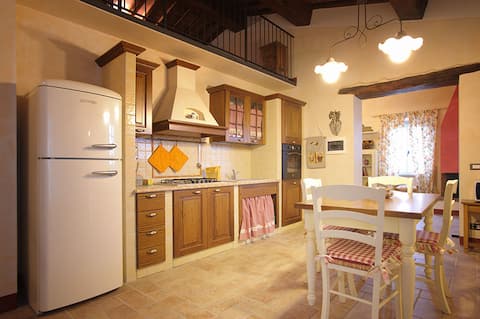
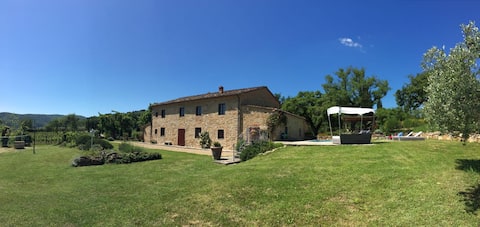
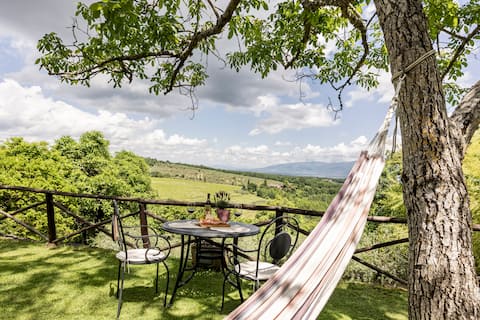
Top Performing Airbnb Properties in Montevarchi (2025)
Benchmark your potential! Explore examples of top-performing Airbnb properties in Montevarchibased on Trailing Twelve Month (TTM) revenue. Analyze their characteristics, revenue, occupancy rate, and ADR to understand what drives success in this market.

Villa Pongina - Tuscany - private pool - air con
Entire Place • 5 bedrooms
Villa Lavinia by Interhome
Entire Place • 5 bedrooms
Nice apartment with terrace and pool in Farmhouse
Entire Place • 3 bedrooms
Panoramic view from stone Apartment- Pool and A/C
Entire Place • 3 bedrooms
Charming converted Hayloft overlooking the Chianti Hills
Entire Place • 2 bedrooms
Tegliaia by Interhome
Entire Place • 3 bedrooms
Note: Performance varies based on location, size, amenities, seasonality, and management quality. Data reflects the past 12 months.
Top Performing Airbnb Hosts in Montevarchi (2025)
Learn from the best! This table showcases top-performing Airbnb hosts in Montevarchi based on the number of properties managed and estimated total revenue over the past year. Analyze their scale and performance metrics.
| Host Name | Properties | Grossing Revenue | Stay Reviews | Avg Rating |
|---|---|---|---|---|
| Società Agricola San Leonardo | 6 | $131,071 | 96 | 4.83/5.0 |
| Elena - Interhome Group | 8 | $67,024 | 5 | 0.60/5.0 |
| Serena | 1 | $63,923 | 43 | 4.91/5.0 |
| Alessandra - Interhome Group | 6 | $55,853 | 14 | 1.84/5.0 |
| Alessandra - Interhome Group | 1 | $51,285 | 5 | 5.00/5.0 |
| Giulia E Massimiliano | 1 | $43,720 | 80 | 4.98/5.0 |
| Leonardo | 1 | $36,861 | 265 | 4.97/5.0 |
| Host #223814216 | 1 | $32,526 | 0 | 0.00/5.0 |
| Sergio | 1 | $32,426 | 13 | 5.00/5.0 |
| Alessandra - Interhome | 2 | $28,320 | 5 | 2.33/5.0 |
Analyzing the strategies of top hosts, such as their property selection, pricing, and guest communication, can offer valuable lessons for optimizing your own Airbnb operations in Montevarchi.
Dive Deeper: Advanced Montevarchi STR Market Data (2025)
Ready to unlock more insights? AirROI provides access to advanced metrics and comprehensive Airbnb data for Montevarchi. Explore detailed analytics beyond this report to refine your investment strategy, optimize pricing, and maximize your vacation rental profits.
Explore Advanced MetricsMontevarchi Short-Term Rental Market Composition (2025): Property & Room Types
Room Type Distribution
Property Type Distribution
Market Composition Insights for Montevarchi
- The Montevarchi Airbnb market composition is heavily skewed towards Entire Home/Apt listings, which make up 92.2% of the 64 active rentals. This indicates strong guest preference for privacy and space.
- Looking at the property type distribution in Montevarchi, Apartment/Condo properties are the most common (54.7%), reflecting the local real estate landscape.
- Houses represent a significant 40.6% portion, catering likely to families or larger groups.
- Smaller segments like hotel/boutique, outdoor/unique (combined 4.7%) offer potential for unique stay experiences.
Montevarchi Airbnb Room Capacity Analysis (2025): Bedroom Distribution
Distribution of Listings by Number of Bedrooms
Room Capacity Insights for Montevarchi
- The dominant room capacity in Montevarchi is 1 bedroom listings, making up 45.3% of the market. This suggests a strong demand for properties suitable for couples or solo travelers.
- Together, 1 bedroom and 2 bedrooms properties represent 70.3% of the active Airbnb listings in Montevarchi, indicating a high concentration in these sizes.
- A significant 24.9% of listings offer 3+ bedrooms, catering to larger groups and families seeking more space in Montevarchi.
Montevarchi Vacation Rental Guest Capacity Trends (2025)
Distribution of Listings by Guest Capacity
Guest Capacity Insights for Montevarchi
- The most common guest capacity trend in Montevarchi vacation rentals is listings accommodating 2 guests (34.4%). This suggests the primary traveler segment is likely couples or solo travelers.
- Properties designed for 2 guests and 4 guests dominate the Montevarchi STR market, accounting for 57.8% of listings.
- 28.1% of properties accommodate 6+ guests, serving the market segment for larger families or group travel in Montevarchi.
- On average, properties in Montevarchi are equipped to host 4.1 guests.
Montevarchi Airbnb Booking Patterns (2025): Available vs. Booked Days
Available Days Distribution
Booked Days Distribution
Booking Pattern Insights for Montevarchi
- The most common availability pattern in Montevarchi falls within the 271-366 days range, representing 62.5% of listings. This suggests many properties have significant open periods on their calendars.
- Approximately 96.9% of listings show high availability (181+ days open annually), indicating potential for increased bookings or specific owner usage patterns.
- For booked days, the 1-30 days range is most frequent in Montevarchi (39.1%), reflecting common guest stay durations or potential owner blocking patterns.
- A notable 3.1% of properties secure long booking periods (181+ days booked per year), highlighting successful long-term rental strategies or significant owner usage.
Montevarchi Airbnb Minimum Stay Requirements Analysis
Distribution of Listings by Minimum Night Requirement
1 Night
28 listings
48.3% of total
2 Nights
5 listings
8.6% of total
3 Nights
10 listings
17.2% of total
4-6 Nights
6 listings
10.3% of total
7-29 Nights
5 listings
8.6% of total
30+ Nights
4 listings
6.9% of total
Key Insights
- The most prevalent minimum stay requirement in Montevarchi is 1 Night, adopted by 48.3% of listings. This highlights the market's preference for shorter, flexible bookings.
Recommendations
- Align with the market by considering a 1 Night minimum stay, as 48.3% of Montevarchi hosts use this setting.
- Explore offering discounts for stays of 30+ nights to attract the 6.9% of the market seeking extended stays.
- Adjust minimum nights based on seasonality – potentially shorter during low season and longer during peak demand periods in Montevarchi.
Montevarchi Airbnb Cancellation Policy Trends Analysis (2025)
Super Strict 30 Days
10 listings
21.3% of total
Super Strict 60 Days
2 listings
4.3% of total
Flexible
15 listings
31.9% of total
Moderate
13 listings
27.7% of total
Strict
7 listings
14.9% of total
Cancellation Policy Insights for Montevarchi
- The prevailing Airbnb cancellation policy trend in Montevarchi is Flexible, used by 31.9% of listings.
- There's a relatively balanced mix between guest-friendly (59.6%) and stricter (14.9%) policies, offering choices for different guest needs.
Recommendations for Hosts
- Consider adopting a Flexible policy to align with the 31.9% market standard in Montevarchi.
- Using a Strict policy might deter some guests, as only 14.9% of listings use it. Evaluate if potential revenue protection outweighs possible lower booking rates.
- Regularly review your cancellation policy against competitors and market demand shifts in Montevarchi.
Montevarchi STR Booking Lead Time Analysis (2025)
Average Booking Lead Time by Month
Booking Lead Time Insights for Montevarchi
- The overall average booking lead time for vacation rentals in Montevarchi is 76 days.
- Guests book furthest in advance for stays during October (average 112 days), likely coinciding with peak travel demand or local events.
- The shortest booking windows occur for stays in February (average 18 days), indicating more last-minute travel plans during this time.
- Seasonally, Summer (89 days avg.) sees the longest lead times, while Winter (30 days avg.) has the shortest, reflecting typical travel planning cycles.
Recommendations for Hosts
- Use the overall average lead time (76 days) as a baseline for your pricing and availability strategy in Montevarchi.
- For October stays, consider implementing length-of-stay discounts or slightly higher rates for bookings made less than 112 days out to capitalize on advance planning.
- Target marketing efforts for the Summer season well in advance (at least 89 days) to capture early planners.
- Monitor your own booking lead times against these Montevarchi averages to identify opportunities for dynamic pricing adjustments.
Popular & Essential Airbnb Amenities in Montevarchi (2025)
Amenity Prevalence
Amenity Insights for Montevarchi
- Essential amenities in Montevarchi that guests expect include: Wifi, Kitchen. Lacking these (any) could significantly impact bookings.
- Popular amenities like Hot water, Hangers, Heating are common but not universal. Offering these can provide a competitive edge.
Recommendations for Hosts
- Ensure your listing includes all essential amenities for Montevarchi: Wifi, Kitchen.
- Prioritize adding missing essentials: Wifi, Kitchen.
- Consider adding popular differentiators like Hot water or Hangers to increase appeal.
- Highlight unique or less common amenities you offer (e.g., hot tub, dedicated workspace, EV charger) in your listing description and photos.
- Regularly check competitor amenities in Montevarchi to stay competitive.
Montevarchi Airbnb Guest Demographics & Profile Analysis (2025)
Guest Profile Summary for Montevarchi
- The typical guest profile for Airbnb in Montevarchi consists of predominantly international visitors (82%), with top international origins including United States, typically belonging to the Post-2000s (Gen Z/Alpha) group (50%), primarily speaking English or Italian.
- Domestic travelers account for 18.1% of guests.
- Key international markets include Italy (18.1%) and United States (16.9%).
- Top languages spoken are English (43.4%) followed by Italian (12.8%).
- A significant demographic segment is the Post-2000s (Gen Z/Alpha) group, representing 50% of guests.
Recommendations for Hosts
- Focus marketing internationally, particularly towards travelers from United States.
- Tailor amenities and listing descriptions to appeal to the dominant Post-2000s (Gen Z/Alpha) demographic (e.g., highlight fast WiFi, smart home features, local guides).
- Highlight unique local experiences or amenities relevant to the primary guest profile.
- Consider seasonal promotions aligned with peak travel times for key origin markets.
Nearby Short-Term Rental Market Comparison
How does the Montevarchi Airbnb market stack up against its neighbors? Compare key performance metrics like average monthly revenue, ADR, and occupancy rates in surrounding areas to understand the broader regional STR landscape.
| Market | Active Properties | Monthly Revenue | Daily Rate | Avg. Occupancy |
|---|---|---|---|---|
| Crespina | 16 | $3,526 | $493.64 | 48% |
| Tignano | 10 | $3,391 | $500.31 | 36% |
| Luni Mare | 11 | $3,102 | $169.59 | 40% |
| Buonconvento | 59 | $3,068 | $456.70 | 46% |
| Castelfranco di Sotto | 47 | $2,881 | $294.54 | 38% |
| Collazzone | 28 | $2,839 | $341.11 | 36% |
| Florence | 9,598 | $2,833 | $208.48 | 52% |
| Marcialla | 25 | $2,788 | $236.61 | 54% |
| Parrano | 18 | $2,762 | $329.95 | 34% |
| Impruneta | 131 | $2,761 | $237.93 | 45% |