Montepulciano Airbnb Market Analysis 2025: Short Term Rental Data & Vacation Rental Statistics in Tuscany, Italy
Is Airbnb profitable in Montepulciano in 2025? Explore comprehensive Airbnb analytics for Montepulciano, Tuscany, Italy to uncover income potential. This 2025 STR market report for Montepulciano, based on AirROI data from April 2024 to March 2025, reveals key trends in the market of 518 active listings.
Whether you're considering an Airbnb investment in Montepulciano, optimizing your existing vacation rental, or exploring rental arbitrage opportunities, understanding the Montepulciano Airbnb data is crucial. Navigating the high regulation landscape is key to maximizing your short term rental income potential. Let's dive into the specifics.
Key Montepulciano Airbnb Performance Metrics Overview
Monthly Airbnb Revenue Variations & Income Potential in Montepulciano (2025)
Understanding the monthly revenue variations for Airbnb listings in Montepulciano is key to maximizing your short term rental income potential. Seasonality significantly impacts earnings. Our analysis, based on data from the past 12 months, shows that the peak revenue month for STRs in Montepulciano is typically July, while February often presents the lowest earnings, highlighting opportunities for strategic pricing adjustments during shoulder and low seasons. Explore the typical Airbnb income in Montepulciano across different performance tiers:
- Best-in-class properties (Top 10%) achieve $5,724+ monthly, often utilizing dynamic pricing and superior guest experiences.
- Strong performing properties (Top 25%) earn $3,049 or more, indicating effective management and desirable locations/amenities.
- Typical properties (Median) generate around $1,773 per month, representing the average market performance.
- Entry-level properties (Bottom 25%) see earnings around $835, often with potential for optimization.
Average Monthly Airbnb Earnings Trend in Montepulciano
Montepulciano Airbnb Occupancy Rate Trends (2025)
Maximize your bookings by understanding the Montepulciano STR occupancy trends. Seasonal demand shifts significantly influence how often properties are booked. Typically, Augustsees the highest demand (peak season occupancy), while January experiences the lowest (low season). Effective strategies, like adjusting minimum stays or offering promotions, can boost occupancy during slower periods. Here's how different property tiers perform in Montepulciano:
- Best-in-class properties (Top 10%) achieve 72%+ occupancy, indicating high desirability and potentially optimized availability.
- Strong performing properties (Top 25%) maintain 57% or higher occupancy, suggesting good market fit and guest satisfaction.
- Typical properties (Median) have an occupancy rate around 35%.
- Entry-level properties (Bottom 25%) average 16% occupancy, potentially facing higher vacancy.
Average Monthly Occupancy Rate Trend in Montepulciano
Average Daily Rate (ADR) Airbnb Trends in Montepulciano (2025)
Effective short term rental pricing strategy in Montepulciano involves understanding monthly ADR fluctuations. The Average Daily Rate (ADR) for Airbnb in Montepulciano typically peaks in August and dips lowest during February. Leveraging Airbnb dynamic pricing tools or strategies based on this seasonality can significantly boost revenue. Here's a look at the typical nightly rates achieved:
- Best-in-class properties (Top 10%) command rates of $542+ per night, often due to premium features or locations.
- Strong performing properties (Top 25%) achieve nightly rates of $237 or more.
- Typical properties (Median) charge around $150 per night.
- Entry-level properties (Bottom 25%) earn around $106 per night.
Average Daily Rate (ADR) Trend by Month in Montepulciano
Get Live Montepulciano Market Intelligence 👇

Explore Real-time Analytics
Airbnb Seasonality Analysis & Trends in Montepulciano (2025)
Peak Season (July, May, August)
- Revenue averages $4,294 per month
- Occupancy rates average 51.7%
- Daily rates average $273
Shoulder Season
- Revenue averages $3,065 per month
- Occupancy maintains around 39.6%
- Daily rates hold near $261
Low Season (January, February, March)
- Revenue drops to average $1,260 per month
- Occupancy decreases to average 21.4%
- Daily rates adjust to average $247
Seasonality Insights for Montepulciano
- The Airbnb seasonality in Montepulciano shows highly seasonal trends requiring careful strategy. While the sections above show seasonal averages, it's also insightful to look at the extremes:
- During the high season, the absolute peak month showcases Montepulciano's highest earning potential, with monthly revenues capable of climbing to $4,352, occupancy reaching a high of 54.6%, and ADRs peaking at $277.
- Conversely, the slowest single month of the year, typically falling within the low season, marks the market's lowest point. In this month, revenue might dip to $969, occupancy could drop to 18.7%, and ADRs may adjust down to $245.
- Understanding both the seasonal averages and these monthly peaks and troughs in revenue, occupancy, and ADR is crucial for maximizing your Airbnb profit potential in Montepulciano.
Seasonal Strategies for Maximizing Profit
- Peak Season: Maximize revenue through premium pricing and potentially longer minimum stays. Ensure high availability.
- Low Season: Offer competitive pricing, special promotions (e.g., extended stay discounts), and flexible cancellation policies. Target off-season travelers like remote workers or budget-conscious guests.
- Shoulder Seasons: Implement dynamic pricing that balances peak and low rates. Target weekend travelers or specific events. Offer slightly more flexible terms than peak season.
- Regularly analyze your own performance against these Montepulciano seasonality benchmarks and adjust your pricing and availability strategy accordingly.
Best Areas for Airbnb Investment in Montepulciano (2025)
Exploring the top neighborhoods for short-term rentals in Montepulciano? This section highlights key areas, outlining why they are attractive for hosts and guests, along with notable local attractions. Consider these locations based on your target guest profile and investment strategy.
| Neighborhood / Area | Why Host Here? (Target Guests & Appeal) | Key Attractions & Landmarks |
|---|---|---|
| Centro Storico | The historic center of Montepulciano offers a charming atmosphere with its medieval architecture and vibrant piazzas. Ideal for tourists who want to immerse themselves in the town's rich history and culture. | Piazza Grande, San Biagio Church, Fortezza Medicea, Palazzo Comunale, Wine cellars, Nobile di Montepulciano wine tours |
| Via di S. Agnese | This picturesque street features beautiful views of the Tuscan countryside and is close to many wine estates. It appeals to guests looking for a peaceful retreat with easy access to vineyards. | Tuscan vineyards, Panoramic viewpoints, Local trattorias, Wine tasting experiences, Walking trails |
| Parco di Villa Simoneschi | A scenic park area that provides a relaxing environment for visitors. It's great for families and those wanting to escape the hustle and bustle, while still being close to the city center. | Villa Simoneschi, Green park areas, Picnic spots, Walking paths, Playgrounds |
| Montepulciano Vineyards | This area is famous for its wine production and attracts wine enthusiasts. It offers opportunities for vineyard stays and unique experiences related to wine making. | Nobile di Montepulciano vineyards, Wine tasting tours, Vineyard picnics, Wine festivals |
| Via dell'Opio nel Corso | A quaint street filled with shops and cafes, perfect for those who want to experience local life. It's a good spot for short-term rentals due to foot traffic and tourist interest. | Local artisan shops, Cafes, Restaurant dining, Cultural events |
| Piazza delle Erbe | This bustling market square offers a vibrant atmosphere with local vendors selling crafts and foods. It's a popular place for tourists and locals alike. | Market stalls, Local restaurants, Cultural performances, Nearby historical sites |
| Siena Road (Via di Siena) | The road leading to Montepulciano offers scenic drives and access to nearby sites. Ideal for tourists looking to explore surrounding areas. | Stunning countryside views, Access to nearby towns, Scenic drives |
| Local Festivals Area | Particularly lively during the harvest and wine festival seasons, this area attracts tourists interested in experiencing traditional Tuscan culture and festivities. | Bravio delle Botti, Wine festivals, Cultural events, Local culinary experiences |
Understanding Airbnb License Requirements & STR Laws in Montepulciano (2025)
Yes, Montepulciano, Tuscany, Italy enforces high STR regulations. Obtaining a license and ensuring compliance is almost certainly required according to current 2025 STR laws. Always verify the latest short term rental regulations and Airbnb license requirements directly with local government authorities for Montepulciano to ensure full compliance before hosting.
(Source: AirROI data, 2025, based on 72% licensed listings)
Top Performing Airbnb Properties in Montepulciano (2025)
Benchmark your potential! Explore examples of top-performing Airbnb properties in Montepulcianobased on Trailing Twelve Month (TTM) revenue. Analyze their characteristics, revenue, occupancy rate, and ADR to understand what drives success in this market.
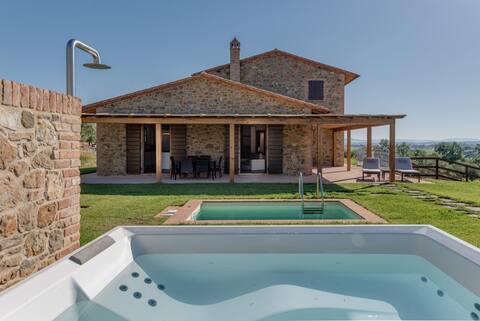
Villa Nobile - Private Jacuzzi
Entire Place • 4 bedrooms
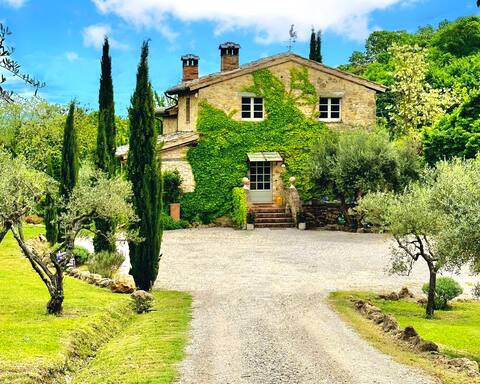
Luxury Serviced Family Villa - Pool/Hot Tub *A/C*
Entire Place • 6 bedrooms
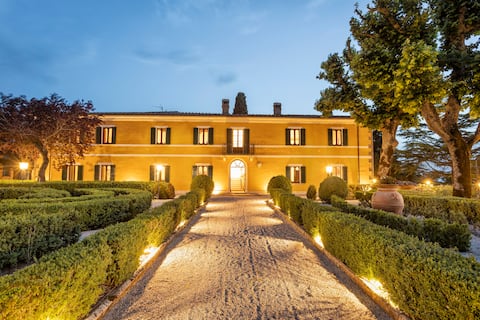
![[Luxury Villa] Poggio alla Famina](https://a0.muscache.com/im/pictures/miso/Hosting-912695317751421925/original/37abd869-b6b9-4382-9516-bace29ce00c3.jpeg?im_w=480&im_format=avif)
[Luxury Villa] Poggio alla Famina
Entire Place • 6 bedrooms
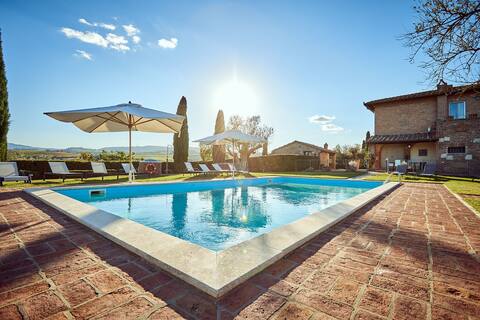
villa pianoia charming house
Entire Place • 7 bedrooms
Tenuta Golo | Tuscan Escape | Pool | Winery
Entire Place • 6 bedrooms
Terra Antica Suite & Ville - Montepulciano
Entire Place • 2 bedrooms
Note: Performance varies based on location, size, amenities, seasonality, and management quality. Data reflects the past 12 months.
Top Performing Airbnb Hosts in Montepulciano (2025)
Learn from the best! This table showcases top-performing Airbnb hosts in Montepulciano based on the number of properties managed and estimated total revenue over the past year. Analyze their scale and performance metrics.
| Host Name | Properties | Grossing Revenue | Stay Reviews | Avg Rating |
|---|---|---|---|---|
| Mario | 10 | $1,306,198 | 231 | 3.99/5.0 |
| Emma | 6 | $594,034 | 41 | 4.86/5.0 |
| Liliana | 5 | $307,122 | 412 | 4.86/5.0 |
| Charles | 1 | $288,077 | 19 | 5.00/5.0 |
| Tripcare | 1 | $278,302 | 16 | 4.94/5.0 |
| Arcangelo | 1 | $266,613 | 7 | 5.00/5.0 |
| Team Tenuta Golo | 1 | $257,018 | 89 | 4.93/5.0 |
| Raffaele | 6 | $241,752 | 51 | 3.32/5.0 |
| Alex | 6 | $239,787 | 260 | 4.96/5.0 |
| Luca | 8 | $207,286 | 607 | 4.76/5.0 |
Analyzing the strategies of top hosts, such as their property selection, pricing, and guest communication, can offer valuable lessons for optimizing your own Airbnb operations in Montepulciano.
Dive Deeper: Advanced Montepulciano STR Market Data (2025)
Ready to unlock more insights? AirROI provides access to advanced metrics and comprehensive Airbnb data for Montepulciano. Explore detailed analytics beyond this report to refine your investment strategy, optimize pricing, and maximize your vacation rental profits.
Explore Advanced MetricsMontepulciano Short-Term Rental Market Composition (2025): Property & Room Types
Room Type Distribution
Property Type Distribution
Market Composition Insights for Montepulciano
- The Montepulciano Airbnb market composition is heavily skewed towards Entire Home/Apt listings, which make up 79.5% of the 518 active rentals. This indicates strong guest preference for privacy and space.
- Looking at the property type distribution in Montepulciano, Apartment/Condo properties are the most common (50.6%), reflecting the local real estate landscape.
- Houses represent a significant 28.4% portion, catering likely to families or larger groups.
- The presence of 8.5% Hotel/Boutique listings indicates integration with traditional hospitality.
- Smaller segments like others (combined 1.9%) offer potential for unique stay experiences.
Montepulciano Airbnb Room Capacity Analysis (2025): Bedroom Distribution
Distribution of Listings by Number of Bedrooms
Room Capacity Insights for Montepulciano
- The dominant room capacity in Montepulciano is 1 bedroom listings, making up 42.7% of the market. This suggests a strong demand for properties suitable for couples or solo travelers.
- Together, 1 bedroom and 2 bedrooms properties represent 73.0% of the active Airbnb listings in Montepulciano, indicating a high concentration in these sizes.
Montepulciano Vacation Rental Guest Capacity Trends (2025)
Distribution of Listings by Guest Capacity
Guest Capacity Insights for Montepulciano
- The most common guest capacity trend in Montepulciano vacation rentals is listings accommodating 4 guests (29%). This suggests the primary traveler segment is likely small families or groups.
- Properties designed for 4 guests and 2 guests dominate the Montepulciano STR market, accounting for 55.8% of listings.
- 20.3% of properties accommodate 6+ guests, serving the market segment for larger families or group travel in Montepulciano.
- On average, properties in Montepulciano are equipped to host 3.6 guests.
Montepulciano Airbnb Booking Patterns (2025): Available vs. Booked Days
Available Days Distribution
Booked Days Distribution
Booking Pattern Insights for Montepulciano
- The most common availability pattern in Montepulciano falls within the 271-366 days range, representing 50.2% of listings. This suggests many properties have significant open periods on their calendars.
- Approximately 79.7% of listings show high availability (181+ days open annually), indicating potential for increased bookings or specific owner usage patterns.
- For booked days, the 91-180 days range is most frequent in Montepulciano (29.3%), reflecting common guest stay durations or potential owner blocking patterns.
- A notable 21.8% of properties secure long booking periods (181+ days booked per year), highlighting successful long-term rental strategies or significant owner usage.
Montepulciano Airbnb Minimum Stay Requirements Analysis
Distribution of Listings by Minimum Night Requirement
1 Night
111 listings
23% of total
2 Nights
151 listings
31.3% of total
3 Nights
71 listings
14.7% of total
4-6 Nights
35 listings
7.2% of total
7-29 Nights
33 listings
6.8% of total
30+ Nights
82 listings
17% of total
Key Insights
- The most prevalent minimum stay requirement in Montepulciano is 2 Nights, adopted by 31.3% of listings. This highlights the market's preference for shorter, flexible bookings.
- A significant segment (17%) caters to monthly stays (30+ nights) in Montepulciano, pointing to opportunities in the extended-stay market.
Recommendations
- Align with the market by considering a 2 Nights minimum stay, as 31.3% of Montepulciano hosts use this setting.
- If feasible, allowing 1-night stays, especially midweek or during low season, could capture last-minute bookings, as only 23% currently do.
- Explore offering discounts for stays of 30+ nights to attract the 17% of the market seeking extended stays.
- Adjust minimum nights based on seasonality – potentially shorter during low season and longer during peak demand periods in Montepulciano.
Montepulciano Airbnb Cancellation Policy Trends Analysis (2025)
Super Strict 95 Days
1 listings
0.2% of total
Super Strict 30 Days
24 listings
5.4% of total
Super Strict 60 Days
21 listings
4.7% of total
Flexible
147 listings
33.1% of total
Moderate
178 listings
40.1% of total
Strict
73 listings
16.4% of total
Cancellation Policy Insights for Montepulciano
- The prevailing Airbnb cancellation policy trend in Montepulciano is Moderate, used by 40.1% of listings.
- The market strongly favors guest-friendly terms, with 73.2% of listings offering Flexible or Moderate policies. This suggests guests in Montepulciano may expect booking flexibility.
Recommendations for Hosts
- Consider adopting a Moderate policy to align with the 40.1% market standard in Montepulciano.
- Regularly review your cancellation policy against competitors and market demand shifts in Montepulciano.
Montepulciano STR Booking Lead Time Analysis (2025)
Average Booking Lead Time by Month
Booking Lead Time Insights for Montepulciano
- The overall average booking lead time for vacation rentals in Montepulciano is 70 days.
- Guests book furthest in advance for stays during June (average 106 days), likely coinciding with peak travel demand or local events.
- The shortest booking windows occur for stays in February (average 39 days), indicating more last-minute travel plans during this time.
- Seasonally, Summer (97 days avg.) sees the longest lead times, while Winter (46 days avg.) has the shortest, reflecting typical travel planning cycles.
Recommendations for Hosts
- Use the overall average lead time (70 days) as a baseline for your pricing and availability strategy in Montepulciano.
- For June stays, consider implementing length-of-stay discounts or slightly higher rates for bookings made less than 106 days out to capitalize on advance planning.
- Target marketing efforts for the Summer season well in advance (at least 97 days) to capture early planners.
- Monitor your own booking lead times against these Montepulciano averages to identify opportunities for dynamic pricing adjustments.
Popular & Essential Airbnb Amenities in Montepulciano (2025)
Amenity Prevalence
Amenity Insights for Montepulciano
- Essential amenities in Montepulciano that guests expect include: Wifi, Heating. Lacking these (any) could significantly impact bookings.
- Popular amenities like Essentials, Hair dryer, Hot water are common but not universal. Offering these can provide a competitive edge.
Recommendations for Hosts
- Ensure your listing includes all essential amenities for Montepulciano: Wifi, Heating.
- Prioritize adding missing essentials: Wifi, Heating.
- Consider adding popular differentiators like Essentials or Hair dryer to increase appeal.
- Highlight unique or less common amenities you offer (e.g., hot tub, dedicated workspace, EV charger) in your listing description and photos.
- Regularly check competitor amenities in Montepulciano to stay competitive.
Montepulciano Airbnb Guest Demographics & Profile Analysis (2025)
Guest Profile Summary for Montepulciano
- The typical guest profile for Airbnb in Montepulciano consists of predominantly international visitors (91%), with top international origins including Italy, typically belonging to the Post-2000s (Gen Z/Alpha) group (50%), primarily speaking English or Spanish.
- Domestic travelers account for 9.5% of guests.
- Key international markets include United States (38.2%) and Italy (9.5%).
- Top languages spoken are English (51.3%) followed by Spanish (9.3%).
- A significant demographic segment is the Post-2000s (Gen Z/Alpha) group, representing 50% of guests.
Recommendations for Hosts
- Focus marketing internationally, particularly towards travelers from Italy.
- Tailor amenities and listing descriptions to appeal to the dominant Post-2000s (Gen Z/Alpha) demographic (e.g., highlight fast WiFi, smart home features, local guides).
- Highlight unique local experiences or amenities relevant to the primary guest profile.
- Consider seasonal promotions aligned with peak travel times for key origin markets.
Nearby Short-Term Rental Market Comparison
How does the Montepulciano Airbnb market stack up against its neighbors? Compare key performance metrics like average monthly revenue, ADR, and occupancy rates in surrounding areas to understand the broader regional STR landscape.
| Market | Active Properties | Monthly Revenue | Daily Rate | Avg. Occupancy |
|---|---|---|---|---|
| Crespina | 16 | $3,526 | $493.64 | 48% |
| Tignano | 10 | $3,391 | $500.31 | 36% |
| Luni Mare | 11 | $3,102 | $169.59 | 40% |
| Buonconvento | 59 | $3,068 | $456.70 | 46% |
| Castelfranco di Sotto | 47 | $2,881 | $294.54 | 38% |
| Collazzone | 28 | $2,839 | $341.11 | 36% |
| Florence | 9,598 | $2,833 | $208.48 | 52% |
| Marcialla | 25 | $2,788 | $236.61 | 54% |
| Parrano | 18 | $2,762 | $329.95 | 34% |
| Impruneta | 131 | $2,761 | $237.93 | 45% |