Montalcino Airbnb Market Analysis 2025: Short Term Rental Data & Vacation Rental Statistics in Tuscany, Italy
Is Airbnb profitable in Montalcino in 2025? Explore comprehensive Airbnb analytics for Montalcino, Tuscany, Italy to uncover income potential. This 2025 STR market report for Montalcino, based on AirROI data from April 2024 to March 2025, reveals key trends in the niche market of 200 active listings.
Whether you're considering an Airbnb investment in Montalcino, optimizing your existing vacation rental, or exploring rental arbitrage opportunities, understanding the Montalcino Airbnb data is crucial. Navigating the high regulation landscape is key to maximizing your short term rental income potential. Let's dive into the specifics.
Key Montalcino Airbnb Performance Metrics Overview
Monthly Airbnb Revenue Variations & Income Potential in Montalcino (2025)
Understanding the monthly revenue variations for Airbnb listings in Montalcino is key to maximizing your short term rental income potential. Seasonality significantly impacts earnings. Our analysis, based on data from the past 12 months, shows that the peak revenue month for STRs in Montalcino is typically May, while February often presents the lowest earnings, highlighting opportunities for strategic pricing adjustments during shoulder and low seasons. Explore the typical Airbnb income in Montalcino across different performance tiers:
- Best-in-class properties (Top 10%) achieve $7,578+ monthly, often utilizing dynamic pricing and superior guest experiences.
- Strong performing properties (Top 25%) earn $3,458 or more, indicating effective management and desirable locations/amenities.
- Typical properties (Median) generate around $1,753 per month, representing the average market performance.
- Entry-level properties (Bottom 25%) see earnings around $790, often with potential for optimization.
Average Monthly Airbnb Earnings Trend in Montalcino
Montalcino Airbnb Occupancy Rate Trends (2025)
Maximize your bookings by understanding the Montalcino STR occupancy trends. Seasonal demand shifts significantly influence how often properties are booked. Typically, Augustsees the highest demand (peak season occupancy), while February experiences the lowest (low season). Effective strategies, like adjusting minimum stays or offering promotions, can boost occupancy during slower periods. Here's how different property tiers perform in Montalcino:
- Best-in-class properties (Top 10%) achieve 71%+ occupancy, indicating high desirability and potentially optimized availability.
- Strong performing properties (Top 25%) maintain 54% or higher occupancy, suggesting good market fit and guest satisfaction.
- Typical properties (Median) have an occupancy rate around 30%.
- Entry-level properties (Bottom 25%) average 13% occupancy, potentially facing higher vacancy.
Average Monthly Occupancy Rate Trend in Montalcino
Average Daily Rate (ADR) Airbnb Trends in Montalcino (2025)
Effective short term rental pricing strategy in Montalcino involves understanding monthly ADR fluctuations. The Average Daily Rate (ADR) for Airbnb in Montalcino typically peaks in August and dips lowest during February. Leveraging Airbnb dynamic pricing tools or strategies based on this seasonality can significantly boost revenue. Here's a look at the typical nightly rates achieved:
- Best-in-class properties (Top 10%) command rates of $671+ per night, often due to premium features or locations.
- Strong performing properties (Top 25%) achieve nightly rates of $361 or more.
- Typical properties (Median) charge around $183 per night.
- Entry-level properties (Bottom 25%) earn around $111 per night.
Average Daily Rate (ADR) Trend by Month in Montalcino
Get Live Montalcino Market Intelligence 👇

Explore Real-time Analytics
Airbnb Seasonality Analysis & Trends in Montalcino (2025)
Peak Season (May, June, July)
- Revenue averages $5,206 per month
- Occupancy rates average 41.8%
- Daily rates average $398
Shoulder Season
- Revenue averages $3,433 per month
- Occupancy maintains around 38.1%
- Daily rates hold near $356
Low Season (January, February, March)
- Revenue drops to average $1,330 per month
- Occupancy decreases to average 21.2%
- Daily rates adjust to average $273
Seasonality Insights for Montalcino
- The Airbnb seasonality in Montalcino shows highly seasonal trends requiring careful strategy. While the sections above show seasonal averages, it's also insightful to look at the extremes:
- During the high season, the absolute peak month showcases Montalcino's highest earning potential, with monthly revenues capable of climbing to $5,425, occupancy reaching a high of 50.0%, and ADRs peaking at $403.
- Conversely, the slowest single month of the year, typically falling within the low season, marks the market's lowest point. In this month, revenue might dip to $994, occupancy could drop to 18.9%, and ADRs may adjust down to $271.
- Understanding both the seasonal averages and these monthly peaks and troughs in revenue, occupancy, and ADR is crucial for maximizing your Airbnb profit potential in Montalcino.
Seasonal Strategies for Maximizing Profit
- Peak Season: Maximize revenue through premium pricing and potentially longer minimum stays. Ensure high availability.
- Low Season: Offer competitive pricing, special promotions (e.g., extended stay discounts), and flexible cancellation policies. Target off-season travelers like remote workers or budget-conscious guests.
- Shoulder Seasons: Implement dynamic pricing that balances peak and low rates. Target weekend travelers or specific events. Offer slightly more flexible terms than peak season.
- Regularly analyze your own performance against these Montalcino seasonality benchmarks and adjust your pricing and availability strategy accordingly.
Best Areas for Airbnb Investment in Montalcino (2025)
Exploring the top neighborhoods for short-term rentals in Montalcino? This section highlights key areas, outlining why they are attractive for hosts and guests, along with notable local attractions. Consider these locations based on your target guest profile and investment strategy.
| Neighborhood / Area | Why Host Here? (Target Guests & Appeal) | Key Attractions & Landmarks |
|---|---|---|
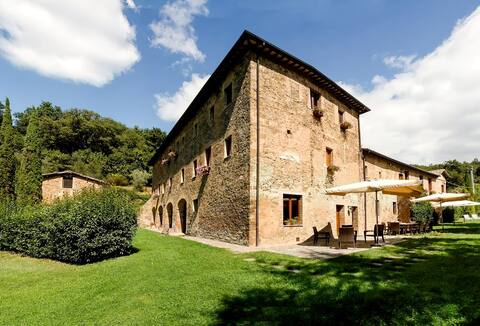
| Historic Center | The heart of Montalcino, filled with medieval architecture and rich history. A prime spot for tourists wanting to experience local culture, wine, and food. | Piazza del Popolo, Fortress of Montalcino, Abbey of Sant'Antimo, Wine cellars, Local trattorias |
| Brunello Wine Region | Famous for producing Brunello di Montalcino, this area attracts wine enthusiasts and tourists looking to explore vineyards and wine tastings. | Wine Estates, Vineyard tours, Brunello tastings, Beautiful landscapes, Winery restaurants |
| Val d'Orcia | A UNESCO World Heritage site, this picturesque valley is perfect for nature lovers and those seeking stunning Tuscan scenery. It's popular for photography and outdoor activities. | Pienza, San Quirico d'Orcia, Bagno Vignoni, Rolling hills, Hiking trails |
| Local Markets | Montalcino's markets are a great way to engage with locals and experience authentic Tuscan life. Ideal for tourists looking to immerse themselves in the culture. | Weekly market days, Local produce, Handmade goods, Crafts, Street food |
| Olive Oil Trails | This region is also known for its quality olive oil, drawing visitors interested in culinary experiences and tasting tours. | Olive oil farms, Tasting tours, Culinary classes, Regional cooking, Olive oil festivals |
| Cultural Events | Montalcino hosts various festivals and cultural events throughout the year, making it appealing for tourists looking for experiences beyond sightseeing. | Brunello Wine Festival, Palio di Siena nearby, Art exhibitions, Music festivals, Historical reenactments |
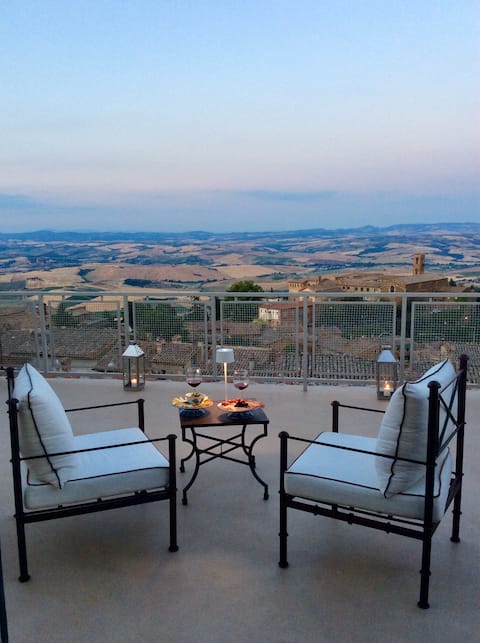
| Scenic Overlooks | Montalcino is surrounded by beautiful hills and offers multiple viewpoints that are perfect for those looking to enjoy the stunning Tuscan landscape. | Belvedere viewpoints, Photography spots, Picnic areas, Hiking paths, Wine-oriented views |
| Cooking Classes | Culinary tourism is on the rise, and Montalcino offers many opportunities for tourists to learn how to cook traditional Tuscan dishes, enhancing their travel experience. | Hands-on cooking classes, Local chefs, Market tours, Tuscany cuisine, Wine pairing classes |
Understanding Airbnb License Requirements & STR Laws in Montalcino (2025)
Yes, Montalcino, Tuscany, Italy enforces high STR regulations. Obtaining a license and ensuring compliance is almost certainly required according to current 2025 STR laws. Always verify the latest short term rental regulations and Airbnb license requirements directly with local government authorities for Montalcino to ensure full compliance before hosting.
(Source: AirROI data, 2025, based on 65% licensed listings)
Top Performing Airbnb Properties in Montalcino (2025)
Benchmark your potential! Explore examples of top-performing Airbnb properties in Montalcinobased on Trailing Twelve Month (TTM) revenue. Analyze their characteristics, revenue, occupancy rate, and ADR to understand what drives success in this market.
Antico Convento I Cappuccini - Villa for 26
Entire Place • 15 bedrooms
La Fornace, A spectacular villa in Tuscany
Entire Place • 6 bedrooms
Domus Antiqua
Entire Place • 3 bedrooms

Breathtaking Views from a Tuscan Villa
Entire Place • 4 bedrooms

Pasqui Villas :Historic mansion La Consuma
Entire Place • 8 bedrooms

Luxurious Padronale Villa with private pool
Entire Place • 6 bedrooms
Note: Performance varies based on location, size, amenities, seasonality, and management quality. Data reflects the past 12 months.
Top Performing Airbnb Hosts in Montalcino (2025)
Learn from the best! This table showcases top-performing Airbnb hosts in Montalcino based on the number of properties managed and estimated total revenue over the past year. Analyze their scale and performance metrics.
| Host Name | Properties | Grossing Revenue | Stay Reviews | Avg Rating |
|---|---|---|---|---|
| Società Agricola I Cappuccini | 1 | $368,212 | 48 | 4.96/5.0 |
| Federica | 4 | $308,157 | 123 | 5.00/5.0 |
| Jo | 1 | $297,414 | 50 | 4.98/5.0 |
| Mario | 8 | $272,593 | 106 | 4.32/5.0 |
| Filippo | 6 | $226,980 | 135 | 4.80/5.0 |
| Vittorio | 3 | $187,850 | 150 | 4.97/5.0 |
| Francesco | 5 | $157,659 | 841 | 4.89/5.0 |
| Erna | 3 | $154,010 | 113 | 3.33/5.0 |
| Mario | 4 | $143,878 | 99 | 4.43/5.0 |
| Stefano | 1 | $137,414 | 50 | 5.00/5.0 |
Analyzing the strategies of top hosts, such as their property selection, pricing, and guest communication, can offer valuable lessons for optimizing your own Airbnb operations in Montalcino.
Dive Deeper: Advanced Montalcino STR Market Data (2025)
Ready to unlock more insights? AirROI provides access to advanced metrics and comprehensive Airbnb data for Montalcino. Explore detailed analytics beyond this report to refine your investment strategy, optimize pricing, and maximize your vacation rental profits.
Explore Advanced MetricsMontalcino Short-Term Rental Market Composition (2025): Property & Room Types
Room Type Distribution
Property Type Distribution
Market Composition Insights for Montalcino
- The Montalcino Airbnb market composition is heavily skewed towards Entire Home/Apt listings, which make up 80.5% of the 200 active rentals. This indicates strong guest preference for privacy and space.
- Looking at the property type distribution in Montalcino, Apartment/Condo properties are the most common (47.5%), reflecting the local real estate landscape.
- Houses represent a significant 34% portion, catering likely to families or larger groups.
- Smaller segments like unique stays (combined 2.5%) offer potential for unique stay experiences.
Montalcino Airbnb Room Capacity Analysis (2025): Bedroom Distribution
Distribution of Listings by Number of Bedrooms
Room Capacity Insights for Montalcino
- The dominant room capacity in Montalcino is 2 bedrooms listings, making up 31.5% of the market. This suggests a strong demand for properties suitable for couples or solo travelers.
- Together, 2 bedrooms and 1 bedroom properties represent 62.5% of the active Airbnb listings in Montalcino, indicating a high concentration in these sizes.
- A significant 27.0% of listings offer 3+ bedrooms, catering to larger groups and families seeking more space in Montalcino.
Montalcino Vacation Rental Guest Capacity Trends (2025)
Distribution of Listings by Guest Capacity
Guest Capacity Insights for Montalcino
- The most common guest capacity trend in Montalcino vacation rentals is listings accommodating 4 guests (26.5%). This suggests the primary traveler segment is likely small families or groups.
- Properties designed for 4 guests and 2 guests dominate the Montalcino STR market, accounting for 42.0% of listings.
- 29.0% of properties accommodate 6+ guests, serving the market segment for larger families or group travel in Montalcino.
- On average, properties in Montalcino are equipped to host 4.1 guests.
Montalcino Airbnb Booking Patterns (2025): Available vs. Booked Days
Available Days Distribution
Booked Days Distribution
Booking Pattern Insights for Montalcino
- The most common availability pattern in Montalcino falls within the 271-366 days range, representing 51% of listings. This suggests many properties have significant open periods on their calendars.
- Approximately 84.0% of listings show high availability (181+ days open annually), indicating potential for increased bookings or specific owner usage patterns.
- For booked days, the 91-180 days range is most frequent in Montalcino (33.5%), reflecting common guest stay durations or potential owner blocking patterns.
- A notable 17.0% of properties secure long booking periods (181+ days booked per year), highlighting successful long-term rental strategies or significant owner usage.
Montalcino Airbnb Minimum Stay Requirements Analysis
Distribution of Listings by Minimum Night Requirement
1 Night
48 listings
26.1% of total
2 Nights
49 listings
26.6% of total
3 Nights
16 listings
8.7% of total
4-6 Nights
27 listings
14.7% of total
7-29 Nights
23 listings
12.5% of total
30+ Nights
21 listings
11.4% of total
Key Insights
- The most prevalent minimum stay requirement in Montalcino is 2 Nights, adopted by 26.6% of listings. This highlights the market's preference for shorter, flexible bookings.
- A significant segment (11.4%) caters to monthly stays (30+ nights) in Montalcino, pointing to opportunities in the extended-stay market.
Recommendations
- Align with the market by considering a 2 Nights minimum stay, as 26.6% of Montalcino hosts use this setting.
- If feasible, allowing 1-night stays, especially midweek or during low season, could capture last-minute bookings, as only 26.1% currently do.
- Explore offering discounts for stays of 30+ nights to attract the 11.4% of the market seeking extended stays.
- Adjust minimum nights based on seasonality – potentially shorter during low season and longer during peak demand periods in Montalcino.
Montalcino Airbnb Cancellation Policy Trends Analysis (2025)
Super Strict 30 Days
3 listings
1.7% of total
Super Strict 60 Days
7 listings
4% of total
Flexible
61 listings
35.3% of total
Moderate
61 listings
35.3% of total
Strict
41 listings
23.7% of total
Cancellation Policy Insights for Montalcino
- The prevailing Airbnb cancellation policy trend in Montalcino is Flexible, used by 35.3% of listings.
- The market strongly favors guest-friendly terms, with 70.6% of listings offering Flexible or Moderate policies. This suggests guests in Montalcino may expect booking flexibility.
Recommendations for Hosts
- Consider adopting a Flexible policy to align with the 35.3% market standard in Montalcino.
- Regularly review your cancellation policy against competitors and market demand shifts in Montalcino.
Montalcino STR Booking Lead Time Analysis (2025)
Average Booking Lead Time by Month
Booking Lead Time Insights for Montalcino
- The overall average booking lead time for vacation rentals in Montalcino is 79 days.
- Guests book furthest in advance for stays during May (average 119 days), likely coinciding with peak travel demand or local events.
- The shortest booking windows occur for stays in March (average 53 days), indicating more last-minute travel plans during this time.
- Seasonally, Summer (98 days avg.) sees the longest lead times, while Winter (58 days avg.) has the shortest, reflecting typical travel planning cycles.
Recommendations for Hosts
- Use the overall average lead time (79 days) as a baseline for your pricing and availability strategy in Montalcino.
- For May stays, consider implementing length-of-stay discounts or slightly higher rates for bookings made less than 119 days out to capitalize on advance planning.
- Target marketing efforts for the Summer season well in advance (at least 98 days) to capture early planners.
- Monitor your own booking lead times against these Montalcino averages to identify opportunities for dynamic pricing adjustments.
Popular & Essential Airbnb Amenities in Montalcino (2025)
Amenity Prevalence
Amenity Insights for Montalcino
- Essential amenities in Montalcino that guests expect include: Heating, Essentials. Lacking these (any) could significantly impact bookings.
- Popular amenities like Wifi, Kitchen, Hair dryer are common but not universal. Offering these can provide a competitive edge.
- Warning: Wifi is not universally provided but is considered essential globally. Ensure reliable Wifi is offered.
Recommendations for Hosts
- Ensure your listing includes all essential amenities for Montalcino: Heating, Essentials.
- Prioritize adding missing essentials: Heating, Essentials.
- Consider adding popular differentiators like Wifi or Kitchen to increase appeal.
- Highlight unique or less common amenities you offer (e.g., hot tub, dedicated workspace, EV charger) in your listing description and photos.
- Regularly check competitor amenities in Montalcino to stay competitive.
Montalcino Airbnb Guest Demographics & Profile Analysis (2025)
Guest Profile Summary for Montalcino
- The typical guest profile for Airbnb in Montalcino consists of predominantly international visitors (85%), with top international origins including Italy, typically belonging to the Post-2000s (Gen Z/Alpha) group (50%), primarily speaking English or Italian.
- Domestic travelers account for 15.0% of guests.
- Key international markets include United States (29.5%) and Italy (15%).
- Top languages spoken are English (46.2%) followed by Italian (12.2%).
- A significant demographic segment is the Post-2000s (Gen Z/Alpha) group, representing 50% of guests.
Recommendations for Hosts
- Focus marketing internationally, particularly towards travelers from Italy.
- Tailor amenities and listing descriptions to appeal to the dominant Post-2000s (Gen Z/Alpha) demographic (e.g., highlight fast WiFi, smart home features, local guides).
- Highlight unique local experiences or amenities relevant to the primary guest profile.
- Consider seasonal promotions aligned with peak travel times for key origin markets.
Nearby Short-Term Rental Market Comparison
How does the Montalcino Airbnb market stack up against its neighbors? Compare key performance metrics like average monthly revenue, ADR, and occupancy rates in surrounding areas to understand the broader regional STR landscape.
| Market | Active Properties | Monthly Revenue | Daily Rate | Avg. Occupancy |
|---|---|---|---|---|
| Crespina | 16 | $3,526 | $493.64 | 48% |
| Tignano | 10 | $3,391 | $500.31 | 36% |
| Luni Mare | 11 | $3,102 | $169.59 | 40% |
| Buonconvento | 59 | $3,068 | $456.70 | 46% |
| Castelfranco di Sotto | 47 | $2,881 | $294.54 | 38% |
| Collazzone | 28 | $2,839 | $341.11 | 36% |
| Florence | 9,598 | $2,833 | $208.48 | 52% |
| Marcialla | 25 | $2,788 | $236.61 | 54% |
| Parrano | 18 | $2,762 | $329.95 | 34% |
| Impruneta | 131 | $2,761 | $237.93 | 45% |