Marciano della Chiana Airbnb Market Analysis 2025: Short Term Rental Data & Vacation Rental Statistics in Tuscany, Italy
Is Airbnb profitable in Marciano della Chiana in 2025? Explore comprehensive Airbnb analytics for Marciano della Chiana, Tuscany, Italy to uncover income potential. This 2025 STR market report for Marciano della Chiana, based on AirROI data from April 2024 to March 2025, reveals key trends in the niche market of 18 active listings.
Whether you're considering an Airbnb investment in Marciano della Chiana, optimizing your existing vacation rental, or exploring rental arbitrage opportunities, understanding the Marciano della Chiana Airbnb data is crucial. Navigating the high regulation landscape is key to maximizing your short term rental income potential. Let's dive into the specifics.
Key Marciano della Chiana Airbnb Performance Metrics Overview
Monthly Airbnb Revenue Variations & Income Potential in Marciano della Chiana (2025)
Understanding the monthly revenue variations for Airbnb listings in Marciano della Chiana is key to maximizing your short term rental income potential. Seasonality significantly impacts earnings. Our analysis, based on data from the past 12 months, shows that the peak revenue month for STRs in Marciano della Chiana is typically July, while March often presents the lowest earnings, highlighting opportunities for strategic pricing adjustments during shoulder and low seasons. Explore the typical Airbnb income in Marciano della Chiana across different performance tiers:
- Best-in-class properties (Top 10%) achieve $11,962+ monthly, often utilizing dynamic pricing and superior guest experiences.
- Strong performing properties (Top 25%) earn $5,459 or more, indicating effective management and desirable locations/amenities.
- Typical properties (Median) generate around $2,422 per month, representing the average market performance.
- Entry-level properties (Bottom 25%) see earnings around $1,524, often with potential for optimization.
Average Monthly Airbnb Earnings Trend in Marciano della Chiana
Marciano della Chiana Airbnb Occupancy Rate Trends (2025)
Maximize your bookings by understanding the Marciano della Chiana STR occupancy trends. Seasonal demand shifts significantly influence how often properties are booked. Typically, Augustsees the highest demand (peak season occupancy), while March experiences the lowest (low season). Effective strategies, like adjusting minimum stays or offering promotions, can boost occupancy during slower periods. Here's how different property tiers perform in Marciano della Chiana:
- Best-in-class properties (Top 10%) achieve 60%+ occupancy, indicating high desirability and potentially optimized availability.
- Strong performing properties (Top 25%) maintain 41% or higher occupancy, suggesting good market fit and guest satisfaction.
- Typical properties (Median) have an occupancy rate around 24%.
- Entry-level properties (Bottom 25%) average 13% occupancy, potentially facing higher vacancy.
Average Monthly Occupancy Rate Trend in Marciano della Chiana
Average Daily Rate (ADR) Airbnb Trends in Marciano della Chiana (2025)
Effective short term rental pricing strategy in Marciano della Chiana involves understanding monthly ADR fluctuations. The Average Daily Rate (ADR) for Airbnb in Marciano della Chiana typically peaks in August and dips lowest during February. Leveraging Airbnb dynamic pricing tools or strategies based on this seasonality can significantly boost revenue. Here's a look at the typical nightly rates achieved:
- Best-in-class properties (Top 10%) command rates of $687+ per night, often due to premium features or locations.
- Strong performing properties (Top 25%) achieve nightly rates of $514 or more.
- Typical properties (Median) charge around $276 per night.
- Entry-level properties (Bottom 25%) earn around $163 per night.
Average Daily Rate (ADR) Trend by Month in Marciano della Chiana
Get Live Marciano della Chiana Market Intelligence 👇

Explore Real-time Analytics
Airbnb Seasonality Analysis & Trends in Marciano della Chiana (2025)
Peak Season (July, August, February)
- Revenue averages $6,833 per month
- Occupancy rates average 46.3%
- Daily rates average $373
Shoulder Season
- Revenue averages $4,555 per month
- Occupancy maintains around 31.0%
- Daily rates hold near $356
Low Season (March, April, May)
- Revenue drops to average $1,605 per month
- Occupancy decreases to average 13.6%
- Daily rates adjust to average $357
Seasonality Insights for Marciano della Chiana
- The Airbnb seasonality in Marciano della Chiana shows highly seasonal trends requiring careful strategy. While the sections above show seasonal averages, it's also insightful to look at the extremes:
- During the high season, the absolute peak month showcases Marciano della Chiana's highest earning potential, with monthly revenues capable of climbing to $7,863, occupancy reaching a high of 50.4%, and ADRs peaking at $390.
- Conversely, the slowest single month of the year, typically falling within the low season, marks the market's lowest point. In this month, revenue might dip to $440, occupancy could drop to 3.2%, and ADRs may adjust down to $340.
- Understanding both the seasonal averages and these monthly peaks and troughs in revenue, occupancy, and ADR is crucial for maximizing your Airbnb profit potential in Marciano della Chiana.
Seasonal Strategies for Maximizing Profit
- Peak Season: Maximize revenue through premium pricing and potentially longer minimum stays. Ensure high availability.
- Low Season: Offer competitive pricing, special promotions (e.g., extended stay discounts), and flexible cancellation policies. Target off-season travelers like remote workers or budget-conscious guests.
- Shoulder Seasons: Implement dynamic pricing that balances peak and low rates. Target weekend travelers or specific events. Offer slightly more flexible terms than peak season.
- Regularly analyze your own performance against these Marciano della Chiana seasonality benchmarks and adjust your pricing and availability strategy accordingly.
Best Areas for Airbnb Investment in Marciano della Chiana (2025)
Exploring the top neighborhoods for short-term rentals in Marciano della Chiana? This section highlights key areas, outlining why they are attractive for hosts and guests, along with notable local attractions. Consider these locations based on your target guest profile and investment strategy.
| Neighborhood / Area | Why Host Here? (Target Guests & Appeal) | Key Attractions & Landmarks |
|---|---|---|
| Centro Storico | The historic center of Marciano della Chiana is rich in culture and history, attracting visitors interested in exploring its medieval architecture and local traditions. | Piazza A. Gramsci, Chiesa di San Bartolomeo, Antico Palazzo, Castello di Marciano, local artisan shops, Tuscany wineries |
| Cultura Locale | This area is known for its authentic Tuscan lifestyle, making it attractive for guests wanting an immersive experience in local culture, cuisine, and traditions. | Local trattorias, Agriturismo experiences, Wine tasting tours, Traditional festivals, Cooking classes, Nature walks |
| Nature & Outdoors | Nearby natural attractions offer opportunities for hiking, biking, and enjoying the beautiful Tuscan landscape, appealing to nature lovers and outdoor enthusiasts. | Val d'Orcia, Cortona hiking trails, Parco Nazionale delle Foreste Casentinesi, Scenic viewpoints, Biking routes through vineyards, Picnic areas |
| Proximity to Arezzo | Located just a short drive from Arezzo, this area attracts tourists who want to explore a larger city while enjoying a quieter countryside stay. | Arezzo's historic center, Piazza Grande, Basilica di San Francesco, Museo Archeologico, local markets |
| Wine Country | This area is surrounded by renowned vineyards and olive groves, ideal for guests looking to tour wineries and enjoy wine tasting experiences. | Chianti wine route, Olive oil tastings, Vineyard tours, Wine festivals, Rural landscapes |
| Art & History | Marciano della Chiana has remarkable artistic and historical sites, making it appealing to those interested in art history and cultural heritage. | Museo della Communità di Marciano, local art galleries, historical reenactments, Tuscan fortresses, art exhibitions |
| Relaxation Retreats | With many options for wellness and relaxation, this area is ideal for guests looking for a serene getaway, including spas and wellness centers. | Spa resorts, Yoga retreats, Meditation centers, Natural hot springs, Quiet countryside |
| Event & Festival Hub | Throughout the year, Marciano hosts various local festivals and events, attracting visitors looking for an exciting, enriching experience. | Annual food festivals, Cultural fairs, Music events, Traditional parades, Craft markets |
Understanding Airbnb License Requirements & STR Laws in Marciano della Chiana (2025)
Yes, Marciano della Chiana, Tuscany, Italy enforces high STR regulations. Obtaining a license and ensuring compliance is almost certainly required according to current 2025 STR laws. Always verify the latest short term rental regulations and Airbnb license requirements directly with local government authorities for Marciano della Chiana to ensure full compliance before hosting.
(Source: AirROI data, 2025, based on 56% licensed listings)
Top Performing Airbnb Properties in Marciano della Chiana (2025)
Benchmark your potential! Explore examples of top-performing Airbnb properties in Marciano della Chianabased on Trailing Twelve Month (TTM) revenue. Analyze their characteristics, revenue, occupancy rate, and ADR to understand what drives success in this market.
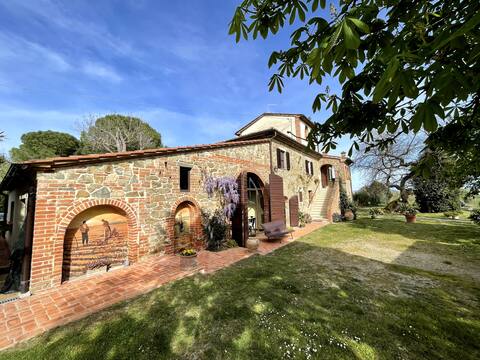
Tuscany Traditional Stone Villa with private pool
Entire Place • 6 bedrooms
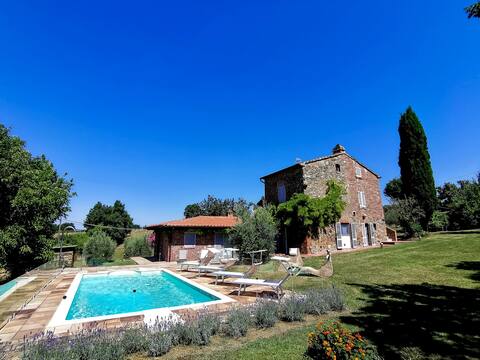
La Bacaia
Entire Place • 4 bedrooms
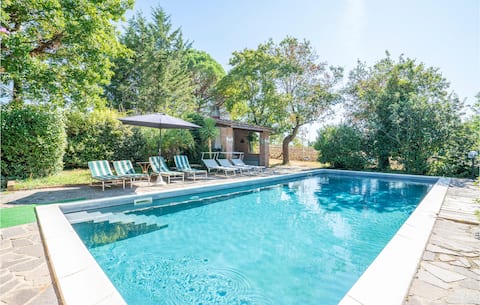
Le Vignacce
Entire Place • 4 bedrooms
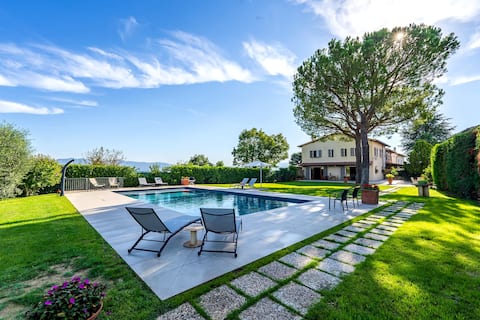
Il Fico e la Civetta
Entire Place • 4 bedrooms
Villa Scannagallo
Entire Place • 12 bedrooms
Apartment Orteti 8+2 | 135m
Entire Place • 4 bedrooms
Note: Performance varies based on location, size, amenities, seasonality, and management quality. Data reflects the past 12 months.
Top Performing Airbnb Hosts in Marciano della Chiana (2025)
Learn from the best! This table showcases top-performing Airbnb hosts in Marciano della Chiana based on the number of properties managed and estimated total revenue over the past year. Analyze their scale and performance metrics.
| Host Name | Properties | Grossing Revenue | Stay Reviews | Avg Rating |
|---|---|---|---|---|
| Gabriele | 1 | $171,708 | 28 | 4.86/5.0 |
| Luciano | 6 | $139,403 | 116 | 4.90/5.0 |
| Alessia | 1 | $89,176 | 69 | 4.96/5.0 |
| Vittorio | 2 | $60,848 | 12 | 4.33/5.0 |
| Host #410221343 | 1 | $56,674 | 2 | 0.00/5.0 |
| Host #46706000 | 1 | $45,163 | 1 | 0.00/5.0 |
| Margherita | 2 | $10,223 | 18 | 4.88/5.0 |
| Host #210919829 | 1 | $6,364 | 0 | 0.00/5.0 |
| Host #496922659 | 1 | $5,256 | 0 | 0.00/5.0 |
| Monika | 1 | $1,883 | 5 | 4.80/5.0 |
Analyzing the strategies of top hosts, such as their property selection, pricing, and guest communication, can offer valuable lessons for optimizing your own Airbnb operations in Marciano della Chiana.
Dive Deeper: Advanced Marciano della Chiana STR Market Data (2025)
Ready to unlock more insights? AirROI provides access to advanced metrics and comprehensive Airbnb data for Marciano della Chiana. Explore detailed analytics beyond this report to refine your investment strategy, optimize pricing, and maximize your vacation rental profits.
Explore Advanced MetricsMarciano della Chiana Short-Term Rental Market Composition (2025): Property & Room Types
Room Type Distribution
Property Type Distribution
Market Composition Insights for Marciano della Chiana
- The Marciano della Chiana Airbnb market composition is heavily skewed towards Entire Home/Apt listings, which make up 100% of the 18 active rentals. This indicates strong guest preference for privacy and space.
- Looking at the property type distribution in Marciano della Chiana, Apartment/Condo properties are the most common (55.6%), reflecting the local real estate landscape.
- Houses represent a significant 44.4% portion, catering likely to families or larger groups.
Marciano della Chiana Airbnb Room Capacity Analysis (2025): Bedroom Distribution
Distribution of Listings by Number of Bedrooms
Room Capacity Insights for Marciano della Chiana
- The dominant room capacity in Marciano della Chiana is 5+ bedrooms listings, making up 22.2% of the market. This suggests a strong demand for properties suitable for families or small groups.
- Together, 5+ bedrooms and 2 bedrooms properties represent 44.4% of the active Airbnb listings in Marciano della Chiana, indicating a high concentration in these sizes.
- A significant 61.1% of listings offer 3+ bedrooms, catering to larger groups and families seeking more space in Marciano della Chiana.
Marciano della Chiana Vacation Rental Guest Capacity Trends (2025)
Distribution of Listings by Guest Capacity
Guest Capacity Insights for Marciano della Chiana
- The most common guest capacity trend in Marciano della Chiana vacation rentals is listings accommodating 8+ guests (44.4%). This suggests the primary traveler segment is likely larger groups.
- Properties designed for 8+ guests and 6 guests dominate the Marciano della Chiana STR market, accounting for 66.6% of listings.
- 66.6% of properties accommodate 6+ guests, serving the market segment for larger families or group travel in Marciano della Chiana.
- On average, properties in Marciano della Chiana are equipped to host 6.2 guests.
Marciano della Chiana Airbnb Booking Patterns (2025): Available vs. Booked Days
Available Days Distribution
Booked Days Distribution
Booking Pattern Insights for Marciano della Chiana
- The most common availability pattern in Marciano della Chiana falls within the 271-366 days range, representing 66.7% of listings. This suggests many properties have significant open periods on their calendars.
- Approximately 94.5% of listings show high availability (181+ days open annually), indicating potential for increased bookings or specific owner usage patterns.
- For booked days, the 31-90 days range is most frequent in Marciano della Chiana (33.3%), reflecting common guest stay durations or potential owner blocking patterns.
- A notable 5.6% of properties secure long booking periods (181+ days booked per year), highlighting successful long-term rental strategies or significant owner usage.
Marciano della Chiana Airbnb Minimum Stay Requirements Analysis
Distribution of Listings by Minimum Night Requirement
1 Night
7 listings
50% of total
3 Nights
1 listings
7.1% of total
4-6 Nights
3 listings
21.4% of total
7-29 Nights
1 listings
7.1% of total
30+ Nights
2 listings
14.3% of total
Key Insights
- The most prevalent minimum stay requirement in Marciano della Chiana is 1 Night, adopted by 50% of listings. This highlights the market's preference for shorter, flexible bookings.
- A significant segment (14.3%) caters to monthly stays (30+ nights) in Marciano della Chiana, pointing to opportunities in the extended-stay market.
Recommendations
- Align with the market by considering a 1 Night minimum stay, as 50% of Marciano della Chiana hosts use this setting.
- Explore offering discounts for stays of 30+ nights to attract the 14.3% of the market seeking extended stays.
- Adjust minimum nights based on seasonality – potentially shorter during low season and longer during peak demand periods in Marciano della Chiana.
Marciano della Chiana Airbnb Cancellation Policy Trends Analysis (2025)
Super Strict 60 Days
2 listings
13.3% of total
Moderate
1 listings
6.7% of total
Strict
12 listings
80% of total
Cancellation Policy Insights for Marciano della Chiana
- The prevailing Airbnb cancellation policy trend in Marciano della Chiana is Strict, used by 80% of listings.
- A majority (80.0%) of hosts in Marciano della Chiana utilize Firm or Strict policies, indicating a market where hosts prioritize booking security.
Recommendations for Hosts
- Consider adopting a Strict policy to align with the 80% market standard in Marciano della Chiana.
- With 80% using Strict terms, this is a viable option in Marciano della Chiana, particularly for high-value properties or during peak demand periods.
- Regularly review your cancellation policy against competitors and market demand shifts in Marciano della Chiana.
Marciano della Chiana STR Booking Lead Time Analysis (2025)
Average Booking Lead Time by Month
Booking Lead Time Insights for Marciano della Chiana
- The overall average booking lead time for vacation rentals in Marciano della Chiana is 96 days.
- Guests book furthest in advance for stays during October (average 175 days), likely coinciding with peak travel demand or local events.
- The shortest booking windows occur for stays in February (average 19 days), indicating more last-minute travel plans during this time.
- Seasonally, Summer (138 days avg.) sees the longest lead times, while Winter (70 days avg.) has the shortest, reflecting typical travel planning cycles.
Recommendations for Hosts
- Use the overall average lead time (96 days) as a baseline for your pricing and availability strategy in Marciano della Chiana.
- For October stays, consider implementing length-of-stay discounts or slightly higher rates for bookings made less than 175 days out to capitalize on advance planning.
- Target marketing efforts for the Summer season well in advance (at least 138 days) to capture early planners.
- Monitor your own booking lead times against these Marciano della Chiana averages to identify opportunities for dynamic pricing adjustments.
Popular & Essential Airbnb Amenities in Marciano della Chiana (2025)
Amenity Prevalence
No amenities with partial availability (less than 100%) were found to display in the chart. All essential amenities might be present in all listings. Check insights below.
Amenity Insights for Marciano della Chiana
- Essential amenities in Marciano della Chiana that guests expect include: Refrigerator, Wifi, Free parking on premises, Heating, TV, Washer, Pool, Dishes and silverware, Hot water, Kitchen. Lacking these (any) could significantly impact bookings.
Recommendations for Hosts
- Ensure your listing includes all essential amenities for Marciano della Chiana: Refrigerator, Wifi, Free parking on premises, Heating, TV, Washer, Pool, Dishes and silverware, Hot water, Kitchen.
- Highlight unique or less common amenities you offer (e.g., hot tub, dedicated workspace, EV charger) in your listing description and photos.
- Regularly check competitor amenities in Marciano della Chiana to stay competitive.
Marciano della Chiana Airbnb Guest Demographics & Profile Analysis (2025)
Guest Profile Summary for Marciano della Chiana
- The typical guest profile for Airbnb in Marciano della Chiana consists of predominantly international visitors (83%), with top international origins including Italy, typically belonging to the Post-2000s (Gen Z/Alpha) group (50%), primarily speaking English or German.
- Domestic travelers account for 16.9% of guests.
- Key international markets include United States (26.2%) and Italy (16.9%).
- Top languages spoken are English (46.6%) followed by German (12.1%).
- A significant demographic segment is the Post-2000s (Gen Z/Alpha) group, representing 50% of guests.
Recommendations for Hosts
- Focus marketing internationally, particularly towards travelers from Italy.
- Tailor amenities and listing descriptions to appeal to the dominant Post-2000s (Gen Z/Alpha) demographic (e.g., highlight fast WiFi, smart home features, local guides).
- Highlight unique local experiences or amenities relevant to the primary guest profile.
- Consider seasonal promotions aligned with peak travel times for key origin markets.
Nearby Short-Term Rental Market Comparison
How does the Marciano della Chiana Airbnb market stack up against its neighbors? Compare key performance metrics like average monthly revenue, ADR, and occupancy rates in surrounding areas to understand the broader regional STR landscape.
| Market | Active Properties | Monthly Revenue | Daily Rate | Avg. Occupancy |
|---|---|---|---|---|
| Crespina | 16 | $3,526 | $493.64 | 48% |
| Tignano | 10 | $3,391 | $500.31 | 36% |
| Luni Mare | 11 | $3,102 | $169.59 | 40% |
| Buonconvento | 59 | $3,068 | $456.70 | 46% |
| Castelfranco di Sotto | 47 | $2,881 | $294.54 | 38% |
| Collazzone | 28 | $2,839 | $341.11 | 36% |
| Florence | 9,598 | $2,833 | $208.48 | 52% |
| Marcialla | 25 | $2,788 | $236.61 | 54% |
| Parrano | 18 | $2,762 | $329.95 | 34% |
| Impruneta | 131 | $2,761 | $237.93 | 45% |