Londa Airbnb Market Analysis 2025: Short Term Rental Data & Vacation Rental Statistics in Tuscany, Italy
Is Airbnb profitable in Londa in 2025? Explore comprehensive Airbnb analytics for Londa, Tuscany, Italy to uncover income potential. This 2025 STR market report for Londa, based on AirROI data from April 2024 to March 2025, reveals key trends in the niche market of 34 active listings.
Whether you're considering an Airbnb investment in Londa, optimizing your existing vacation rental, or exploring rental arbitrage opportunities, understanding the Londa Airbnb data is crucial. Navigating the high regulation landscape is key to maximizing your short term rental income potential. Let's dive into the specifics.
Key Londa Airbnb Performance Metrics Overview
Monthly Airbnb Revenue Variations & Income Potential in Londa (2025)
Understanding the monthly revenue variations for Airbnb listings in Londa is key to maximizing your short term rental income potential. Seasonality significantly impacts earnings. Our analysis, based on data from the past 12 months, shows that the peak revenue month for STRs in Londa is typically July, while February often presents the lowest earnings, highlighting opportunities for strategic pricing adjustments during shoulder and low seasons. Explore the typical Airbnb income in Londa across different performance tiers:
- Best-in-class properties (Top 10%) achieve $4,631+ monthly, often utilizing dynamic pricing and superior guest experiences.
- Strong performing properties (Top 25%) earn $2,462 or more, indicating effective management and desirable locations/amenities.
- Typical properties (Median) generate around $1,144 per month, representing the average market performance.
- Entry-level properties (Bottom 25%) see earnings around $490, often with potential for optimization.
Average Monthly Airbnb Earnings Trend in Londa
Londa Airbnb Occupancy Rate Trends (2025)
Maximize your bookings by understanding the Londa STR occupancy trends. Seasonal demand shifts significantly influence how often properties are booked. Typically, Julysees the highest demand (peak season occupancy), while February experiences the lowest (low season). Effective strategies, like adjusting minimum stays or offering promotions, can boost occupancy during slower periods. Here's how different property tiers perform in Londa:
- Best-in-class properties (Top 10%) achieve 61%+ occupancy, indicating high desirability and potentially optimized availability.
- Strong performing properties (Top 25%) maintain 40% or higher occupancy, suggesting good market fit and guest satisfaction.
- Typical properties (Median) have an occupancy rate around 26%.
- Entry-level properties (Bottom 25%) average 13% occupancy, potentially facing higher vacancy.
Average Monthly Occupancy Rate Trend in Londa
Average Daily Rate (ADR) Airbnb Trends in Londa (2025)
Effective short term rental pricing strategy in Londa involves understanding monthly ADR fluctuations. The Average Daily Rate (ADR) for Airbnb in Londa typically peaks in July and dips lowest during November. Leveraging Airbnb dynamic pricing tools or strategies based on this seasonality can significantly boost revenue. Here's a look at the typical nightly rates achieved:
- Best-in-class properties (Top 10%) command rates of $405+ per night, often due to premium features or locations.
- Strong performing properties (Top 25%) achieve nightly rates of $198 or more.
- Typical properties (Median) charge around $121 per night.
- Entry-level properties (Bottom 25%) earn around $98 per night.
Average Daily Rate (ADR) Trend by Month in Londa
Get Live Londa Market Intelligence 👇

Explore Real-time Analytics
Airbnb Seasonality Analysis & Trends in Londa (2025)
Peak Season (July, August, May)
- Revenue averages $3,599 per month
- Occupancy rates average 53.3%
- Daily rates average $200
Shoulder Season
- Revenue averages $1,818 per month
- Occupancy maintains around 27.9%
- Daily rates hold near $190
Low Season (January, February, December)
- Revenue drops to average $564 per month
- Occupancy decreases to average 10.1%
- Daily rates adjust to average $181
Seasonality Insights for Londa
- The Airbnb seasonality in Londa shows highly seasonal trends requiring careful strategy. While the sections above show seasonal averages, it's also insightful to look at the extremes:
- During the high season, the absolute peak month showcases Londa's highest earning potential, with monthly revenues capable of climbing to $4,088, occupancy reaching a high of 61.6%, and ADRs peaking at $204.
- Conversely, the slowest single month of the year, typically falling within the low season, marks the market's lowest point. In this month, revenue might dip to $352, occupancy could drop to 7.8%, and ADRs may adjust down to $179.
- Understanding both the seasonal averages and these monthly peaks and troughs in revenue, occupancy, and ADR is crucial for maximizing your Airbnb profit potential in Londa.
Seasonal Strategies for Maximizing Profit
- Peak Season: Maximize revenue through premium pricing and potentially longer minimum stays. Ensure high availability.
- Low Season: Offer competitive pricing, special promotions (e.g., extended stay discounts), and flexible cancellation policies. Target off-season travelers like remote workers or budget-conscious guests.
- Shoulder Seasons: Implement dynamic pricing that balances peak and low rates. Target weekend travelers or specific events. Offer slightly more flexible terms than peak season.
- Regularly analyze your own performance against these Londa seasonality benchmarks and adjust your pricing and availability strategy accordingly.
Best Areas for Airbnb Investment in Londa (2025)
Exploring the top neighborhoods for short-term rentals in Londa? This section highlights key areas, outlining why they are attractive for hosts and guests, along with notable local attractions. Consider these locations based on your target guest profile and investment strategy.
| Neighborhood / Area | Why Host Here? (Target Guests & Appeal) | Key Attractions & Landmarks |
|---|---|---|
| Florence Historic Centre | The heart of Florence, known for its stunning architecture and rich history. A prime location for tourists visiting iconic sites like the Duomo and Uffizi Gallery. | Duomo di Firenze, Uffizi Gallery, Ponte Vecchio, Piazza della Signoria, Palazzo Vecchio, Boboli Gardens |
| San Gimignano | Famous for its medieval towers and beautiful landscapes, it draws visitors seeking a taste of Tuscany's history and charm. | Torres of San Gimignano, Collegiata di San Gimignano, San Gimignano 1300, Piazza della Cisterna, Vernaccia di San Gimignano, Museo della Tortura |
| Chianti Region | Renowned for its wine production and picturesque rolling hills, this area attracts wine enthusiasts and couples seeking romantic getaways. | Castello di Brolio, Wine Tasting Tours, Chianti Sculpture Park, Greve in Chianti, Villa Vignamaggio, Castello di Verrazzano |
| Pisa | Home to the iconic Leaning Tower, this city is a major tourist destination with both historic and cultural significance. | Leaning Tower of Pisa, Piazza dei Miracoli, Pisa Cathedral, Baptistery of St. John, Museo dell'Opera del Duomo, Botanical Garden of Pisa |
| Lucca | A charming walled city known for its well-preserved Renaissance walls and historic architecture, appealing to visitors seeking tranquility and beauty. | Lucca's City Walls, Piazza dell'Anfiteatro, Lucca Cathedral, Guinigi Tower, Torre delle Ore, Basilica di San Frediano |
| Siena | Famous for its medieval brick buildings and the historic Palio horse race, it's a city rich in culture and Tuscan tradition. | Piazza del Campo, Siena Cathedral, Torre del Mangia, Palazzo Pubblico, Basilica di San Domenico, Museo dell'Opera Metropolitana |
| Volterra | Known for its Etruscan history and alabaster craftsmanship, it offers a unique perspective of Tuscany's ancient heritage. | Roman Theatre of Volterra, Etruscan Museum, Palazzo dei Priori, Medici Fortress, Piazza dei Priori, Alabaster Workshops |
| Cortona | A historic hilltop town with stunning views and Etruscan roots, attracting visitors looking for culture and pastoral scenery. | Cortona Fortress, Diocesan Museum, Piazza della Repubblica, Etruscan Academy Museum of the Etruscan Heritage, Santa Margherita Sanctuary, Francesco's Sanctuary |
Understanding Airbnb License Requirements & STR Laws in Londa (2025)
Yes, Londa, Tuscany, Italy enforces high STR regulations. Obtaining a license and ensuring compliance is almost certainly required according to current 2025 STR laws. Always verify the latest short term rental regulations and Airbnb license requirements directly with local government authorities for Londa to ensure full compliance before hosting.
(Source: AirROI data, 2025, based on 53% licensed listings)
Top Performing Airbnb Properties in Londa (2025)
Benchmark your potential! Explore examples of top-performing Airbnb properties in Londabased on Trailing Twelve Month (TTM) revenue. Analyze their characteristics, revenue, occupancy rate, and ADR to understand what drives success in this market.
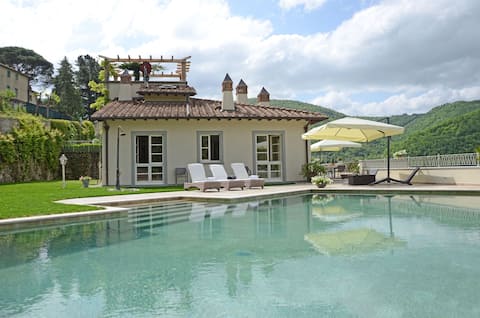
Villa Caiano Dependance - Villa with private pool
Entire Place • 4 bedrooms
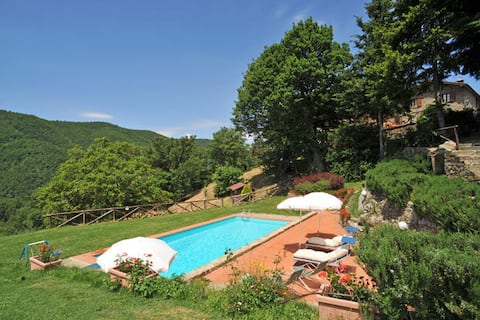
Mountain View Watermill Villa
Entire Place • 9 bedrooms
Villa Caiano Main Villa - Villa with private pool
Entire Place • 4 bedrooms

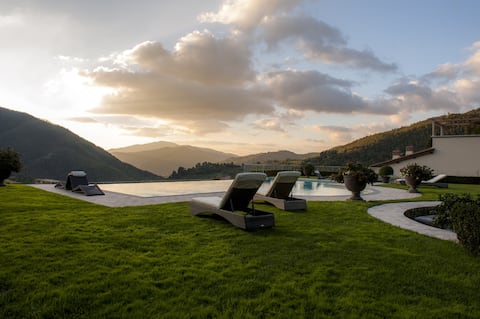
Luxury Country Retreat near Florence with Jacuzzi
Entire Place • 1 bedroom

Charming spacious Tuscan farmhouse 12, dogfriendly
Entire Place • 7 bedrooms

Le Tagliate, the heart of Mugello
Entire Place • 4 bedrooms
Note: Performance varies based on location, size, amenities, seasonality, and management quality. Data reflects the past 12 months.
Top Performing Airbnb Hosts in Londa (2025)
Learn from the best! This table showcases top-performing Airbnb hosts in Londa based on the number of properties managed and estimated total revenue over the past year. Analyze their scale and performance metrics.
| Host Name | Properties | Grossing Revenue | Stay Reviews | Avg Rating |
|---|---|---|---|---|
| Leonardo | 2 | $110,588 | 12 | 4.80/5.0 |
| Adriana | 2 | $61,654 | 67 | 4.93/5.0 |
| Peter | 1 | $56,217 | 43 | 4.40/5.0 |
| Nanette E Tommaso | 1 | $41,169 | 31 | 5.00/5.0 |
| Marialuisa | 3 | $38,995 | 80 | 4.85/5.0 |
| Niccolò | 2 | $32,389 | 18 | 4.69/5.0 |
| Marco | 5 | $28,164 | 113 | 4.43/5.0 |
| Benedetta | 1 | $28,029 | 75 | 4.89/5.0 |
| Francesca | 1 | $27,496 | 18 | 4.94/5.0 |
| Guido | 3 | $25,993 | 16 | 2.81/5.0 |
Analyzing the strategies of top hosts, such as their property selection, pricing, and guest communication, can offer valuable lessons for optimizing your own Airbnb operations in Londa.
Dive Deeper: Advanced Londa STR Market Data (2025)
Ready to unlock more insights? AirROI provides access to advanced metrics and comprehensive Airbnb data for Londa. Explore detailed analytics beyond this report to refine your investment strategy, optimize pricing, and maximize your vacation rental profits.
Explore Advanced MetricsLonda Short-Term Rental Market Composition (2025): Property & Room Types
Room Type Distribution
Property Type Distribution
Market Composition Insights for Londa
- The Londa Airbnb market composition is heavily skewed towards Entire Home/Apt listings, which make up 88.2% of the 34 active rentals. This indicates strong guest preference for privacy and space.
- Looking at the property type distribution in Londa, House properties are the most common (64.7%), reflecting the local real estate landscape.
- Houses represent a significant 64.7% portion, catering likely to families or larger groups.
- Smaller segments like hotel/boutique, others (combined 5.8%) offer potential for unique stay experiences.
Londa Airbnb Room Capacity Analysis (2025): Bedroom Distribution
Distribution of Listings by Number of Bedrooms
Room Capacity Insights for Londa
- The dominant room capacity in Londa is 1 bedroom listings, making up 29.4% of the market. This suggests a strong demand for properties suitable for couples or solo travelers.
- Together, 1 bedroom and 2 bedrooms properties represent 55.9% of the active Airbnb listings in Londa, indicating a high concentration in these sizes.
- A significant 38.3% of listings offer 3+ bedrooms, catering to larger groups and families seeking more space in Londa.
Londa Vacation Rental Guest Capacity Trends (2025)
Distribution of Listings by Guest Capacity
Guest Capacity Insights for Londa
- The most common guest capacity trend in Londa vacation rentals is listings accommodating 2 guests (23.5%). This suggests the primary traveler segment is likely couples or solo travelers.
- Properties designed for 2 guests and 5 guests dominate the Londa STR market, accounting for 41.1% of listings.
- 35.2% of properties accommodate 6+ guests, serving the market segment for larger families or group travel in Londa.
- On average, properties in Londa are equipped to host 4.6 guests.
Londa Airbnb Booking Patterns (2025): Available vs. Booked Days
Available Days Distribution
Booked Days Distribution
Booking Pattern Insights for Londa
- The most common availability pattern in Londa falls within the 271-366 days range, representing 67.6% of listings. This suggests many properties have significant open periods on their calendars.
- Approximately 97.0% of listings show high availability (181+ days open annually), indicating potential for increased bookings or specific owner usage patterns.
- For booked days, the 31-90 days range is most frequent in Londa (35.3%), reflecting common guest stay durations or potential owner blocking patterns.
- A notable 2.9% of properties secure long booking periods (181+ days booked per year), highlighting successful long-term rental strategies or significant owner usage.
Londa Airbnb Minimum Stay Requirements Analysis
Distribution of Listings by Minimum Night Requirement
1 Night
9 listings
28.1% of total
2 Nights
5 listings
15.6% of total
3 Nights
2 listings
6.3% of total
4-6 Nights
11 listings
34.4% of total
7-29 Nights
4 listings
12.5% of total
30+ Nights
1 listings
3.1% of total
Key Insights
- The most prevalent minimum stay requirement in Londa is 4-6 Nights, adopted by 34.4% of listings. This highlights the market's preference for longer commitments.
Recommendations
- Align with the market by considering a 4-6 Nights minimum stay, as 34.4% of Londa hosts use this setting.
- If feasible, allowing 1-night stays, especially midweek or during low season, could capture last-minute bookings, as only 28.1% currently do.
- Adjust minimum nights based on seasonality – potentially shorter during low season and longer during peak demand periods in Londa.
Londa Airbnb Cancellation Policy Trends Analysis (2025)
Super Strict 30 Days
3 listings
9.7% of total
Flexible
8 listings
25.8% of total
Moderate
4 listings
12.9% of total
Strict
16 listings
51.6% of total
Cancellation Policy Insights for Londa
- The prevailing Airbnb cancellation policy trend in Londa is Strict, used by 51.6% of listings.
- A majority (51.6%) of hosts in Londa utilize Firm or Strict policies, indicating a market where hosts prioritize booking security.
Recommendations for Hosts
- Consider adopting a Strict policy to align with the 51.6% market standard in Londa.
- With 51.6% using Strict terms, this is a viable option in Londa, particularly for high-value properties or during peak demand periods.
- Regularly review your cancellation policy against competitors and market demand shifts in Londa.
Londa STR Booking Lead Time Analysis (2025)
Average Booking Lead Time by Month
Booking Lead Time Insights for Londa
- The overall average booking lead time for vacation rentals in Londa is 98 days.
- Guests book furthest in advance for stays during July (average 125 days), likely coinciding with peak travel demand or local events.
- The shortest booking windows occur for stays in March (average 4 days), indicating more last-minute travel plans during this time.
- Seasonally, Summer (114 days avg.) sees the longest lead times, while Winter (27 days avg.) has the shortest, reflecting typical travel planning cycles.
Recommendations for Hosts
- Use the overall average lead time (98 days) as a baseline for your pricing and availability strategy in Londa.
- For July stays, consider implementing length-of-stay discounts or slightly higher rates for bookings made less than 125 days out to capitalize on advance planning.
- During March, focus on last-minute booking availability and promotions, as guests book with very short notice (4 days avg.).
- Target marketing efforts for the Summer season well in advance (at least 114 days) to capture early planners.
- Monitor your own booking lead times against these Londa averages to identify opportunities for dynamic pricing adjustments.
Popular & Essential Airbnb Amenities in Londa (2025)
Amenity Prevalence
Amenity Insights for Londa
- Popular amenities like Wifi, Kitchen, Essentials are common but not universal. Offering these can provide a competitive edge.
- Warning: Wifi is not universally provided but is considered essential globally. Ensure reliable Wifi is offered.
Recommendations for Hosts
- Consider adding popular differentiators like Wifi or Kitchen to increase appeal.
- Highlight unique or less common amenities you offer (e.g., hot tub, dedicated workspace, EV charger) in your listing description and photos.
- Regularly check competitor amenities in Londa to stay competitive.
Londa Airbnb Guest Demographics & Profile Analysis (2025)
Guest Profile Summary for Londa
- The typical guest profile for Airbnb in Londa consists of predominantly international visitors (81%), with top international origins including Italy, typically belonging to the Post-2000s (Gen Z/Alpha) group (50%), primarily speaking English or German.
- Domestic travelers account for 19.0% of guests.
- Key international markets include Germany (21%) and Italy (19%).
- Top languages spoken are English (38.5%) followed by German (16.2%).
- A significant demographic segment is the Post-2000s (Gen Z/Alpha) group, representing 50% of guests.
Recommendations for Hosts
- Focus marketing internationally, particularly towards travelers from Italy.
- Tailor amenities and listing descriptions to appeal to the dominant Post-2000s (Gen Z/Alpha) demographic (e.g., highlight fast WiFi, smart home features, local guides).
- Highlight unique local experiences or amenities relevant to the primary guest profile.
- Consider seasonal promotions aligned with peak travel times for key origin markets.
Nearby Short-Term Rental Market Comparison
How does the Londa Airbnb market stack up against its neighbors? Compare key performance metrics like average monthly revenue, ADR, and occupancy rates in surrounding areas to understand the broader regional STR landscape.
| Market | Active Properties | Monthly Revenue | Daily Rate | Avg. Occupancy |
|---|---|---|---|---|
| Crespina | 16 | $3,526 | $493.64 | 48% |
| Tignano | 10 | $3,391 | $500.31 | 36% |
| Luni Mare | 11 | $3,102 | $169.59 | 40% |
| Buonconvento | 59 | $3,068 | $456.70 | 46% |
| Castelfranco di Sotto | 47 | $2,881 | $294.54 | 38% |
| Collazzone | 28 | $2,839 | $341.11 | 36% |
| Florence | 9,598 | $2,833 | $208.48 | 52% |
| Marcialla | 25 | $2,788 | $236.61 | 54% |
| Parrano | 18 | $2,762 | $329.95 | 34% |
| Impruneta | 131 | $2,761 | $237.93 | 45% |