Follonica Airbnb Market Analysis 2025: Short Term Rental Data & Vacation Rental Statistics in Tuscany, Italy
Is Airbnb profitable in Follonica in 2025? Explore comprehensive Airbnb analytics for Follonica, Tuscany, Italy to uncover income potential. This 2025 STR market report for Follonica, based on AirROI data from April 2024 to March 2025, reveals key trends in the market of 298 active listings.
Whether you're considering an Airbnb investment in Follonica, optimizing your existing vacation rental, or exploring rental arbitrage opportunities, understanding the Follonica Airbnb data is crucial. Navigating the high regulation landscape is key to maximizing your short term rental income potential. Let's dive into the specifics.
Key Follonica Airbnb Performance Metrics Overview
Monthly Airbnb Revenue Variations & Income Potential in Follonica (2025)
Understanding the monthly revenue variations for Airbnb listings in Follonica is key to maximizing your short term rental income potential. Seasonality significantly impacts earnings. Our analysis, based on data from the past 12 months, shows that the peak revenue month for STRs in Follonica is typically August, while January often presents the lowest earnings, highlighting opportunities for strategic pricing adjustments during shoulder and low seasons. Explore the typical Airbnb income in Follonica across different performance tiers:
- Best-in-class properties (Top 10%) achieve $3,031+ monthly, often utilizing dynamic pricing and superior guest experiences.
- Strong performing properties (Top 25%) earn $1,885 or more, indicating effective management and desirable locations/amenities.
- Typical properties (Median) generate around $1,094 per month, representing the average market performance.
- Entry-level properties (Bottom 25%) see earnings around $554, often with potential for optimization.
Average Monthly Airbnb Earnings Trend in Follonica
Follonica Airbnb Occupancy Rate Trends (2025)
Maximize your bookings by understanding the Follonica STR occupancy trends. Seasonal demand shifts significantly influence how often properties are booked. Typically, Augustsees the highest demand (peak season occupancy), while January experiences the lowest (low season). Effective strategies, like adjusting minimum stays or offering promotions, can boost occupancy during slower periods. Here's how different property tiers perform in Follonica:
- Best-in-class properties (Top 10%) achieve 62%+ occupancy, indicating high desirability and potentially optimized availability.
- Strong performing properties (Top 25%) maintain 47% or higher occupancy, suggesting good market fit and guest satisfaction.
- Typical properties (Median) have an occupancy rate around 28%.
- Entry-level properties (Bottom 25%) average 13% occupancy, potentially facing higher vacancy.
Average Monthly Occupancy Rate Trend in Follonica
Average Daily Rate (ADR) Airbnb Trends in Follonica (2025)
Effective short term rental pricing strategy in Follonica involves understanding monthly ADR fluctuations. The Average Daily Rate (ADR) for Airbnb in Follonica typically peaks in August and dips lowest during March. Leveraging Airbnb dynamic pricing tools or strategies based on this seasonality can significantly boost revenue. Here's a look at the typical nightly rates achieved:
- Best-in-class properties (Top 10%) command rates of $196+ per night, often due to premium features or locations.
- Strong performing properties (Top 25%) achieve nightly rates of $153 or more.
- Typical properties (Median) charge around $116 per night.
- Entry-level properties (Bottom 25%) earn around $91 per night.
Average Daily Rate (ADR) Trend by Month in Follonica
Get Live Follonica Market Intelligence 👇

Explore Real-time Analytics
Airbnb Seasonality Analysis & Trends in Follonica (2025)
Peak Season (August, July, June)
- Revenue averages $2,715 per month
- Occupancy rates average 51.5%
- Daily rates average $144
Shoulder Season
- Revenue averages $1,184 per month
- Occupancy maintains around 27.4%
- Daily rates hold near $128
Low Season (January, February, December)
- Revenue drops to average $635 per month
- Occupancy decreases to average 19.4%
- Daily rates adjust to average $124
Seasonality Insights for Follonica
- The Airbnb seasonality in Follonica shows highly seasonal trends requiring careful strategy. While the sections above show seasonal averages, it's also insightful to look at the extremes:
- During the high season, the absolute peak month showcases Follonica's highest earning potential, with monthly revenues capable of climbing to $3,125, occupancy reaching a high of 60.8%, and ADRs peaking at $148.
- Conversely, the slowest single month of the year, typically falling within the low season, marks the market's lowest point. In this month, revenue might dip to $553, occupancy could drop to 17.3%, and ADRs may adjust down to $121.
- Understanding both the seasonal averages and these monthly peaks and troughs in revenue, occupancy, and ADR is crucial for maximizing your Airbnb profit potential in Follonica.
Seasonal Strategies for Maximizing Profit
- Peak Season: Maximize revenue through premium pricing and potentially longer minimum stays. Ensure high availability.
- Low Season: Offer competitive pricing, special promotions (e.g., extended stay discounts), and flexible cancellation policies. Target off-season travelers like remote workers or budget-conscious guests.
- Shoulder Seasons: Implement dynamic pricing that balances peak and low rates. Target weekend travelers or specific events. Offer slightly more flexible terms than peak season.
- Regularly analyze your own performance against these Follonica seasonality benchmarks and adjust your pricing and availability strategy accordingly.
Best Areas for Airbnb Investment in Follonica (2025)
Exploring the top neighborhoods for short-term rentals in Follonica? This section highlights key areas, outlining why they are attractive for hosts and guests, along with notable local attractions. Consider these locations based on your target guest profile and investment strategy.
| Neighborhood / Area | Why Host Here? (Target Guests & Appeal) | Key Attractions & Landmarks |
|---|---|---|
| Follonica Beach | N/A | |
| Puntone | N/A | |
| Scarlino | N/A | |
| Cala Violina | N/A | |
| Parco Nazionale della Maremma | N/A | |
| Castiglione della Pescaia | N/A | |
| Punta Ala | N/A | |
| Piazza della Repubblica | N/A |
Understanding Airbnb License Requirements & STR Laws in Follonica (2025)
Yes, Follonica, Tuscany, Italy enforces high STR regulations. Obtaining a license and ensuring compliance is almost certainly required according to current 2025 STR laws. Always verify the latest short term rental regulations and Airbnb license requirements directly with local government authorities for Follonica to ensure full compliance before hosting.
(Source: AirROI data, 2025, based on 45% licensed listings)
Top Performing Airbnb Properties in Follonica (2025)
Benchmark your potential! Explore examples of top-performing Airbnb properties in Follonicabased on Trailing Twelve Month (TTM) revenue. Analyze their characteristics, revenue, occupancy rate, and ADR to understand what drives success in this market.
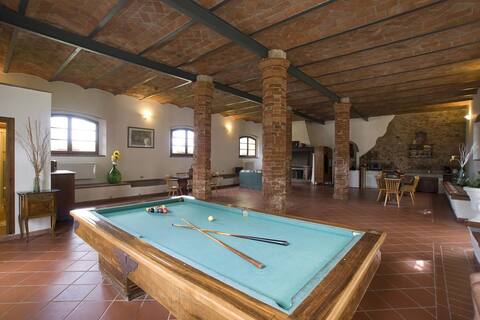
Follonica entero Casale with pool - sleeps 20
Entire Place • 7 bedrooms

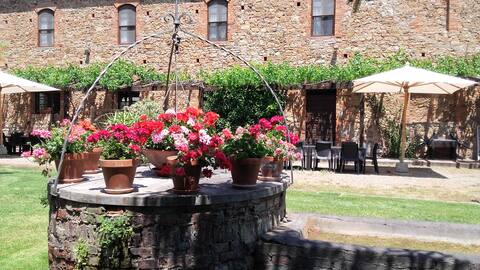
FARMHOUSE for 18 +2, pool, 3 km sea Follonica
Entire Place • 9 bedrooms

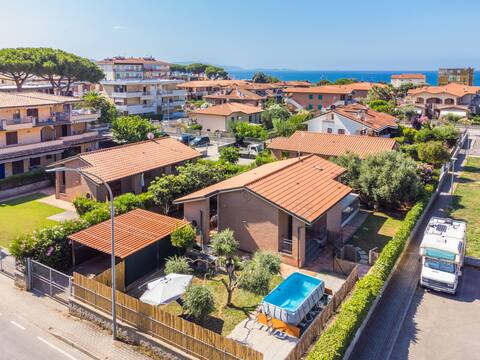
Beach House - Sleeps 7
Entire Place • 3 bedrooms

Campo Fiorito by Interhome
Entire Place • 4 bedrooms
Antico Podere with FOLLONICA POOL
Entire Place • 4 bedrooms
Dream House by Interhome
Entire Place • 4 bedrooms
Note: Performance varies based on location, size, amenities, seasonality, and management quality. Data reflects the past 12 months.
Top Performing Airbnb Hosts in Follonica (2025)
Learn from the best! This table showcases top-performing Airbnb hosts in Follonica based on the number of properties managed and estimated total revenue over the past year. Analyze their scale and performance metrics.
| Host Name | Properties | Grossing Revenue | Stay Reviews | Avg Rating |
|---|---|---|---|---|
| Alessandro | 4 | $164,392 | 101 | 4.71/5.0 |
| Alessandra | 10 | $162,991 | 24 | 1.28/5.0 |
| Alessia | 14 | $148,659 | 26 | 1.75/5.0 |
| Yvona ROCHER - | 1 | $74,026 | 10 | 4.90/5.0 |
| Michela | 15 | $73,194 | 13 | 0.97/5.0 |
| Giada | 3 | $70,441 | 36 | 4.55/5.0 |
| Jacopo | 5 | $66,570 | 261 | 4.80/5.0 |
| Roberta | 5 | $53,874 | 18 | 3.63/5.0 |
| Sandra - Interhome Group | 2 | $51,610 | 10 | 3.90/5.0 |
| Federica | 1 | $50,900 | 15 | 4.87/5.0 |
Analyzing the strategies of top hosts, such as their property selection, pricing, and guest communication, can offer valuable lessons for optimizing your own Airbnb operations in Follonica.
Dive Deeper: Advanced Follonica STR Market Data (2025)
Ready to unlock more insights? AirROI provides access to advanced metrics and comprehensive Airbnb data for Follonica. Explore detailed analytics beyond this report to refine your investment strategy, optimize pricing, and maximize your vacation rental profits.
Explore Advanced MetricsFollonica Short-Term Rental Market Composition (2025): Property & Room Types
Room Type Distribution
Property Type Distribution
Market Composition Insights for Follonica
- The Follonica Airbnb market composition is heavily skewed towards Entire Home/Apt listings, which make up 90.3% of the 298 active rentals. This indicates strong guest preference for privacy and space.
- Looking at the property type distribution in Follonica, Apartment/Condo properties are the most common (80.2%), reflecting the local real estate landscape.
- Houses represent a significant 16.8% portion, catering likely to families or larger groups.
- Smaller segments like hotel/boutique (combined 3.0%) offer potential for unique stay experiences.
Follonica Airbnb Room Capacity Analysis (2025): Bedroom Distribution
Distribution of Listings by Number of Bedrooms
Room Capacity Insights for Follonica
- The dominant room capacity in Follonica is 2 bedrooms listings, making up 47% of the market. This suggests a strong demand for properties suitable for couples or solo travelers.
- Together, 2 bedrooms and 1 bedroom properties represent 83.2% of the active Airbnb listings in Follonica, indicating a high concentration in these sizes.
- Listings with 3+ bedrooms (9.0%) represent a smaller niche, potentially indicating an underserved market for larger group accommodations in Follonica.
Follonica Vacation Rental Guest Capacity Trends (2025)
Distribution of Listings by Guest Capacity
Guest Capacity Insights for Follonica
- The most common guest capacity trend in Follonica vacation rentals is listings accommodating 4 guests (32.2%). This suggests the primary traveler segment is likely small families or groups.
- Properties designed for 4 guests and 5 guests dominate the Follonica STR market, accounting for 52.3% of listings.
- 24.8% of properties accommodate 6+ guests, serving the market segment for larger families or group travel in Follonica.
- On average, properties in Follonica are equipped to host 4.3 guests.
Follonica Airbnb Booking Patterns (2025): Available vs. Booked Days
Available Days Distribution
Booked Days Distribution
Booking Pattern Insights for Follonica
- The most common availability pattern in Follonica falls within the 271-366 days range, representing 71.5% of listings. This suggests many properties have significant open periods on their calendars.
- Approximately 95.7% of listings show high availability (181+ days open annually), indicating potential for increased bookings or specific owner usage patterns.
- For booked days, the 31-90 days range is most frequent in Follonica (41.9%), reflecting common guest stay durations or potential owner blocking patterns.
- A notable 6.0% of properties secure long booking periods (181+ days booked per year), highlighting successful long-term rental strategies or significant owner usage.
Follonica Airbnb Minimum Stay Requirements Analysis
Distribution of Listings by Minimum Night Requirement
1 Night
64 listings
25% of total
2 Nights
27 listings
10.5% of total
3 Nights
40 listings
15.6% of total
4-6 Nights
47 listings
18.4% of total
7-29 Nights
52 listings
20.3% of total
30+ Nights
26 listings
10.2% of total
Key Insights
- The most prevalent minimum stay requirement in Follonica is 1 Night, adopted by 25% of listings. This highlights the market's preference for shorter, flexible bookings.
- A significant segment (10.2%) caters to monthly stays (30+ nights) in Follonica, pointing to opportunities in the extended-stay market.
Recommendations
- Align with the market by considering a 1 Night minimum stay, as 25% of Follonica hosts use this setting.
- If feasible, allowing 1-night stays, especially midweek or during low season, could capture last-minute bookings, as only 25% currently do.
- Explore offering discounts for stays of 30+ nights to attract the 10.2% of the market seeking extended stays.
- Adjust minimum nights based on seasonality – potentially shorter during low season and longer during peak demand periods in Follonica.
Follonica Airbnb Cancellation Policy Trends Analysis (2025)
Super Strict 60 Days
4 listings
2% of total
Super Strict 30 Days
6 listings
2.9% of total
Flexible
51 listings
25% of total
Moderate
70 listings
34.3% of total
Strict
73 listings
35.8% of total
Cancellation Policy Insights for Follonica
- The prevailing Airbnb cancellation policy trend in Follonica is Strict, used by 35.8% of listings.
- There's a relatively balanced mix between guest-friendly (59.3%) and stricter (35.8%) policies, offering choices for different guest needs.
Recommendations for Hosts
- Consider adopting a Strict policy to align with the 35.8% market standard in Follonica.
- With 35.8% using Strict terms, this is a viable option in Follonica, particularly for high-value properties or during peak demand periods.
- Regularly review your cancellation policy against competitors and market demand shifts in Follonica.
Follonica STR Booking Lead Time Analysis (2025)
Average Booking Lead Time by Month
Booking Lead Time Insights for Follonica
- The overall average booking lead time for vacation rentals in Follonica is 56 days.
- Guests book furthest in advance for stays during July (average 112 days), likely coinciding with peak travel demand or local events.
- The shortest booking windows occur for stays in December (average 31 days), indicating more last-minute travel plans during this time.
- Seasonally, Summer (94 days avg.) sees the longest lead times, while Winter (37 days avg.) has the shortest, reflecting typical travel planning cycles.
Recommendations for Hosts
- Use the overall average lead time (56 days) as a baseline for your pricing and availability strategy in Follonica.
- For July stays, consider implementing length-of-stay discounts or slightly higher rates for bookings made less than 112 days out to capitalize on advance planning.
- Target marketing efforts for the Summer season well in advance (at least 94 days) to capture early planners.
- Monitor your own booking lead times against these Follonica averages to identify opportunities for dynamic pricing adjustments.
Popular & Essential Airbnb Amenities in Follonica (2025)
Amenity Prevalence
Amenity Insights for Follonica
- Essential amenities in Follonica that guests expect include: TV. Lacking these (this) could significantly impact bookings.
- Popular amenities like Kitchen, Hot water, Heating are common but not universal. Offering these can provide a competitive edge.
Recommendations for Hosts
- Ensure your listing includes all essential amenities for Follonica: TV.
- Prioritize adding missing essentials: TV.
- Consider adding popular differentiators like Kitchen or Hot water to increase appeal.
- Highlight unique or less common amenities you offer (e.g., hot tub, dedicated workspace, EV charger) in your listing description and photos.
- Regularly check competitor amenities in Follonica to stay competitive.
Follonica Airbnb Guest Demographics & Profile Analysis (2025)
Guest Profile Summary for Follonica
- The typical guest profile for Airbnb in Follonica consists of primarily domestic travelers (68%), often arriving from nearby Florence, typically belonging to the Post-2000s (Gen Z/Alpha) group (50%), primarily speaking English or Italian.
- Domestic travelers account for 67.5% of guests.
- Key international markets include Italy (67.5%) and Germany (7.6%).
- Top languages spoken are English (34%) followed by Italian (30.2%).
- A significant demographic segment is the Post-2000s (Gen Z/Alpha) group, representing 50% of guests.
Recommendations for Hosts
- Target domestic marketing efforts towards travelers from Florence and Turin.
- Tailor amenities and listing descriptions to appeal to the dominant Post-2000s (Gen Z/Alpha) demographic (e.g., highlight fast WiFi, smart home features, local guides).
- Highlight unique local experiences or amenities relevant to the primary guest profile.
- Consider seasonal promotions aligned with peak travel times for key origin markets.
Nearby Short-Term Rental Market Comparison
How does the Follonica Airbnb market stack up against its neighbors? Compare key performance metrics like average monthly revenue, ADR, and occupancy rates in surrounding areas to understand the broader regional STR landscape.
| Market | Active Properties | Monthly Revenue | Daily Rate | Avg. Occupancy |
|---|---|---|---|---|
| Crespina | 16 | $3,526 | $493.64 | 48% |
| Tignano | 10 | $3,391 | $500.31 | 36% |
| Buonconvento | 59 | $3,068 | $456.70 | 46% |
| Castelfranco di Sotto | 47 | $2,881 | $294.54 | 38% |
| Florence | 9,598 | $2,833 | $208.48 | 52% |
| Porto Cervo | 211 | $2,819 | $463.39 | 42% |
| Marcialla | 25 | $2,788 | $236.61 | 54% |
| Impruneta | 131 | $2,761 | $237.93 | 45% |
| Marciano della Chiana | 18 | $2,719 | $377.32 | 35% |
| Gaiole in Chianti | 206 | $2,679 | $344.49 | 39% |