Castelfranco di Sotto Airbnb Market Analysis 2025: Short Term Rental Data & Vacation Rental Statistics in Tuscany, Italy
Is Airbnb profitable in Castelfranco di Sotto in 2025? Explore comprehensive Airbnb analytics for Castelfranco di Sotto, Tuscany, Italy to uncover income potential. This 2025 STR market report for Castelfranco di Sotto, based on AirROI data from April 2024 to March 2025, reveals key trends in the niche market of 47 active listings.
Whether you're considering an Airbnb investment in Castelfranco di Sotto, optimizing your existing vacation rental, or exploring rental arbitrage opportunities, understanding the Castelfranco di Sotto Airbnb data is crucial. Navigating the high regulation landscape is key to maximizing your short term rental income potential. Let's dive into the specifics.
Key Castelfranco di Sotto Airbnb Performance Metrics Overview
Monthly Airbnb Revenue Variations & Income Potential in Castelfranco di Sotto (2025)
Understanding the monthly revenue variations for Airbnb listings in Castelfranco di Sotto is key to maximizing your short term rental income potential. Seasonality significantly impacts earnings. Our analysis, based on data from the past 12 months, shows that the peak revenue month for STRs in Castelfranco di Sotto is typically August, while March often presents the lowest earnings, highlighting opportunities for strategic pricing adjustments during shoulder and low seasons. Explore the typical Airbnb income in Castelfranco di Sotto across different performance tiers:
- Best-in-class properties (Top 10%) achieve $10,972+ monthly, often utilizing dynamic pricing and superior guest experiences.
- Strong performing properties (Top 25%) earn $4,665 or more, indicating effective management and desirable locations/amenities.
- Typical properties (Median) generate around $2,006 per month, representing the average market performance.
- Entry-level properties (Bottom 25%) see earnings around $869, often with potential for optimization.
Average Monthly Airbnb Earnings Trend in Castelfranco di Sotto
Castelfranco di Sotto Airbnb Occupancy Rate Trends (2025)
Maximize your bookings by understanding the Castelfranco di Sotto STR occupancy trends. Seasonal demand shifts significantly influence how often properties are booked. Typically, Augustsees the highest demand (peak season occupancy), while March experiences the lowest (low season). Effective strategies, like adjusting minimum stays or offering promotions, can boost occupancy during slower periods. Here's how different property tiers perform in Castelfranco di Sotto:
- Best-in-class properties (Top 10%) achieve 66%+ occupancy, indicating high desirability and potentially optimized availability.
- Strong performing properties (Top 25%) maintain 53% or higher occupancy, suggesting good market fit and guest satisfaction.
- Typical properties (Median) have an occupancy rate around 31%.
- Entry-level properties (Bottom 25%) average 16% occupancy, potentially facing higher vacancy.
Average Monthly Occupancy Rate Trend in Castelfranco di Sotto
Average Daily Rate (ADR) Airbnb Trends in Castelfranco di Sotto (2025)
Effective short term rental pricing strategy in Castelfranco di Sotto involves understanding monthly ADR fluctuations. The Average Daily Rate (ADR) for Airbnb in Castelfranco di Sotto typically peaks in August and dips lowest during March. Leveraging Airbnb dynamic pricing tools or strategies based on this seasonality can significantly boost revenue. Here's a look at the typical nightly rates achieved:
- Best-in-class properties (Top 10%) command rates of $688+ per night, often due to premium features or locations.
- Strong performing properties (Top 25%) achieve nightly rates of $368 or more.
- Typical properties (Median) charge around $217 per night.
- Entry-level properties (Bottom 25%) earn around $94 per night.
Average Daily Rate (ADR) Trend by Month in Castelfranco di Sotto
Get Live Castelfranco di Sotto Market Intelligence 👇

Explore Real-time Analytics
Airbnb Seasonality Analysis & Trends in Castelfranco di Sotto (2025)
Peak Season (August, July, June)
- Revenue averages $6,648 per month
- Occupancy rates average 53.5%
- Daily rates average $326
Shoulder Season
- Revenue averages $3,739 per month
- Occupancy maintains around 34.8%
- Daily rates hold near $298
Low Season (January, February, March)
- Revenue drops to average $1,286 per month
- Occupancy decreases to average 17.7%
- Daily rates adjust to average $271
Seasonality Insights for Castelfranco di Sotto
- The Airbnb seasonality in Castelfranco di Sotto shows highly seasonal trends requiring careful strategy. While the sections above show seasonal averages, it's also insightful to look at the extremes:
- During the high season, the absolute peak month showcases Castelfranco di Sotto's highest earning potential, with monthly revenues capable of climbing to $7,460, occupancy reaching a high of 66.9%, and ADRs peaking at $328.
- Conversely, the slowest single month of the year, typically falling within the low season, marks the market's lowest point. In this month, revenue might dip to $1,143, occupancy could drop to 16.1%, and ADRs may adjust down to $267.
- Understanding both the seasonal averages and these monthly peaks and troughs in revenue, occupancy, and ADR is crucial for maximizing your Airbnb profit potential in Castelfranco di Sotto.
Seasonal Strategies for Maximizing Profit
- Peak Season: Maximize revenue through premium pricing and potentially longer minimum stays. Ensure high availability.
- Low Season: Offer competitive pricing, special promotions (e.g., extended stay discounts), and flexible cancellation policies. Target off-season travelers like remote workers or budget-conscious guests.
- Shoulder Seasons: Implement dynamic pricing that balances peak and low rates. Target weekend travelers or specific events. Offer slightly more flexible terms than peak season.
- Regularly analyze your own performance against these Castelfranco di Sotto seasonality benchmarks and adjust your pricing and availability strategy accordingly.
Best Areas for Airbnb Investment in Castelfranco di Sotto (2025)
Exploring the top neighborhoods for short-term rentals in Castelfranco di Sotto? This section highlights key areas, outlining why they are attractive for hosts and guests, along with notable local attractions. Consider these locations based on your target guest profile and investment strategy.
| Neighborhood / Area | Why Host Here? (Target Guests & Appeal) | Key Attractions & Landmarks |
|---|---|---|
| Centro Storico | The historic center of Castelfranco di Sotto, known for its charming architecture, local shops, and authentic Tuscan atmosphere. Ideal for travelers who want to experience local culture and history. | Piazza dei Carabinieri, Chiesa di San Francesco, Museo della Storia di Castelfranco, Local markets, Traditional Tuscan restaurants |
| Parco della Rimembranza | A beautiful park area perfect for families and those looking for nature. Ideal for relaxing and enjoying the outdoors, attracting visitors during spring and summer. | Walking trails, Picnic areas, Playgrounds, Local flora, Community events |
| Fornacette | A quaint neighborhood with easy access to amenities and transportation. A great spot for those who want a quieter stay while being close to attractions. | Local cafes, Shopping areas, Public transport access, Nearby vineyards, Scenic views |
| San Pierino | A lively area with a mix of local culture and suburban charm. Attracts families and those looking for a home-like atmosphere while visiting Tuscany. | Local markets, Parks, Community events, Nearby wine tastings, Family-friendly restaurants |
| Bello Puccini | A residential area close to the center, known for its friendly locals and local dining options. Great for visitors wanting a more immersive experience. | Local bakeries, Florentine-style architecture, Easy access to main roads, Traditional taverns, Artisan shops |
| Cerreto Guidi | A nearby town known for its historical significance and scenic beauty. It attracts history buffs and nature lovers looking for a tranquil getaway. | Palazzo Medici, Parco di Serravalle, Museo della Vite e del Vino, Local wineries, Scenic countryside |
| Santa Croce sull'Arno | Close to Castelfranco, this area is known for its textile industry and rich history. Attracts visitors interested in industrial heritage and local craftsmanship. | Historical museums, Artisan workshops, Textile exhibitions, Local markets, Riverside views |
| Montopoli In Val d'Arno | A charming village with stunning views of the Arno Valley. Great for travelers looking for picturesque landscapes and outdoor activities. | Castello dei Vicari, Church of San Giovanni Battista, Hiking trails, Rural tourism, Local festivals |
Understanding Airbnb License Requirements & STR Laws in Castelfranco di Sotto (2025)
Yes, Castelfranco di Sotto, Tuscany, Italy enforces high STR regulations. Obtaining a license and ensuring compliance is almost certainly required according to current 2025 STR laws. Always verify the latest short term rental regulations and Airbnb license requirements directly with local government authorities for Castelfranco di Sotto to ensure full compliance before hosting.
(Source: AirROI data, 2025, based on 74% licensed listings)
Top Performing Airbnb Properties in Castelfranco di Sotto (2025)
Benchmark your potential! Explore examples of top-performing Airbnb properties in Castelfranco di Sottobased on Trailing Twelve Month (TTM) revenue. Analyze their characteristics, revenue, occupancy rate, and ADR to understand what drives success in this market.
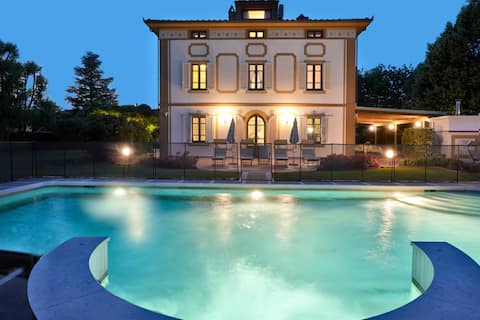
Villa Colombai Pool, Tennis, Pickleball and Chef
Entire Place • 6 bedrooms
Entire Place • 6 bedrooms
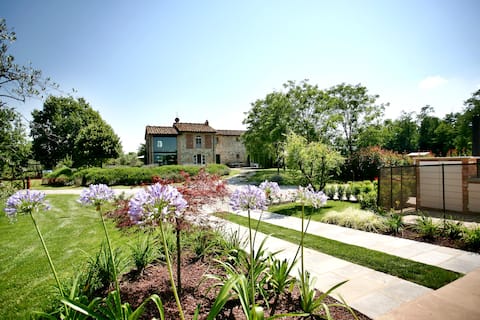
Villa Montefalcone: Charm, Private Pool, and Chef
Entire Place • 5 bedrooms
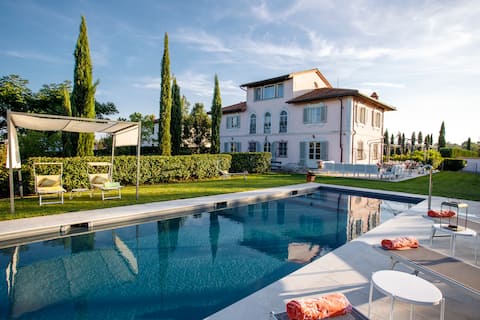
Il Conte Luxury Tuscany 3 bedrooms Farmhouse Villa
Entire Place • 3 bedrooms
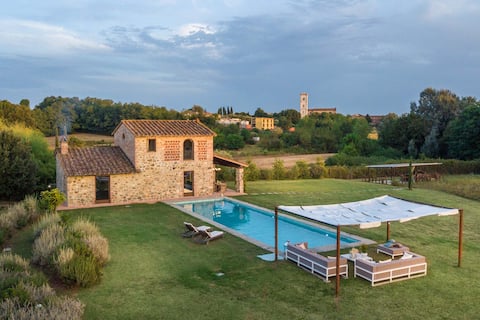
Villa Otto Luxury Tuscan Farmhouse with Private Po
Entire Place • 4 bedrooms
Villa Drago, an authentic Farmhouse with Private P
Entire Place • 4 bedrooms
Note: Performance varies based on location, size, amenities, seasonality, and management quality. Data reflects the past 12 months.
Top Performing Airbnb Hosts in Castelfranco di Sotto (2025)
Learn from the best! This table showcases top-performing Airbnb hosts in Castelfranco di Sotto based on the number of properties managed and estimated total revenue over the past year. Analyze their scale and performance metrics.
| Host Name | Properties | Grossing Revenue | Stay Reviews | Avg Rating |
|---|---|---|---|---|
| Lucca Apartments And Villas S. | 4 | $332,962 | 52 | 3.57/5.0 |
| Stefano | 2 | $298,410 | 155 | 4.98/5.0 |
| Franco | 3 | $158,450 | 204 | 4.96/5.0 |
| Guglielmo | 1 | $131,960 | 14 | 5.00/5.0 |
| Novasol | 3 | $97,447 | 20 | 4.81/5.0 |
| Host #159971383 | 1 | $86,195 | 0 | 0.00/5.0 |
| Lorenzo | 1 | $67,067 | 33 | 4.94/5.0 |
| Elisabetta | 4 | $52,537 | 96 | 4.82/5.0 |
| Giuseppina | 1 | $52,476 | 30 | 4.87/5.0 |
| Birgit - Interhome Group | 3 | $42,183 | 29 | 4.36/5.0 |
Analyzing the strategies of top hosts, such as their property selection, pricing, and guest communication, can offer valuable lessons for optimizing your own Airbnb operations in Castelfranco di Sotto.
Dive Deeper: Advanced Castelfranco di Sotto STR Market Data (2025)
Ready to unlock more insights? AirROI provides access to advanced metrics and comprehensive Airbnb data for Castelfranco di Sotto. Explore detailed analytics beyond this report to refine your investment strategy, optimize pricing, and maximize your vacation rental profits.
Explore Advanced MetricsCastelfranco di Sotto Short-Term Rental Market Composition (2025): Property & Room Types
Room Type Distribution
Property Type Distribution
Market Composition Insights for Castelfranco di Sotto
- The Castelfranco di Sotto Airbnb market composition is heavily skewed towards Entire Home/Apt listings, which make up 89.4% of the 47 active rentals. This indicates strong guest preference for privacy and space.
- Looking at the property type distribution in Castelfranco di Sotto, House properties are the most common (59.6%), reflecting the local real estate landscape.
- Houses represent a significant 59.6% portion, catering likely to families or larger groups.
- The presence of 10.6% Hotel/Boutique listings indicates integration with traditional hospitality.
- Smaller segments like unique stays (combined 2.1%) offer potential for unique stay experiences.
Castelfranco di Sotto Airbnb Room Capacity Analysis (2025): Bedroom Distribution
Distribution of Listings by Number of Bedrooms
Room Capacity Insights for Castelfranco di Sotto
- The dominant room capacity in Castelfranco di Sotto is 2 bedrooms listings, making up 25.5% of the market. This suggests a strong demand for properties suitable for couples or solo travelers.
- Together, 2 bedrooms and 5+ bedrooms properties represent 44.6% of the active Airbnb listings in Castelfranco di Sotto, indicating a high concentration in these sizes.
- A significant 51.0% of listings offer 3+ bedrooms, catering to larger groups and families seeking more space in Castelfranco di Sotto.
Castelfranco di Sotto Vacation Rental Guest Capacity Trends (2025)
Distribution of Listings by Guest Capacity
Guest Capacity Insights for Castelfranco di Sotto
- The most common guest capacity trend in Castelfranco di Sotto vacation rentals is listings accommodating 8+ guests (42.6%). This suggests the primary traveler segment is likely larger groups.
- Properties designed for 8+ guests and 4 guests dominate the Castelfranco di Sotto STR market, accounting for 63.9% of listings.
- 59.6% of properties accommodate 6+ guests, serving the market segment for larger families or group travel in Castelfranco di Sotto.
- On average, properties in Castelfranco di Sotto are equipped to host 5.8 guests.
Castelfranco di Sotto Airbnb Booking Patterns (2025): Available vs. Booked Days
Available Days Distribution
Booked Days Distribution
Booking Pattern Insights for Castelfranco di Sotto
- The most common availability pattern in Castelfranco di Sotto falls within the 181-270 days range, representing 51.1% of listings. This suggests many properties have significant open periods on their calendars.
- Approximately 89.4% of listings show high availability (181+ days open annually), indicating potential for increased bookings or specific owner usage patterns.
- For booked days, the 91-180 days range is most frequent in Castelfranco di Sotto (51.1%), reflecting common guest stay durations or potential owner blocking patterns.
- A notable 12.8% of properties secure long booking periods (181+ days booked per year), highlighting successful long-term rental strategies or significant owner usage.
Castelfranco di Sotto Airbnb Minimum Stay Requirements Analysis
Distribution of Listings by Minimum Night Requirement
1 Night
10 listings
22.2% of total
2 Nights
5 listings
11.1% of total
3 Nights
9 listings
20% of total
4-6 Nights
4 listings
8.9% of total
7-29 Nights
3 listings
6.7% of total
30+ Nights
14 listings
31.1% of total
Key Insights
- The most prevalent minimum stay requirement in Castelfranco di Sotto is 30+ Nights, adopted by 31.1% of listings. This highlights the market's preference for longer commitments.
- A significant segment (31.1%) caters to monthly stays (30+ nights) in Castelfranco di Sotto, pointing to opportunities in the extended-stay market.
Recommendations
- Align with the market by considering a 30+ Nights minimum stay, as 31.1% of Castelfranco di Sotto hosts use this setting.
- If feasible, allowing 1-night stays, especially midweek or during low season, could capture last-minute bookings, as only 22.2% currently do.
- Explore offering discounts for stays of 30+ nights to attract the 31.1% of the market seeking extended stays.
- Adjust minimum nights based on seasonality – potentially shorter during low season and longer during peak demand periods in Castelfranco di Sotto.
Castelfranco di Sotto Airbnb Cancellation Policy Trends Analysis (2025)
Super Strict 60 Days
7 listings
17.1% of total
Super Strict 30 Days
8 listings
19.5% of total
Flexible
7 listings
17.1% of total
Moderate
10 listings
24.4% of total
Strict
9 listings
22% of total
Cancellation Policy Insights for Castelfranco di Sotto
- The prevailing Airbnb cancellation policy trend in Castelfranco di Sotto is Moderate, used by 24.4% of listings.
- There's a relatively balanced mix between guest-friendly (41.5%) and stricter (22.0%) policies, offering choices for different guest needs.
Recommendations for Hosts
- Consider adopting a Moderate policy to align with the 24.4% market standard in Castelfranco di Sotto.
- Regularly review your cancellation policy against competitors and market demand shifts in Castelfranco di Sotto.
Castelfranco di Sotto STR Booking Lead Time Analysis (2025)
Average Booking Lead Time by Month
Booking Lead Time Insights for Castelfranco di Sotto
- The overall average booking lead time for vacation rentals in Castelfranco di Sotto is 99 days.
- Guests book furthest in advance for stays during May (average 128 days), likely coinciding with peak travel demand or local events.
- The shortest booking windows occur for stays in February (average 16 days), indicating more last-minute travel plans during this time.
- Seasonally, Summer (121 days avg.) sees the longest lead times, while Winter (33 days avg.) has the shortest, reflecting typical travel planning cycles.
Recommendations for Hosts
- Use the overall average lead time (99 days) as a baseline for your pricing and availability strategy in Castelfranco di Sotto.
- For May stays, consider implementing length-of-stay discounts or slightly higher rates for bookings made less than 128 days out to capitalize on advance planning.
- Target marketing efforts for the Summer season well in advance (at least 121 days) to capture early planners.
- Monitor your own booking lead times against these Castelfranco di Sotto averages to identify opportunities for dynamic pricing adjustments.
Popular & Essential Airbnb Amenities in Castelfranco di Sotto (2025)
Amenity Prevalence
Amenity Insights for Castelfranco di Sotto
- Essential amenities in Castelfranco di Sotto that guests expect include: Kitchen, Free parking on premises, Wifi, Heating. Lacking these (any) could significantly impact bookings.
- Popular amenities like TV, Refrigerator, Dishes and silverware are common but not universal. Offering these can provide a competitive edge.
Recommendations for Hosts
- Ensure your listing includes all essential amenities for Castelfranco di Sotto: Kitchen, Free parking on premises, Wifi, Heating.
- Prioritize adding missing essentials: Wifi, Heating.
- Consider adding popular differentiators like TV or Refrigerator to increase appeal.
- Highlight unique or less common amenities you offer (e.g., hot tub, dedicated workspace, EV charger) in your listing description and photos.
- Regularly check competitor amenities in Castelfranco di Sotto to stay competitive.
Castelfranco di Sotto Airbnb Guest Demographics & Profile Analysis (2025)
Guest Profile Summary for Castelfranco di Sotto
- The typical guest profile for Airbnb in Castelfranco di Sotto consists of predominantly international visitors (84%), with top international origins including Italy, typically belonging to the Post-2000s (Gen Z/Alpha) group (50%), primarily speaking English or French.
- Domestic travelers account for 15.6% of guests.
- Key international markets include France (17.3%) and Italy (15.6%).
- Top languages spoken are English (39%) followed by French (11.8%).
- A significant demographic segment is the Post-2000s (Gen Z/Alpha) group, representing 50% of guests.
Recommendations for Hosts
- Focus marketing internationally, particularly towards travelers from Italy.
- Tailor amenities and listing descriptions to appeal to the dominant Post-2000s (Gen Z/Alpha) demographic (e.g., highlight fast WiFi, smart home features, local guides).
- Highlight unique local experiences or amenities relevant to the primary guest profile.
- Consider seasonal promotions aligned with peak travel times for key origin markets.
Nearby Short-Term Rental Market Comparison
How does the Castelfranco di Sotto Airbnb market stack up against its neighbors? Compare key performance metrics like average monthly revenue, ADR, and occupancy rates in surrounding areas to understand the broader regional STR landscape.
| Market | Active Properties | Monthly Revenue | Daily Rate | Avg. Occupancy |
|---|---|---|---|---|
| Portofino | 68 | $4,086 | $454.35 | 44% |
| Crespina | 16 | $3,526 | $493.64 | 48% |
| Tignano | 10 | $3,391 | $500.31 | 36% |
| Luni Mare | 11 | $3,102 | $169.59 | 40% |
| Buonconvento | 59 | $3,068 | $456.70 | 46% |
| Monterosso al Mare | 350 | $2,958 | $248.25 | 57% |
| Florence | 9,598 | $2,833 | $208.48 | 52% |
| Riomaggiore | 640 | $2,789 | $196.57 | 57% |
| Marcialla | 25 | $2,788 | $236.61 | 54% |
| Impruneta | 131 | $2,761 | $237.93 | 45% |