Capraia Isola Airbnb Market Analysis 2025: Short Term Rental Data & Vacation Rental Statistics in Tuscany, Italy
Is Airbnb profitable in Capraia Isola in 2025? Explore comprehensive Airbnb analytics for Capraia Isola, Tuscany, Italy to uncover income potential. This 2025 STR market report for Capraia Isola, based on AirROI data from April 2024 to March 2025, reveals key trends in the niche market of 30 active listings.
Whether you're considering an Airbnb investment in Capraia Isola, optimizing your existing vacation rental, or exploring rental arbitrage opportunities, understanding the Capraia Isola Airbnb data is crucial. Navigating the high regulation landscape is key to maximizing your short term rental income potential. Let's dive into the specifics.
Key Capraia Isola Airbnb Performance Metrics Overview
Monthly Airbnb Revenue Variations & Income Potential in Capraia Isola (2025)
Understanding the monthly revenue variations for Airbnb listings in Capraia Isola is key to maximizing your short term rental income potential. Seasonality significantly impacts earnings. Our analysis, based on data from the past 12 months, shows that the peak revenue month for STRs in Capraia Isola is typically August, while January often presents the lowest earnings, highlighting opportunities for strategic pricing adjustments during shoulder and low seasons. Explore the typical Airbnb income in Capraia Isola across different performance tiers:
- Best-in-class properties (Top 10%) achieve $2,555+ monthly, often utilizing dynamic pricing and superior guest experiences.
- Strong performing properties (Top 25%) earn $1,688 or more, indicating effective management and desirable locations/amenities.
- Typical properties (Median) generate around $1,112 per month, representing the average market performance.
- Entry-level properties (Bottom 25%) see earnings around $711, often with potential for optimization.
Average Monthly Airbnb Earnings Trend in Capraia Isola
Capraia Isola Airbnb Occupancy Rate Trends (2025)
Maximize your bookings by understanding the Capraia Isola STR occupancy trends. Seasonal demand shifts significantly influence how often properties are booked. Typically, Augustsees the highest demand (peak season occupancy), while January experiences the lowest (low season). Effective strategies, like adjusting minimum stays or offering promotions, can boost occupancy during slower periods. Here's how different property tiers perform in Capraia Isola:
- Best-in-class properties (Top 10%) achieve 63%+ occupancy, indicating high desirability and potentially optimized availability.
- Strong performing properties (Top 25%) maintain 51% or higher occupancy, suggesting good market fit and guest satisfaction.
- Typical properties (Median) have an occupancy rate around 32%.
- Entry-level properties (Bottom 25%) average 19% occupancy, potentially facing higher vacancy.
Average Monthly Occupancy Rate Trend in Capraia Isola
Average Daily Rate (ADR) Airbnb Trends in Capraia Isola (2025)
Effective short term rental pricing strategy in Capraia Isola involves understanding monthly ADR fluctuations. The Average Daily Rate (ADR) for Airbnb in Capraia Isola typically peaks in August and dips lowest during November. Leveraging Airbnb dynamic pricing tools or strategies based on this seasonality can significantly boost revenue. Here's a look at the typical nightly rates achieved:
- Best-in-class properties (Top 10%) command rates of $191+ per night, often due to premium features or locations.
- Strong performing properties (Top 25%) achieve nightly rates of $142 or more.
- Typical properties (Median) charge around $114 per night.
- Entry-level properties (Bottom 25%) earn around $91 per night.
Average Daily Rate (ADR) Trend by Month in Capraia Isola
Get Live Capraia Isola Market Intelligence 👇

Explore Real-time Analytics
Airbnb Seasonality Analysis & Trends in Capraia Isola (2025)
Peak Season (August, July, June)
- Revenue averages $2,352 per month
- Occupancy rates average 59.5%
- Daily rates average $133
Shoulder Season
- Revenue averages $1,175 per month
- Occupancy maintains around 32.5%
- Daily rates hold near $123
Low Season (January, February, November)
- Revenue drops to average $518 per month
- Occupancy decreases to average 16.5%
- Daily rates adjust to average $116
Seasonality Insights for Capraia Isola
- The Airbnb seasonality in Capraia Isola shows highly seasonal trends requiring careful strategy. While the sections above show seasonal averages, it's also insightful to look at the extremes:
- During the high season, the absolute peak month showcases Capraia Isola's highest earning potential, with monthly revenues capable of climbing to $2,862, occupancy reaching a high of 71.3%, and ADRs peaking at $136.
- Conversely, the slowest single month of the year, typically falling within the low season, marks the market's lowest point. In this month, revenue might dip to $416, occupancy could drop to 10.9%, and ADRs may adjust down to $108.
- Understanding both the seasonal averages and these monthly peaks and troughs in revenue, occupancy, and ADR is crucial for maximizing your Airbnb profit potential in Capraia Isola.
Seasonal Strategies for Maximizing Profit
- Peak Season: Maximize revenue through premium pricing and potentially longer minimum stays. Ensure high availability.
- Low Season: Offer competitive pricing, special promotions (e.g., extended stay discounts), and flexible cancellation policies. Target off-season travelers like remote workers or budget-conscious guests.
- Shoulder Seasons: Implement dynamic pricing that balances peak and low rates. Target weekend travelers or specific events. Offer slightly more flexible terms than peak season.
- Regularly analyze your own performance against these Capraia Isola seasonality benchmarks and adjust your pricing and availability strategy accordingly.
Best Areas for Airbnb Investment in Capraia Isola (2025)
Exploring the top neighborhoods for short-term rentals in Capraia Isola? This section highlights key areas, outlining why they are attractive for hosts and guests, along with notable local attractions. Consider these locations based on your target guest profile and investment strategy.
| Neighborhood / Area | Why Host Here? (Target Guests & Appeal) | Key Attractions & Landmarks |
|---|---|---|
| Portoferraio | Main town of Elba Island known for its stunning harbor and historical significance. Attracts both beachgoers and history buffs. | Medici Fortress, Napoleon's Villa, The Old Town, Beaches of Portoferraio, Museo Nazionale della Resistenza |
| Capraia Town | The island's main settlement, offering a unique blend of natural beauty and history. Ideal for tourists looking to explore the island and its surroundings. | Capraia Island Natural Park, The Abbey of San Federigo, Scenic hiking trails, Local seafood restaurants |
| Punta di Capraia | A scenic viewpoint offering breathtaking views of the surrounding sea and coastline. Popular among nature lovers and photographers. | Breathtaking Sea Views, Hiking Trails, Snorkeling spots, Wildlife Watching |
| Cala Rossa | Famous for its red rocks and clear waters, Cala Rossa is a popular spot for sunbathing and swimming. | Cala Rossa Beach, Rock Formations, Snorkeling, Secluded Swimming Spots |
| Cala dei Maronti | A beautiful bay known for its crystal clear waters and excellent swimming conditions. Perfect for families and beach lovers. | Sandy Beach, Water Sports, Nearby Restaurants, Shaded Areas for Relaxation |
| Torre della Pelosa | Iconic tower located near beautiful beaches, offering historical significance and stunning scenery. | Historical Tower, Stunning Beaches, Panoramic Views, Walking Trails |
| San Francesco Beach | A tranquil beach that's perfect for relaxing and enjoying the sun. Popular with families and those looking for a quieter experience. | Clear Waters, Secluded Environment, Beachside Cafés, Sunbathing Spots |
| Il Rio | A charming area known for its calm waters and beautiful landscapes. Great for those seeking a peaceful getaway. | Natural Beauty, Calm Waters, Picnic Areas, Walking Trails |
Understanding Airbnb License Requirements & STR Laws in Capraia Isola (2025)
Yes, Capraia Isola, Tuscany, Italy enforces high STR regulations. Obtaining a license and ensuring compliance is almost certainly required according to current 2025 STR laws. Always verify the latest short term rental regulations and Airbnb license requirements directly with local government authorities for Capraia Isola to ensure full compliance before hosting.
(Source: AirROI data, 2025, based on 63% licensed listings)
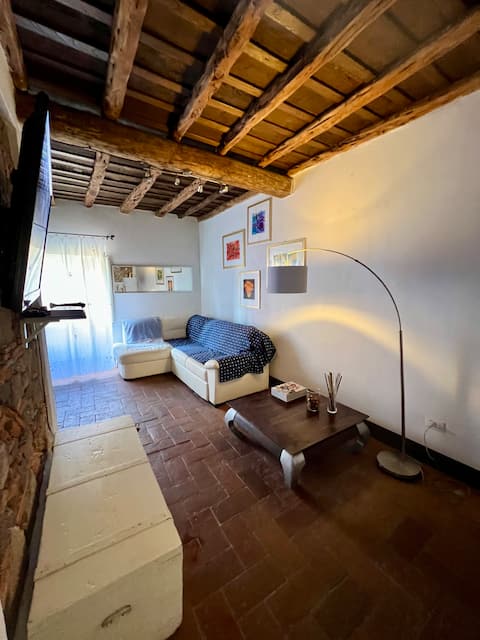
Top Performing Airbnb Properties in Capraia Isola (2025)
Benchmark your potential! Explore examples of top-performing Airbnb properties in Capraia Isolabased on Trailing Twelve Month (TTM) revenue. Analyze their characteristics, revenue, occupancy rate, and ADR to understand what drives success in this market.

"Casa del Rosmarino" Capraia
Entire Place • 1 bedroom
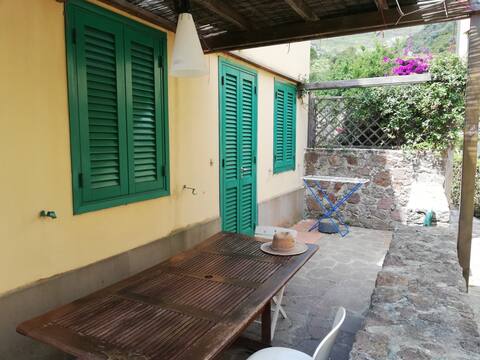
Charming House Casa Carlo Alberto Capraia Island
Entire Place • 1 bedroom
FEATURE CASA ISLA CAPRAIA
Entire Place • 2 bedrooms
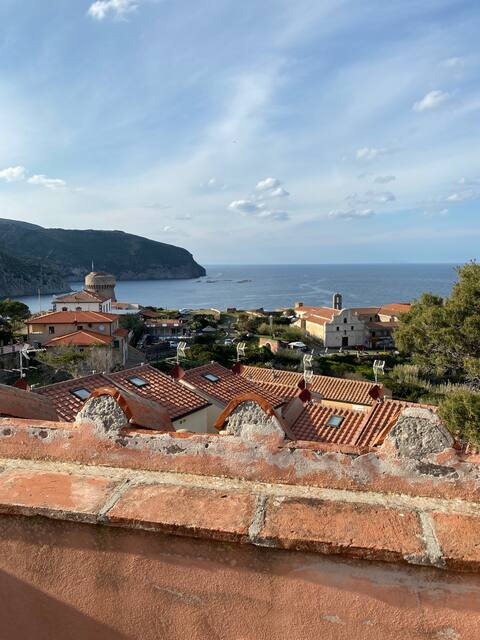
Casa di Mia.Capraia Isola
Entire Place • 2 bedrooms
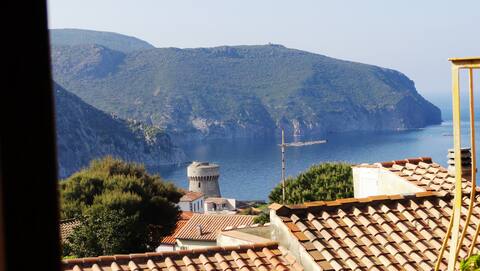
TWO-ROOM APARTMENT WITH SEA VIEW CAPRAIA EAST
Entire Place • 1 bedroom

Studio apartment with a view!
Entire Place • N/A
Note: Performance varies based on location, size, amenities, seasonality, and management quality. Data reflects the past 12 months.
Top Performing Airbnb Hosts in Capraia Isola (2025)
Learn from the best! This table showcases top-performing Airbnb hosts in Capraia Isola based on the number of properties managed and estimated total revenue over the past year. Analyze their scale and performance metrics.
| Host Name | Properties | Grossing Revenue | Stay Reviews | Avg Rating |
|---|---|---|---|---|
| Olivia | 4 | $48,727 | 206 | 4.69/5.0 |
| Giorgia | 1 | $34,326 | 21 | 4.71/5.0 |
| Vittorio | 2 | $29,875 | 56 | 4.58/5.0 |
| Cristina | 2 | $25,644 | 185 | 4.62/5.0 |
| Ginevra Louise | 1 | $18,057 | 27 | 4.74/5.0 |
| Margherita | 1 | $17,842 | 14 | 4.86/5.0 |
| Furio | 1 | $17,528 | 16 | 4.75/5.0 |
| Eros | 1 | $15,682 | 68 | 4.91/5.0 |
| Daniele | 1 | $15,204 | 97 | 4.93/5.0 |
| Flavio | 1 | $14,211 | 42 | 4.71/5.0 |
Analyzing the strategies of top hosts, such as their property selection, pricing, and guest communication, can offer valuable lessons for optimizing your own Airbnb operations in Capraia Isola.
Dive Deeper: Advanced Capraia Isola STR Market Data (2025)
Ready to unlock more insights? AirROI provides access to advanced metrics and comprehensive Airbnb data for Capraia Isola. Explore detailed analytics beyond this report to refine your investment strategy, optimize pricing, and maximize your vacation rental profits.
Explore Advanced MetricsCapraia Isola Short-Term Rental Market Composition (2025): Property & Room Types
Room Type Distribution
Property Type Distribution
Market Composition Insights for Capraia Isola
- The Capraia Isola Airbnb market composition is heavily skewed towards Entire Home/Apt listings, which make up 96.7% of the 30 active rentals. This indicates strong guest preference for privacy and space.
- Looking at the property type distribution in Capraia Isola, Apartment/Condo properties are the most common (63.3%), reflecting the local real estate landscape.
- Houses represent a significant 36.7% portion, catering likely to families or larger groups.
Capraia Isola Airbnb Room Capacity Analysis (2025): Bedroom Distribution
Distribution of Listings by Number of Bedrooms
Room Capacity Insights for Capraia Isola
- The dominant room capacity in Capraia Isola is 1 bedroom listings, making up 56.7% of the market. This suggests a strong demand for properties suitable for couples or solo travelers.
- Together, 1 bedroom and 2 bedrooms properties represent 90.0% of the active Airbnb listings in Capraia Isola, indicating a high concentration in these sizes.
- With over half the market (56.7%) consisting of studios or 1-bedroom units, Capraia Isola is particularly well-suited for individuals or couples.
Capraia Isola Vacation Rental Guest Capacity Trends (2025)
Distribution of Listings by Guest Capacity
Guest Capacity Insights for Capraia Isola
- The most common guest capacity trend in Capraia Isola vacation rentals is listings accommodating 4 guests (30%). This suggests the primary traveler segment is likely small families or groups.
- Properties designed for 4 guests and 2 guests dominate the Capraia Isola STR market, accounting for 56.7% of listings.
- 20.0% of properties accommodate 6+ guests, serving the market segment for larger families or group travel in Capraia Isola.
- On average, properties in Capraia Isola are equipped to host 3.9 guests.
Capraia Isola Airbnb Booking Patterns (2025): Available vs. Booked Days
Available Days Distribution
Booked Days Distribution
Booking Pattern Insights for Capraia Isola
- The most common availability pattern in Capraia Isola falls within the 181-270 days range, representing 53.3% of listings. This suggests many properties have significant open periods on their calendars.
- Approximately 96.6% of listings show high availability (181+ days open annually), indicating potential for increased bookings or specific owner usage patterns.
- For booked days, the 91-180 days range is most frequent in Capraia Isola (53.3%), reflecting common guest stay durations or potential owner blocking patterns.
- A notable 3.3% of properties secure long booking periods (181+ days booked per year), highlighting successful long-term rental strategies or significant owner usage.
Capraia Isola Airbnb Minimum Stay Requirements Analysis
Distribution of Listings by Minimum Night Requirement
1 Night
3 listings
10.3% of total
2 Nights
9 listings
31% of total
3 Nights
12 listings
41.4% of total
4-6 Nights
2 listings
6.9% of total
7-29 Nights
3 listings
10.3% of total
Key Insights
- The most prevalent minimum stay requirement in Capraia Isola is 3 Nights, adopted by 41.4% of listings. This highlights the market's preference for longer commitments.
Recommendations
- Align with the market by considering a 3 Nights minimum stay, as 41.4% of Capraia Isola hosts use this setting.
- If feasible, allowing 1-night stays, especially midweek or during low season, could capture last-minute bookings, as only 10.3% currently do.
- A 2-night minimum appears standard (31%). Consider this for weekends or peak periods.
- Adjust minimum nights based on seasonality – potentially shorter during low season and longer during peak demand periods in Capraia Isola.
Capraia Isola Airbnb Cancellation Policy Trends Analysis (2025)
Flexible
2 listings
8% of total
Moderate
14 listings
56% of total
Strict
9 listings
36% of total
Cancellation Policy Insights for Capraia Isola
- The prevailing Airbnb cancellation policy trend in Capraia Isola is Moderate, used by 56% of listings.
- There's a relatively balanced mix between guest-friendly (64.0%) and stricter (36.0%) policies, offering choices for different guest needs.
Recommendations for Hosts
- Consider adopting a Moderate policy to align with the 56% market standard in Capraia Isola.
- With 36% using Strict terms, this is a viable option in Capraia Isola, particularly for high-value properties or during peak demand periods.
- Regularly review your cancellation policy against competitors and market demand shifts in Capraia Isola.
Capraia Isola STR Booking Lead Time Analysis (2025)
Average Booking Lead Time by Month
Booking Lead Time Insights for Capraia Isola
- The overall average booking lead time for vacation rentals in Capraia Isola is 74 days.
- Guests book furthest in advance for stays during May (average 110 days), likely coinciding with peak travel demand or local events.
- The shortest booking windows occur for stays in February (average 4 days), indicating more last-minute travel plans during this time.
- Seasonally, Summer (84 days avg.) sees the longest lead times, while Winter (17 days avg.) has the shortest, reflecting typical travel planning cycles.
Recommendations for Hosts
- Use the overall average lead time (74 days) as a baseline for your pricing and availability strategy in Capraia Isola.
- For May stays, consider implementing length-of-stay discounts or slightly higher rates for bookings made less than 110 days out to capitalize on advance planning.
- During February, focus on last-minute booking availability and promotions, as guests book with very short notice (4 days avg.).
- Target marketing efforts for the Summer season well in advance (at least 84 days) to capture early planners.
- Monitor your own booking lead times against these Capraia Isola averages to identify opportunities for dynamic pricing adjustments.
Popular & Essential Airbnb Amenities in Capraia Isola (2025)
Amenity Prevalence
Amenity Insights for Capraia Isola
- Essential amenities in Capraia Isola that guests expect include: Kitchen. Lacking these (this) could significantly impact bookings.
- Popular amenities like Dishes and silverware, Refrigerator, Hangers are common but not universal. Offering these can provide a competitive edge.
Recommendations for Hosts
- Ensure your listing includes all essential amenities for Capraia Isola: Kitchen.
- Prioritize adding missing essentials: Kitchen.
- Consider adding popular differentiators like Dishes and silverware or Refrigerator to increase appeal.
- Highlight unique or less common amenities you offer (e.g., hot tub, dedicated workspace, EV charger) in your listing description and photos.
- Regularly check competitor amenities in Capraia Isola to stay competitive.
Capraia Isola Airbnb Guest Demographics & Profile Analysis (2025)
Guest Profile Summary for Capraia Isola
- The typical guest profile for Airbnb in Capraia Isola consists of primarily domestic travelers (80%), often arriving from nearby Milan, typically belonging to the Post-2000s (Gen Z/Alpha) group (50%), primarily speaking English or Italian.
- Domestic travelers account for 80.4% of guests.
- Key international markets include Italy (80.4%) and United States (6.1%).
- Top languages spoken are English (37.6%) followed by Italian (27.6%).
- A significant demographic segment is the Post-2000s (Gen Z/Alpha) group, representing 50% of guests.
Recommendations for Hosts
- Target domestic marketing efforts towards travelers from Milan and Livorno.
- Tailor amenities and listing descriptions to appeal to the dominant Post-2000s (Gen Z/Alpha) demographic (e.g., highlight fast WiFi, smart home features, local guides).
- Highlight unique local experiences or amenities relevant to the primary guest profile.
- Consider seasonal promotions aligned with peak travel times for key origin markets.
Nearby Short-Term Rental Market Comparison
How does the Capraia Isola Airbnb market stack up against its neighbors? Compare key performance metrics like average monthly revenue, ADR, and occupancy rates in surrounding areas to understand the broader regional STR landscape.
| Market | Active Properties | Monthly Revenue | Daily Rate | Avg. Occupancy |
|---|---|---|---|---|
| Portofino | 68 | $4,086 | $454.35 | 44% |
| Cossano Belbo | 13 | $3,632 | $284.21 | 42% |
| Crespina | 16 | $3,526 | $493.64 | 48% |
| Cassinasco | 18 | $3,219 | $545.40 | 41% |
| Luni Mare | 11 | $3,102 | $169.59 | 40% |
| Monterosso al Mare | 350 | $2,958 | $248.25 | 57% |
| Castelfranco di Sotto | 47 | $2,881 | $294.54 | 38% |
| Riomaggiore | 640 | $2,789 | $196.57 | 57% |
| Mombercelli | 11 | $2,631 | $270.29 | 41% |
| Vernazza | 456 | $2,597 | $202.26 | 53% |