Capalbio Airbnb Market Analysis 2025: Short Term Rental Data & Vacation Rental Statistics in Tuscany, Italy
Is Airbnb profitable in Capalbio in 2025? Explore comprehensive Airbnb analytics for Capalbio, Tuscany, Italy to uncover income potential. This 2025 STR market report for Capalbio, based on AirROI data from April 2024 to March 2025, reveals key trends in the niche market of 93 active listings.
Whether you're considering an Airbnb investment in Capalbio, optimizing your existing vacation rental, or exploring rental arbitrage opportunities, understanding the Capalbio Airbnb data is crucial. Navigating the high regulation landscape is key to maximizing your short term rental income potential. Let's dive into the specifics.
Key Capalbio Airbnb Performance Metrics Overview
Monthly Airbnb Revenue Variations & Income Potential in Capalbio (2025)
Understanding the monthly revenue variations for Airbnb listings in Capalbio is key to maximizing your short term rental income potential. Seasonality significantly impacts earnings. Our analysis, based on data from the past 12 months, shows that the peak revenue month for STRs in Capalbio is typically August, while February often presents the lowest earnings, highlighting opportunities for strategic pricing adjustments during shoulder and low seasons. Explore the typical Airbnb income in Capalbio across different performance tiers:
- Best-in-class properties (Top 10%) achieve $4,867+ monthly, often utilizing dynamic pricing and superior guest experiences.
- Strong performing properties (Top 25%) earn $2,293 or more, indicating effective management and desirable locations/amenities.
- Typical properties (Median) generate around $1,344 per month, representing the average market performance.
- Entry-level properties (Bottom 25%) see earnings around $625, often with potential for optimization.
Average Monthly Airbnb Earnings Trend in Capalbio
Capalbio Airbnb Occupancy Rate Trends (2025)
Maximize your bookings by understanding the Capalbio STR occupancy trends. Seasonal demand shifts significantly influence how often properties are booked. Typically, Augustsees the highest demand (peak season occupancy), while December experiences the lowest (low season). Effective strategies, like adjusting minimum stays or offering promotions, can boost occupancy during slower periods. Here's how different property tiers perform in Capalbio:
- Best-in-class properties (Top 10%) achieve 64%+ occupancy, indicating high desirability and potentially optimized availability.
- Strong performing properties (Top 25%) maintain 42% or higher occupancy, suggesting good market fit and guest satisfaction.
- Typical properties (Median) have an occupancy rate around 25%.
- Entry-level properties (Bottom 25%) average 11% occupancy, potentially facing higher vacancy.
Average Monthly Occupancy Rate Trend in Capalbio
Average Daily Rate (ADR) Airbnb Trends in Capalbio (2025)
Effective short term rental pricing strategy in Capalbio involves understanding monthly ADR fluctuations. The Average Daily Rate (ADR) for Airbnb in Capalbio typically peaks in August and dips lowest during February. Leveraging Airbnb dynamic pricing tools or strategies based on this seasonality can significantly boost revenue. Here's a look at the typical nightly rates achieved:
- Best-in-class properties (Top 10%) command rates of $532+ per night, often due to premium features or locations.
- Strong performing properties (Top 25%) achieve nightly rates of $235 or more.
- Typical properties (Median) charge around $140 per night.
- Entry-level properties (Bottom 25%) earn around $110 per night.
Average Daily Rate (ADR) Trend by Month in Capalbio
Get Live Capalbio Market Intelligence 👇

Explore Real-time Analytics
Airbnb Seasonality Analysis & Trends in Capalbio (2025)
Peak Season (August, July, May)
- Revenue averages $3,880 per month
- Occupancy rates average 46.3%
- Daily rates average $319
Shoulder Season
- Revenue averages $1,824 per month
- Occupancy maintains around 28.1%
- Daily rates hold near $264
Low Season (January, February, March)
- Revenue drops to average $738 per month
- Occupancy decreases to average 17.7%
- Daily rates adjust to average $175
Seasonality Insights for Capalbio
- The Airbnb seasonality in Capalbio shows highly seasonal trends requiring careful strategy. While the sections above show seasonal averages, it's also insightful to look at the extremes:
- During the high season, the absolute peak month showcases Capalbio's highest earning potential, with monthly revenues capable of climbing to $4,192, occupancy reaching a high of 58.5%, and ADRs peaking at $327.
- Conversely, the slowest single month of the year, typically falling within the low season, marks the market's lowest point. In this month, revenue might dip to $533, occupancy could drop to 14.2%, and ADRs may adjust down to $174.
- Understanding both the seasonal averages and these monthly peaks and troughs in revenue, occupancy, and ADR is crucial for maximizing your Airbnb profit potential in Capalbio.
Seasonal Strategies for Maximizing Profit
- Peak Season: Maximize revenue through premium pricing and potentially longer minimum stays. Ensure high availability.
- Low Season: Offer competitive pricing, special promotions (e.g., extended stay discounts), and flexible cancellation policies. Target off-season travelers like remote workers or budget-conscious guests.
- Shoulder Seasons: Implement dynamic pricing that balances peak and low rates. Target weekend travelers or specific events. Offer slightly more flexible terms than peak season.
- Regularly analyze your own performance against these Capalbio seasonality benchmarks and adjust your pricing and availability strategy accordingly.
Best Areas for Airbnb Investment in Capalbio (2025)
Exploring the top neighborhoods for short-term rentals in Capalbio? This section highlights key areas, outlining why they are attractive for hosts and guests, along with notable local attractions. Consider these locations based on your target guest profile and investment strategy.
| Neighborhood / Area | Why Host Here? (Target Guests & Appeal) | Key Attractions & Landmarks |
|---|---|---|
| Capalbio Centro | The historic center of Capalbio is charming and picturesque, attracting tourists with its medieval architecture and local culture. It offers a unique experience for visitors who enjoy history and beautiful views. | Capalbio Castle, Tarot Garden, Piazza della Provvidenza, Capalbio's Medieval Walls |
| Stabilimento Balneare La Torre | A popular beach spot near Capalbio, it provides access to beautiful sandy beaches and clear waters, making it an ideal spot for families and beach lovers. | Torre di Monte Argentario, Sandy beaches, Water sports, Local beach clubs |
| Parco della Maremma | This natural park is perfect for nature lovers and adventure seekers, with hiking trails, wildlife, and beautiful coastal scenery. | Hiking trails, Wildlife watching, Scenic views of the coastline, Local flora and fauna |
| Monte Argentario | Located south of Capalbio, this area features stunning coastal views and opportunities for sailing, diving, and exploring charming seaside towns like Porto Ergosto. | Porto Ercole, Porto Santo Stefano, Beaches, Scenic drives, Nature walks |
| La Feniglia Beach | A beautiful and serene stretch of beach that is popular among locals and tourists alike. Offers a tranquil escape and proximity to nature. | Beautiful beaches, Nature reserve trails, Watersports, Relaxation spots |
| Giardino dei Tarocchi | A unique sculpture garden created by Niki de Saint Phalle, attracting visitors interested in art and surrealism. It’s a quirky and colorful location that draws many tourists. | Sculptures, Art installations, Landscape, Photography opportunities |
| Punta Ala | An upscale resort area known for its elite holiday homes and exclusive beach clubs. Popular with wealthy travelers seeking luxury and comfort. | Exclusive beaches, Golf courses, Marina, Fine dining |
| Marsiliana | A quiet countryside area an ideal retreat for those looking to escape the hustle and bustle. It offers beautiful landscapes and wine tasting opportunities. | Vineyards, Cultural heritage, Countryside tours, Local gastronomy |
Understanding Airbnb License Requirements & STR Laws in Capalbio (2025)
Yes, Capalbio, Tuscany, Italy enforces high STR regulations. Obtaining a license and ensuring compliance is almost certainly required according to current 2025 STR laws. Always verify the latest short term rental regulations and Airbnb license requirements directly with local government authorities for Capalbio to ensure full compliance before hosting.
(Source: AirROI data, 2025, based on 41% licensed listings)
Top Performing Airbnb Properties in Capalbio (2025)
Benchmark your potential! Explore examples of top-performing Airbnb properties in Capalbiobased on Trailing Twelve Month (TTM) revenue. Analyze their characteristics, revenue, occupancy rate, and ADR to understand what drives success in this market.
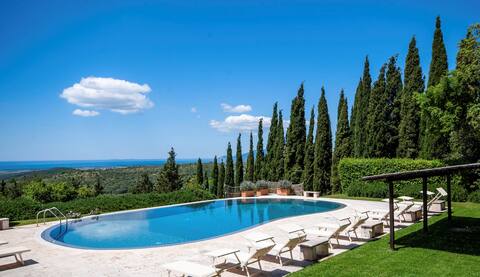
Casale il Mirto, Tuscany sea view
Entire Place • 7 bedrooms
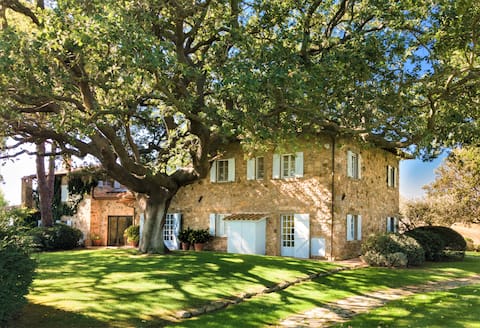
Villa Renaissance: in Maremma, vicina al mare
Entire Place • 6 bedrooms
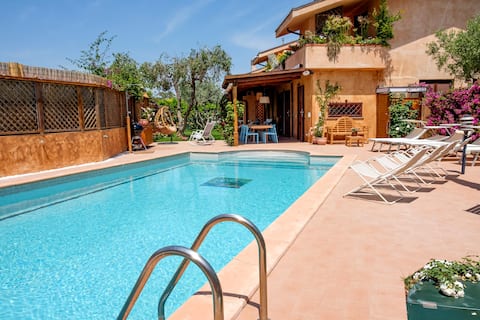
Elegant Villa with Private Pool Capalbio Scalo
Entire Place • 3 bedrooms
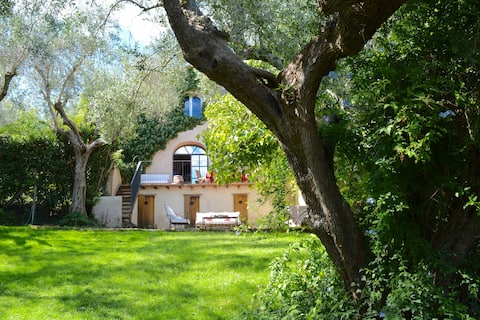
FAB 4BR HOME WITH POOL IN CAPALBIO
Entire Place • 4 bedrooms
![[Beach house] two minutes from the station](https://a0.muscache.com/im/pictures/miso/Hosting-885578772376525505/original/aeedd67c-fa4c-4c8f-abbd-69ce723d2b41.jpeg?im_w=480&im_format=avif)
[Beach house] two minutes from the station
Entire Place • 2 bedrooms
CAPALBIO CHARMING VILLA WITH POOL
Entire Place • 5 bedrooms
Note: Performance varies based on location, size, amenities, seasonality, and management quality. Data reflects the past 12 months.
Top Performing Airbnb Hosts in Capalbio (2025)
Learn from the best! This table showcases top-performing Airbnb hosts in Capalbio based on the number of properties managed and estimated total revenue over the past year. Analyze their scale and performance metrics.
| Host Name | Properties | Grossing Revenue | Stay Reviews | Avg Rating |
|---|---|---|---|---|
| Lucrezia | 1 | $116,590 | 35 | 4.83/5.0 |
| Danila | 3 | $114,911 | 83 | 4.52/5.0 |
| Tiziana | 1 | $64,683 | 30 | 5.00/5.0 |
| Stefano | 3 | $61,413 | 50 | 4.96/5.0 |
| Host #7025181 | 1 | $48,154 | 1 | 0.00/5.0 |
| Leandro | 1 | $47,942 | 16 | 4.94/5.0 |
| Barbara | 1 | $37,659 | 15 | 5.00/5.0 |
| Adriana E Francesca | 1 | $35,956 | 8 | 5.00/5.0 |
| Graziano E Maria | 2 | $27,957 | 98 | 4.91/5.0 |
| Host #23497896 | 1 | $26,491 | 0 | 0.00/5.0 |
Analyzing the strategies of top hosts, such as their property selection, pricing, and guest communication, can offer valuable lessons for optimizing your own Airbnb operations in Capalbio.
Dive Deeper: Advanced Capalbio STR Market Data (2025)
Ready to unlock more insights? AirROI provides access to advanced metrics and comprehensive Airbnb data for Capalbio. Explore detailed analytics beyond this report to refine your investment strategy, optimize pricing, and maximize your vacation rental profits.
Explore Advanced MetricsCapalbio Short-Term Rental Market Composition (2025): Property & Room Types
Room Type Distribution
Property Type Distribution
Market Composition Insights for Capalbio
- The Capalbio Airbnb market composition is heavily skewed towards Entire Home/Apt listings, which make up 91.4% of the 93 active rentals. This indicates strong guest preference for privacy and space.
- Looking at the property type distribution in Capalbio, House properties are the most common (50.5%), reflecting the local real estate landscape.
- Houses represent a significant 50.5% portion, catering likely to families or larger groups.
- Smaller segments like hotel/boutique, others (combined 3.3%) offer potential for unique stay experiences.
Capalbio Airbnb Room Capacity Analysis (2025): Bedroom Distribution
Distribution of Listings by Number of Bedrooms
Room Capacity Insights for Capalbio
- The dominant room capacity in Capalbio is 2 bedrooms listings, making up 41.9% of the market. This suggests a strong demand for properties suitable for couples or solo travelers.
- Together, 2 bedrooms and 1 bedroom properties represent 68.8% of the active Airbnb listings in Capalbio, indicating a high concentration in these sizes.
- A significant 23.7% of listings offer 3+ bedrooms, catering to larger groups and families seeking more space in Capalbio.
Capalbio Vacation Rental Guest Capacity Trends (2025)
Distribution of Listings by Guest Capacity
Guest Capacity Insights for Capalbio
- The most common guest capacity trend in Capalbio vacation rentals is listings accommodating 4 guests (35.5%). This suggests the primary traveler segment is likely small families or groups.
- Properties designed for 4 guests and 8+ guests dominate the Capalbio STR market, accounting for 49.5% of listings.
- 28.0% of properties accommodate 6+ guests, serving the market segment for larger families or group travel in Capalbio.
- On average, properties in Capalbio are equipped to host 4.4 guests.
Capalbio Airbnb Booking Patterns (2025): Available vs. Booked Days
Available Days Distribution
Booked Days Distribution
Booking Pattern Insights for Capalbio
- The most common availability pattern in Capalbio falls within the 271-366 days range, representing 75.3% of listings. This suggests many properties have significant open periods on their calendars.
- Approximately 92.5% of listings show high availability (181+ days open annually), indicating potential for increased bookings or specific owner usage patterns.
- For booked days, the 31-90 days range is most frequent in Capalbio (41.9%), reflecting common guest stay durations or potential owner blocking patterns.
- A notable 10.8% of properties secure long booking periods (181+ days booked per year), highlighting successful long-term rental strategies or significant owner usage.
Capalbio Airbnb Minimum Stay Requirements Analysis
Distribution of Listings by Minimum Night Requirement
1 Night
11 listings
13.6% of total
2 Nights
19 listings
23.5% of total
3 Nights
5 listings
6.2% of total
4-6 Nights
15 listings
18.5% of total
7-29 Nights
25 listings
30.9% of total
30+ Nights
6 listings
7.4% of total
Key Insights
- The most prevalent minimum stay requirement in Capalbio is 7-29 Nights, adopted by 30.9% of listings. This highlights the market's preference for shorter, flexible bookings.
Recommendations
- Align with the market by considering a 7-29 Nights minimum stay, as 30.9% of Capalbio hosts use this setting.
- If feasible, allowing 1-night stays, especially midweek or during low season, could capture last-minute bookings, as only 13.6% currently do.
- Explore offering discounts for stays of 30+ nights to attract the 7.4% of the market seeking extended stays.
- Adjust minimum nights based on seasonality – potentially shorter during low season and longer during peak demand periods in Capalbio.
Capalbio Airbnb Cancellation Policy Trends Analysis (2025)
Super Strict 60 Days
2 listings
2.8% of total
Flexible
16 listings
22.5% of total
Moderate
28 listings
39.4% of total
Strict
25 listings
35.2% of total
Cancellation Policy Insights for Capalbio
- The prevailing Airbnb cancellation policy trend in Capalbio is Moderate, used by 39.4% of listings.
- There's a relatively balanced mix between guest-friendly (61.9%) and stricter (35.2%) policies, offering choices for different guest needs.
Recommendations for Hosts
- Consider adopting a Moderate policy to align with the 39.4% market standard in Capalbio.
- With 35.2% using Strict terms, this is a viable option in Capalbio, particularly for high-value properties or during peak demand periods.
- Regularly review your cancellation policy against competitors and market demand shifts in Capalbio.
Capalbio STR Booking Lead Time Analysis (2025)
Average Booking Lead Time by Month
Booking Lead Time Insights for Capalbio
- The overall average booking lead time for vacation rentals in Capalbio is 49 days.
- Guests book furthest in advance for stays during October (average 106 days), likely coinciding with peak travel demand or local events.
- The shortest booking windows occur for stays in December (average 15 days), indicating more last-minute travel plans during this time.
- Seasonally, Summer (73 days avg.) sees the longest lead times, while Winter (23 days avg.) has the shortest, reflecting typical travel planning cycles.
Recommendations for Hosts
- Use the overall average lead time (49 days) as a baseline for your pricing and availability strategy in Capalbio.
- For October stays, consider implementing length-of-stay discounts or slightly higher rates for bookings made less than 106 days out to capitalize on advance planning.
- Target marketing efforts for the Summer season well in advance (at least 73 days) to capture early planners.
- Monitor your own booking lead times against these Capalbio averages to identify opportunities for dynamic pricing adjustments.
Popular & Essential Airbnb Amenities in Capalbio (2025)
Amenity Prevalence
Amenity Insights for Capalbio
- Popular amenities like TV, Kitchen, Hot water are common but not universal. Offering these can provide a competitive edge.
Recommendations for Hosts
- Consider adding popular differentiators like TV or Kitchen to increase appeal.
- Highlight unique or less common amenities you offer (e.g., hot tub, dedicated workspace, EV charger) in your listing description and photos.
- Regularly check competitor amenities in Capalbio to stay competitive.
Capalbio Airbnb Guest Demographics & Profile Analysis (2025)
Guest Profile Summary for Capalbio
- The typical guest profile for Airbnb in Capalbio consists of a mix of domestic (58%) and international guests, often arriving from nearby Rome, typically belonging to the Post-2000s (Gen Z/Alpha) group (50%), primarily speaking English or Italian.
- Domestic travelers account for 57.7% of guests.
- Key international markets include Italy (57.7%) and Germany (9.2%).
- Top languages spoken are English (34.2%) followed by Italian (23.5%).
- A significant demographic segment is the Post-2000s (Gen Z/Alpha) group, representing 50% of guests.
Recommendations for Hosts
- Balance marketing efforts between domestic and international channels based on the guest mix.
- Tailor amenities and listing descriptions to appeal to the dominant Post-2000s (Gen Z/Alpha) demographic (e.g., highlight fast WiFi, smart home features, local guides).
- Highlight unique local experiences or amenities relevant to the primary guest profile.
- Consider seasonal promotions aligned with peak travel times for key origin markets.
Nearby Short-Term Rental Market Comparison
How does the Capalbio Airbnb market stack up against its neighbors? Compare key performance metrics like average monthly revenue, ADR, and occupancy rates in surrounding areas to understand the broader regional STR landscape.
| Market | Active Properties | Monthly Revenue | Daily Rate | Avg. Occupancy |
|---|---|---|---|---|
| Crespina | 16 | $3,526 | $493.64 | 48% |
| Tignano | 10 | $3,391 | $500.31 | 36% |
| Buonconvento | 59 | $3,068 | $456.70 | 46% |
| Rome | 23,290 | $2,898 | $208.87 | 51% |
| Castelfranco di Sotto | 47 | $2,881 | $294.54 | 38% |
| Collazzone | 28 | $2,839 | $341.11 | 36% |
| Florence | 9,598 | $2,833 | $208.48 | 52% |
| Marcialla | 25 | $2,788 | $236.61 | 54% |
| Parrano | 18 | $2,762 | $329.95 | 34% |
| Impruneta | 131 | $2,761 | $237.93 | 45% |