Bibbiena Airbnb Market Analysis 2025: Short Term Rental Data & Vacation Rental Statistics in Tuscany, Italy
Is Airbnb profitable in Bibbiena in 2025? Explore comprehensive Airbnb analytics for Bibbiena, Tuscany, Italy to uncover income potential. This 2025 STR market report for Bibbiena, based on AirROI data from April 2024 to March 2025, reveals key trends in the niche market of 55 active listings.
Whether you're considering an Airbnb investment in Bibbiena, optimizing your existing vacation rental, or exploring rental arbitrage opportunities, understanding the Bibbiena Airbnb data is crucial. Navigating the high regulation landscape is key to maximizing your short term rental income potential. Let's dive into the specifics.
Key Bibbiena Airbnb Performance Metrics Overview
Monthly Airbnb Revenue Variations & Income Potential in Bibbiena (2025)
Understanding the monthly revenue variations for Airbnb listings in Bibbiena is key to maximizing your short term rental income potential. Seasonality significantly impacts earnings. Our analysis, based on data from the past 12 months, shows that the peak revenue month for STRs in Bibbiena is typically August, while February often presents the lowest earnings, highlighting opportunities for strategic pricing adjustments during shoulder and low seasons. Explore the typical Airbnb income in Bibbiena across different performance tiers:
- Best-in-class properties (Top 10%) achieve $5,444+ monthly, often utilizing dynamic pricing and superior guest experiences.
- Strong performing properties (Top 25%) earn $2,311 or more, indicating effective management and desirable locations/amenities.
- Typical properties (Median) generate around $1,068 per month, representing the average market performance.
- Entry-level properties (Bottom 25%) see earnings around $526, often with potential for optimization.
Average Monthly Airbnb Earnings Trend in Bibbiena
Bibbiena Airbnb Occupancy Rate Trends (2025)
Maximize your bookings by understanding the Bibbiena STR occupancy trends. Seasonal demand shifts significantly influence how often properties are booked. Typically, Augustsees the highest demand (peak season occupancy), while November experiences the lowest (low season). Effective strategies, like adjusting minimum stays or offering promotions, can boost occupancy during slower periods. Here's how different property tiers perform in Bibbiena:
- Best-in-class properties (Top 10%) achieve 65%+ occupancy, indicating high desirability and potentially optimized availability.
- Strong performing properties (Top 25%) maintain 44% or higher occupancy, suggesting good market fit and guest satisfaction.
- Typical properties (Median) have an occupancy rate around 26%.
- Entry-level properties (Bottom 25%) average 15% occupancy, potentially facing higher vacancy.
Average Monthly Occupancy Rate Trend in Bibbiena
Average Daily Rate (ADR) Airbnb Trends in Bibbiena (2025)
Effective short term rental pricing strategy in Bibbiena involves understanding monthly ADR fluctuations. The Average Daily Rate (ADR) for Airbnb in Bibbiena typically peaks in August and dips lowest during March. Leveraging Airbnb dynamic pricing tools or strategies based on this seasonality can significantly boost revenue. Here's a look at the typical nightly rates achieved:
- Best-in-class properties (Top 10%) command rates of $665+ per night, often due to premium features or locations.
- Strong performing properties (Top 25%) achieve nightly rates of $243 or more.
- Typical properties (Median) charge around $128 per night.
- Entry-level properties (Bottom 25%) earn around $93 per night.
Average Daily Rate (ADR) Trend by Month in Bibbiena
Get Live Bibbiena Market Intelligence 👇

Explore Real-time Analytics
Airbnb Seasonality Analysis & Trends in Bibbiena (2025)
Peak Season (August, July, October)
- Revenue averages $4,027 per month
- Occupancy rates average 48.5%
- Daily rates average $251
Shoulder Season
- Revenue averages $1,977 per month
- Occupancy maintains around 30.1%
- Daily rates hold near $235
Low Season (February, March, November)
- Revenue drops to average $758 per month
- Occupancy decreases to average 19.3%
- Daily rates adjust to average $209
Seasonality Insights for Bibbiena
- The Airbnb seasonality in Bibbiena shows highly seasonal trends requiring careful strategy. While the sections above show seasonal averages, it's also insightful to look at the extremes:
- During the high season, the absolute peak month showcases Bibbiena's highest earning potential, with monthly revenues capable of climbing to $4,818, occupancy reaching a high of 60.4%, and ADRs peaking at $257.
- Conversely, the slowest single month of the year, typically falling within the low season, marks the market's lowest point. In this month, revenue might dip to $357, occupancy could drop to 17.7%, and ADRs may adjust down to $201.
- Understanding both the seasonal averages and these monthly peaks and troughs in revenue, occupancy, and ADR is crucial for maximizing your Airbnb profit potential in Bibbiena.
Seasonal Strategies for Maximizing Profit
- Peak Season: Maximize revenue through premium pricing and potentially longer minimum stays. Ensure high availability.
- Low Season: Offer competitive pricing, special promotions (e.g., extended stay discounts), and flexible cancellation policies. Target off-season travelers like remote workers or budget-conscious guests.
- Shoulder Seasons: Implement dynamic pricing that balances peak and low rates. Target weekend travelers or specific events. Offer slightly more flexible terms than peak season.
- Regularly analyze your own performance against these Bibbiena seasonality benchmarks and adjust your pricing and availability strategy accordingly.
Best Areas for Airbnb Investment in Bibbiena (2025)
Exploring the top neighborhoods for short-term rentals in Bibbiena? This section highlights key areas, outlining why they are attractive for hosts and guests, along with notable local attractions. Consider these locations based on your target guest profile and investment strategy.
| Neighborhood / Area | Why Host Here? (Target Guests & Appeal) | Key Attractions & Landmarks |
|---|---|---|
| Centro Storico | The historical center of Bibbiena is rich in culture and history, attracting tourists who want to experience authentic Tuscan life. Its charming streets and local shops make it a prime location for Airbnb hosting. | Palazzo Doria, Chiesa di Santa Maria Assunta, Bibbiena Castle, Piazza Santi Ippolito e Donato, Museo Archeologico di Bibbiena |
| Parco Nazionale delle Foreste Casentinesi | This national park is a natural gem offering breathtaking landscapes and outdoor activities. It's ideal for nature lovers and outdoor enthusiasts, making it a perfect spot for Airbnb hosting. | Foresta di Camaldoli, Eremo di Camaldoli, Casentino Forests, Sanctuary of La Verna, hiking trails |
| Castel San Niccolò | A nearby village offering scenic views and a peaceful atmosphere. It attracts tourists looking for a quiet retreat yet is close enough to Bibbiena for convenience. | Castello di San Niccolò, La Chiesa di San Niccolò, local hiking trails, traditional Tuscan cuisine |
| Pian di Sco | Just a short drive from Bibbiena, this area offers rolling hills and beautiful landscapes. It's become a favorite spot for tourists seeking peaceful retreats with plenty of outdoor activities. | Vallombrosa Abbey, hiking and biking trails, local vineyards, picnic spots |
| Poppi | A charming town known for its medieval castle and historic architecture. It's just a short distance from Bibbiena and attracts visitors interested in history and culture. | Castello di Poppi, Parco Nazionale delle Foreste Casentinesi, historic town center, local festivals |
| Stia | A picturesque town known for its scenic beauty and ancient architecture. Stia attracts tourists looking for cultural experiences and nature, making it an excellent spot for Airbnb. | Castello di Stia, Antico Borgo di Stia, museums, local artisan shops |
| Talla | A tranquil town nestled in the hills, offering scenic views and access to nature. It appeals to those wanting a relaxing getaway with a homey feel. | Scenic viewpoints, local hiking routes, authentic Tuscan restaurants |
| Rassina | This small village has become a hidden gem for tourists looking to escape the crowds. It's close to Bibbiena but offers a quieter experience, ideal for Airbnb hosting. | local markets, beautiful landscapes, traditional Tuscan architecture |
Understanding Airbnb License Requirements & STR Laws in Bibbiena (2025)
Yes, Bibbiena, Tuscany, Italy enforces high STR regulations. Obtaining a license and ensuring compliance is almost certainly required according to current 2025 STR laws. Always verify the latest short term rental regulations and Airbnb license requirements directly with local government authorities for Bibbiena to ensure full compliance before hosting.
(Source: AirROI data, 2025, based on 40% licensed listings)
Top Performing Airbnb Properties in Bibbiena (2025)
Benchmark your potential! Explore examples of top-performing Airbnb properties in Bibbienabased on Trailing Twelve Month (TTM) revenue. Analyze their characteristics, revenue, occupancy rate, and ADR to understand what drives success in this market.
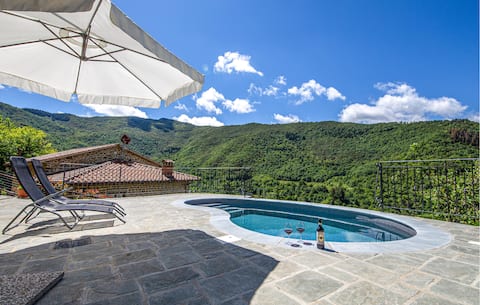
Villa with breathtaking views & private pool
Entire Place • 9 bedrooms
...a dream in the heart of Tuscany
Entire Place • 7 bedrooms
Colle delle Stelline Villa with Pool(40 person)
Entire Place • 22 bedrooms
Awesome home in Bibbiena with kitchen
Entire Place • 4 bedrooms
Amazing home in Pian del Ponte with Wi-Fi
Entire Place • 4 bedrooms
Cozy home in Bibbiena with kitchen
Entire Place • 3 bedrooms
Note: Performance varies based on location, size, amenities, seasonality, and management quality. Data reflects the past 12 months.
Top Performing Airbnb Hosts in Bibbiena (2025)
Learn from the best! This table showcases top-performing Airbnb hosts in Bibbiena based on the number of properties managed and estimated total revenue over the past year. Analyze their scale and performance metrics.
| Host Name | Properties | Grossing Revenue | Stay Reviews | Avg Rating |
|---|---|---|---|---|
| Fabio | 8 | $138,121 | 149 | 4.27/5.0 |
| Villas In Med | 1 | $117,193 | 15 | 4.93/5.0 |
| Giorgio | 1 | $114,286 | 8 | 5.00/5.0 |
| Monika | 1 | $94,719 | 3 | 5.00/5.0 |
| Host #159965541 | 2 | $53,452 | 0 | 0.00/5.0 |
| Host #154026618 | 1 | $42,506 | 0 | 0.00/5.0 |
| Chiara | 4 | $36,361 | 102 | 4.97/5.0 |
| Host #137510446 | 1 | $35,531 | 0 | 0.00/5.0 |
| Host #117236112 | 4 | $27,117 | 1 | 0.00/5.0 |
| Host #343285999 | 3 | $26,609 | 0 | 0.00/5.0 |
Analyzing the strategies of top hosts, such as their property selection, pricing, and guest communication, can offer valuable lessons for optimizing your own Airbnb operations in Bibbiena.
Dive Deeper: Advanced Bibbiena STR Market Data (2025)
Ready to unlock more insights? AirROI provides access to advanced metrics and comprehensive Airbnb data for Bibbiena. Explore detailed analytics beyond this report to refine your investment strategy, optimize pricing, and maximize your vacation rental profits.
Explore Advanced MetricsBibbiena Short-Term Rental Market Composition (2025): Property & Room Types
Room Type Distribution
Property Type Distribution
Market Composition Insights for Bibbiena
- The Bibbiena Airbnb market composition is heavily skewed towards Entire Home/Apt listings, which make up 87.3% of the 55 active rentals. This indicates strong guest preference for privacy and space.
- Looking at the property type distribution in Bibbiena, House properties are the most common (54.5%), reflecting the local real estate landscape.
- Houses represent a significant 54.5% portion, catering likely to families or larger groups.
- Smaller segments like hotel/boutique (combined 3.6%) offer potential for unique stay experiences.
Bibbiena Airbnb Room Capacity Analysis (2025): Bedroom Distribution
Distribution of Listings by Number of Bedrooms
Room Capacity Insights for Bibbiena
- The dominant room capacity in Bibbiena is 2 bedrooms listings, making up 36.4% of the market. This suggests a strong demand for properties suitable for couples or solo travelers.
- Together, 2 bedrooms and 1 bedroom properties represent 58.2% of the active Airbnb listings in Bibbiena, indicating a high concentration in these sizes.
- A significant 32.7% of listings offer 3+ bedrooms, catering to larger groups and families seeking more space in Bibbiena.
Bibbiena Vacation Rental Guest Capacity Trends (2025)
Distribution of Listings by Guest Capacity
Guest Capacity Insights for Bibbiena
- The most common guest capacity trend in Bibbiena vacation rentals is listings accommodating 8+ guests (20%). This suggests the primary traveler segment is likely larger groups.
- Properties designed for 8+ guests and 4 guests dominate the Bibbiena STR market, accounting for 40.0% of listings.
- 40.0% of properties accommodate 6+ guests, serving the market segment for larger families or group travel in Bibbiena.
- On average, properties in Bibbiena are equipped to host 4.7 guests.
Bibbiena Airbnb Booking Patterns (2025): Available vs. Booked Days
Available Days Distribution
Booked Days Distribution
Booking Pattern Insights for Bibbiena
- The most common availability pattern in Bibbiena falls within the 271-366 days range, representing 65.5% of listings. This suggests many properties have significant open periods on their calendars.
- Approximately 96.4% of listings show high availability (181+ days open annually), indicating potential for increased bookings or specific owner usage patterns.
- For booked days, the 31-90 days range is most frequent in Bibbiena (40%), reflecting common guest stay durations or potential owner blocking patterns.
- A notable 7.3% of properties secure long booking periods (181+ days booked per year), highlighting successful long-term rental strategies or significant owner usage.
Bibbiena Airbnb Minimum Stay Requirements Analysis
Distribution of Listings by Minimum Night Requirement
1 Night
4 listings
7.8% of total
2 Nights
13 listings
25.5% of total
3 Nights
8 listings
15.7% of total
4-6 Nights
13 listings
25.5% of total
7-29 Nights
5 listings
9.8% of total
30+ Nights
8 listings
15.7% of total
Key Insights
- The most prevalent minimum stay requirement in Bibbiena is 2 Nights, adopted by 25.5% of listings. This highlights the market's preference for shorter, flexible bookings.
- A significant segment (15.7%) caters to monthly stays (30+ nights) in Bibbiena, pointing to opportunities in the extended-stay market.
Recommendations
- Align with the market by considering a 2 Nights minimum stay, as 25.5% of Bibbiena hosts use this setting.
- If feasible, allowing 1-night stays, especially midweek or during low season, could capture last-minute bookings, as only 7.8% currently do.
- Explore offering discounts for stays of 30+ nights to attract the 15.7% of the market seeking extended stays.
- Adjust minimum nights based on seasonality – potentially shorter during low season and longer during peak demand periods in Bibbiena.
Bibbiena Airbnb Cancellation Policy Trends Analysis (2025)
Super Strict 60 Days
4 listings
11.8% of total
Flexible
16 listings
47.1% of total
Moderate
8 listings
23.5% of total
Strict
6 listings
17.6% of total
Cancellation Policy Insights for Bibbiena
- The prevailing Airbnb cancellation policy trend in Bibbiena is Flexible, used by 47.1% of listings.
- The market strongly favors guest-friendly terms, with 70.6% of listings offering Flexible or Moderate policies. This suggests guests in Bibbiena may expect booking flexibility.
Recommendations for Hosts
- Consider adopting a Flexible policy to align with the 47.1% market standard in Bibbiena.
- Regularly review your cancellation policy against competitors and market demand shifts in Bibbiena.
Bibbiena STR Booking Lead Time Analysis (2025)
Average Booking Lead Time by Month
Booking Lead Time Insights for Bibbiena
- The overall average booking lead time for vacation rentals in Bibbiena is 60 days.
- Guests book furthest in advance for stays during May (average 104 days), likely coinciding with peak travel demand or local events.
- The shortest booking windows occur for stays in February (average 3 days), indicating more last-minute travel plans during this time.
- Seasonally, Summer (90 days avg.) sees the longest lead times, while Winter (33 days avg.) has the shortest, reflecting typical travel planning cycles.
Recommendations for Hosts
- Use the overall average lead time (60 days) as a baseline for your pricing and availability strategy in Bibbiena.
- For May stays, consider implementing length-of-stay discounts or slightly higher rates for bookings made less than 104 days out to capitalize on advance planning.
- During February, focus on last-minute booking availability and promotions, as guests book with very short notice (3 days avg.).
- Target marketing efforts for the Summer season well in advance (at least 90 days) to capture early planners.
- Monitor your own booking lead times against these Bibbiena averages to identify opportunities for dynamic pricing adjustments.
Popular & Essential Airbnb Amenities in Bibbiena (2025)
Amenity Prevalence
Amenity Insights for Bibbiena
- Essential amenities in Bibbiena that guests expect include: Hot water, Kitchen. Lacking these (any) could significantly impact bookings.
- Popular amenities like Wifi, Essentials, Refrigerator are common but not universal. Offering these can provide a competitive edge.
- Warning: Wifi is not universally provided but is considered essential globally. Ensure reliable Wifi is offered.
Recommendations for Hosts
- Ensure your listing includes all essential amenities for Bibbiena: Hot water, Kitchen.
- Consider adding popular differentiators like Wifi or Essentials to increase appeal.
- Highlight unique or less common amenities you offer (e.g., hot tub, dedicated workspace, EV charger) in your listing description and photos.
- Regularly check competitor amenities in Bibbiena to stay competitive.
Bibbiena Airbnb Guest Demographics & Profile Analysis (2025)
Guest Profile Summary for Bibbiena
- The typical guest profile for Airbnb in Bibbiena consists of predominantly international visitors (66%), with top international origins including Germany, typically belonging to the Post-2000s (Gen Z/Alpha) group (50%), primarily speaking English or German.
- Domestic travelers account for 34.1% of guests.
- Key international markets include Italy (34.1%) and Germany (26.1%).
- Top languages spoken are English (36.6%) followed by German (15.8%).
- A significant demographic segment is the Post-2000s (Gen Z/Alpha) group, representing 50% of guests.
Recommendations for Hosts
- Focus marketing internationally, particularly towards travelers from Germany.
- Tailor amenities and listing descriptions to appeal to the dominant Post-2000s (Gen Z/Alpha) demographic (e.g., highlight fast WiFi, smart home features, local guides).
- Highlight unique local experiences or amenities relevant to the primary guest profile.
- Consider seasonal promotions aligned with peak travel times for key origin markets.
Nearby Short-Term Rental Market Comparison
How does the Bibbiena Airbnb market stack up against its neighbors? Compare key performance metrics like average monthly revenue, ADR, and occupancy rates in surrounding areas to understand the broader regional STR landscape.
| Market | Active Properties | Monthly Revenue | Daily Rate | Avg. Occupancy |
|---|---|---|---|---|
| Crespina | 16 | $3,526 | $493.64 | 48% |
| Tignano | 10 | $3,391 | $500.31 | 36% |
| Luni Mare | 11 | $3,102 | $169.59 | 40% |
| Buonconvento | 59 | $3,068 | $456.70 | 46% |
| Castelfranco di Sotto | 47 | $2,881 | $294.54 | 38% |
| Collazzone | 28 | $2,839 | $341.11 | 36% |
| Florence | 9,598 | $2,833 | $208.48 | 52% |
| Marcialla | 25 | $2,788 | $236.61 | 54% |
| Parrano | 18 | $2,762 | $329.95 | 34% |
| Impruneta | 131 | $2,761 | $237.93 | 45% |