Barberino di Mugello Airbnb Market Analysis 2025: Short Term Rental Data & Vacation Rental Statistics in Tuscany, Italy
Is Airbnb profitable in Barberino di Mugello in 2025? Explore comprehensive Airbnb analytics for Barberino di Mugello, Tuscany, Italy to uncover income potential. This 2025 STR market report for Barberino di Mugello, based on AirROI data from April 2024 to March 2025, reveals key trends in the niche market of 62 active listings.
Whether you're considering an Airbnb investment in Barberino di Mugello, optimizing your existing vacation rental, or exploring rental arbitrage opportunities, understanding the Barberino di Mugello Airbnb data is crucial. Navigating the high regulation landscape is key to maximizing your short term rental income potential. Let's dive into the specifics.
Key Barberino di Mugello Airbnb Performance Metrics Overview
Monthly Airbnb Revenue Variations & Income Potential in Barberino di Mugello (2025)
Understanding the monthly revenue variations for Airbnb listings in Barberino di Mugello is key to maximizing your short term rental income potential. Seasonality significantly impacts earnings. Our analysis, based on data from the past 12 months, shows that the peak revenue month for STRs in Barberino di Mugello is typically July, while February often presents the lowest earnings, highlighting opportunities for strategic pricing adjustments during shoulder and low seasons. Explore the typical Airbnb income in Barberino di Mugello across different performance tiers:
- Best-in-class properties (Top 10%) achieve $4,083+ monthly, often utilizing dynamic pricing and superior guest experiences.
- Strong performing properties (Top 25%) earn $2,108 or more, indicating effective management and desirable locations/amenities.
- Typical properties (Median) generate around $1,057 per month, representing the average market performance.
- Entry-level properties (Bottom 25%) see earnings around $504, often with potential for optimization.
Average Monthly Airbnb Earnings Trend in Barberino di Mugello
Barberino di Mugello Airbnb Occupancy Rate Trends (2025)
Maximize your bookings by understanding the Barberino di Mugello STR occupancy trends. Seasonal demand shifts significantly influence how often properties are booked. Typically, Augustsees the highest demand (peak season occupancy), while February experiences the lowest (low season). Effective strategies, like adjusting minimum stays or offering promotions, can boost occupancy during slower periods. Here's how different property tiers perform in Barberino di Mugello:
- Best-in-class properties (Top 10%) achieve 70%+ occupancy, indicating high desirability and potentially optimized availability.
- Strong performing properties (Top 25%) maintain 52% or higher occupancy, suggesting good market fit and guest satisfaction.
- Typical properties (Median) have an occupancy rate around 31%.
- Entry-level properties (Bottom 25%) average 15% occupancy, potentially facing higher vacancy.
Average Monthly Occupancy Rate Trend in Barberino di Mugello
Average Daily Rate (ADR) Airbnb Trends in Barberino di Mugello (2025)
Effective short term rental pricing strategy in Barberino di Mugello involves understanding monthly ADR fluctuations. The Average Daily Rate (ADR) for Airbnb in Barberino di Mugello typically peaks in July and dips lowest during February. Leveraging Airbnb dynamic pricing tools or strategies based on this seasonality can significantly boost revenue. Here's a look at the typical nightly rates achieved:
- Best-in-class properties (Top 10%) command rates of $404+ per night, often due to premium features or locations.
- Strong performing properties (Top 25%) achieve nightly rates of $185 or more.
- Typical properties (Median) charge around $112 per night.
- Entry-level properties (Bottom 25%) earn around $72 per night.
Average Daily Rate (ADR) Trend by Month in Barberino di Mugello
Get Live Barberino di Mugello Market Intelligence 👇

Explore Real-time Analytics
Airbnb Seasonality Analysis & Trends in Barberino di Mugello (2025)
Peak Season (July, August, May)
- Revenue averages $3,214 per month
- Occupancy rates average 51.1%
- Daily rates average $197
Shoulder Season
- Revenue averages $1,584 per month
- Occupancy maintains around 35.6%
- Daily rates hold near $178
Low Season (January, February, March)
- Revenue drops to average $474 per month
- Occupancy decreases to average 19.9%
- Daily rates adjust to average $158
Seasonality Insights for Barberino di Mugello
- The Airbnb seasonality in Barberino di Mugello shows highly seasonal trends requiring careful strategy. While the sections above show seasonal averages, it's also insightful to look at the extremes:
- During the high season, the absolute peak month showcases Barberino di Mugello's highest earning potential, with monthly revenues capable of climbing to $3,755, occupancy reaching a high of 59.4%, and ADRs peaking at $202.
- Conversely, the slowest single month of the year, typically falling within the low season, marks the market's lowest point. In this month, revenue might dip to $335, occupancy could drop to 14.7%, and ADRs may adjust down to $157.
- Understanding both the seasonal averages and these monthly peaks and troughs in revenue, occupancy, and ADR is crucial for maximizing your Airbnb profit potential in Barberino di Mugello.
Seasonal Strategies for Maximizing Profit
- Peak Season: Maximize revenue through premium pricing and potentially longer minimum stays. Ensure high availability.
- Low Season: Offer competitive pricing, special promotions (e.g., extended stay discounts), and flexible cancellation policies. Target off-season travelers like remote workers or budget-conscious guests.
- Shoulder Seasons: Implement dynamic pricing that balances peak and low rates. Target weekend travelers or specific events. Offer slightly more flexible terms than peak season.
- Regularly analyze your own performance against these Barberino di Mugello seasonality benchmarks and adjust your pricing and availability strategy accordingly.
Best Areas for Airbnb Investment in Barberino di Mugello (2025)
Exploring the top neighborhoods for short-term rentals in Barberino di Mugello? This section highlights key areas, outlining why they are attractive for hosts and guests, along with notable local attractions. Consider these locations based on your target guest profile and investment strategy.
| Neighborhood / Area | Why Host Here? (Target Guests & Appeal) | Key Attractions & Landmarks |
|---|---|---|
| Mugello Valley | A picturesque valley surrounded by stunning Tuscan hills, popular for its natural beauty and outdoor activities. Great for hiking, biking, and enjoying the serene landscapes. | Lake Bilancino, Mugello Circuit, Appennine Mountains, Foreste Casentinesi, Medieval villages like Scarperia |
| Scarperia | Known for its historical charm and well-preserved Renaissance architecture. Scarperia attracts visitors interested in history, culture, and traditional Tuscan life. | Palazzo dei Vicari, San Lorenzo Church, Local artisan shops, The ancient town walls, Annual medieval festival |
| Borgo San Lorenzo | The main town in Mugello offering various amenities, shops, and eateries. A central spot for visitors who want easy access to various attractions in the region. | San Lorenzo Church, Museo di San Lorenzo, Local markets, Countryside strolls, Restaurants serving traditional Tuscan cuisine |
| Firenzuola | A smaller village in the mountains, providing a rustic and tranquil getaway. Attracts those looking for peace, nature, and a chance to escape the hustle. | Fortress of Firenzuola, Southern Apennines, Outdoor trekking, Local agricultural festivals, Charming countryside |
| Vaglia | Located just north of Florence, it offers a great blend of nature and proximity to the city. Perfect for those who want to experience Tuscan countryside while being near urban amenities. | Poggio Pratolino, Parco Mediceo di Pratolino, Historical villas, Hiking trails, Florence Day trips |
| Marradi | A quiet town rich in natural surroundings and traditional Tuscan culture. Ideal for those looking to enjoy authentic experiences away from tourist crowds. | Marradi's Museum of Art, The local chestnut festival, Villa di Vannino, Nature walks, Scenic train rides |
| Rufina | Famous for its wine production and beautiful vineyards. Popular with those interested in enotourism (wine tourism) and Tuscany's gastronomic offerings. | Chianti wine route, Local wineries, Vineyard tours, Scenic drive in Chianti, Traditional dining experiences |
| Fiesole | Slightly outside Florence, known for its Etruscan ruins and scenic views. An excellent choice for visitors who want both history and the beauty of the Florentine hills. | Roman Theatre, Fiesole Archeological Museum, San Francesco Monastery, Beautiful vistas of Florence, Nature trails |
Understanding Airbnb License Requirements & STR Laws in Barberino di Mugello (2025)
Yes, Barberino di Mugello, Tuscany, Italy enforces high STR regulations. Obtaining a license and ensuring compliance is almost certainly required according to current 2025 STR laws. Always verify the latest short term rental regulations and Airbnb license requirements directly with local government authorities for Barberino di Mugello to ensure full compliance before hosting.
(Source: AirROI data, 2025, based on 60% licensed listings)
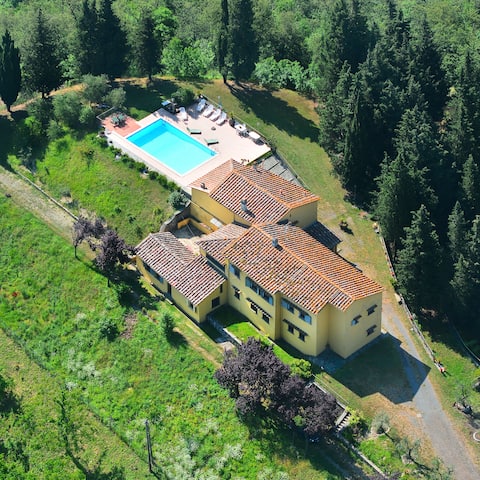
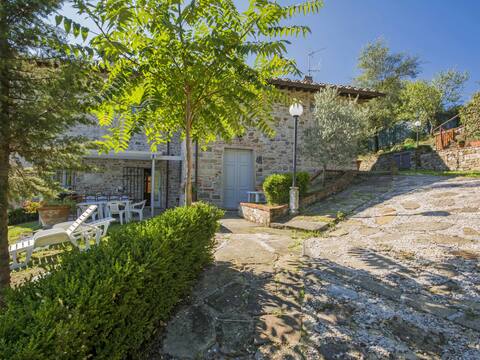
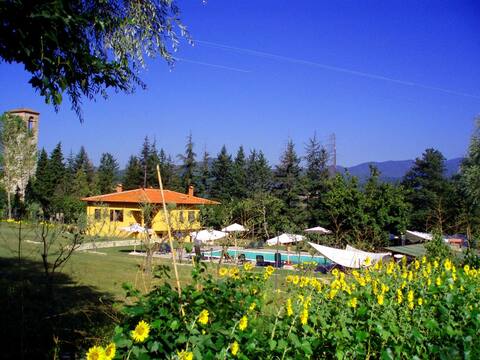
Top Performing Airbnb Properties in Barberino di Mugello (2025)
Benchmark your potential! Explore examples of top-performing Airbnb properties in Barberino di Mugellobased on Trailing Twelve Month (TTM) revenue. Analyze their characteristics, revenue, occupancy rate, and ADR to understand what drives success in this market.

Amazing home in Barberino di Mugello
Entire Place • 2 bedrooms
Poggio San Martino Country Park
Entire Place • 5 bedrooms

Villa Panzano. Park, pool, wifi, 8p. Firenze
Entire Place • 4 bedrooms
Casale Labbia by Interhome
Entire Place • 7 bedrooms
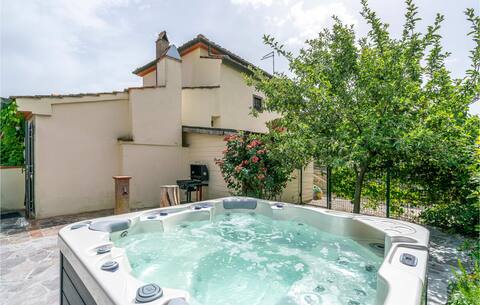
Cozy home in Barberino del Mugello with WiFi
Entire Place • 2 bedrooms
La Valle De Medici (entire structure)
Entire Place • 7 bedrooms
Note: Performance varies based on location, size, amenities, seasonality, and management quality. Data reflects the past 12 months.
Top Performing Airbnb Hosts in Barberino di Mugello (2025)
Learn from the best! This table showcases top-performing Airbnb hosts in Barberino di Mugello based on the number of properties managed and estimated total revenue over the past year. Analyze their scale and performance metrics.
| Host Name | Properties | Grossing Revenue | Stay Reviews | Avg Rating |
|---|---|---|---|---|
| Soc.Agricola F.Lli Guasconi | 2 | $87,083 | 24 | 4.47/5.0 |
| Sid | 3 | $73,332 | 198 | 4.93/5.0 |
| Novasol | 1 | $69,375 | 5 | 4.00/5.0 |
| Luca | 1 | $66,952 | 72 | 4.83/5.0 |
| Lorella | 4 | $66,896 | 576 | 4.78/5.0 |
| Alessio | 3 | $54,452 | 22 | 4.79/5.0 |
| Alessandra - Interhome Group | 3 | $50,032 | 27 | 4.46/5.0 |
| Stefania | 3 | $44,816 | 95 | 4.95/5.0 |
| Novasol | 1 | $40,774 | 6 | 4.83/5.0 |
| Barbara | 4 | $32,737 | 216 | 4.58/5.0 |
Analyzing the strategies of top hosts, such as their property selection, pricing, and guest communication, can offer valuable lessons for optimizing your own Airbnb operations in Barberino di Mugello.
Dive Deeper: Advanced Barberino di Mugello STR Market Data (2025)
Ready to unlock more insights? AirROI provides access to advanced metrics and comprehensive Airbnb data for Barberino di Mugello. Explore detailed analytics beyond this report to refine your investment strategy, optimize pricing, and maximize your vacation rental profits.
Explore Advanced MetricsBarberino di Mugello Short-Term Rental Market Composition (2025): Property & Room Types
Room Type Distribution
Property Type Distribution
Market Composition Insights for Barberino di Mugello
- The Barberino di Mugello Airbnb market composition is heavily skewed towards Entire Home/Apt listings, which make up 82.3% of the 62 active rentals. This indicates strong guest preference for privacy and space.
- Looking at the property type distribution in Barberino di Mugello, Apartment/Condo properties are the most common (45.2%), reflecting the local real estate landscape.
- Houses represent a significant 40.3% portion, catering likely to families or larger groups.
- Smaller segments like others, unique stays, hotel/boutique (combined 6.4%) offer potential for unique stay experiences.
Barberino di Mugello Airbnb Room Capacity Analysis (2025): Bedroom Distribution
Distribution of Listings by Number of Bedrooms
Room Capacity Insights for Barberino di Mugello
- The dominant room capacity in Barberino di Mugello is 1 bedroom listings, making up 29% of the market. This suggests a strong demand for properties suitable for couples or solo travelers.
- Together, 1 bedroom and 2 bedrooms properties represent 58.0% of the active Airbnb listings in Barberino di Mugello, indicating a high concentration in these sizes.
- A significant 27.4% of listings offer 3+ bedrooms, catering to larger groups and families seeking more space in Barberino di Mugello.
Barberino di Mugello Vacation Rental Guest Capacity Trends (2025)
Distribution of Listings by Guest Capacity
Guest Capacity Insights for Barberino di Mugello
- The most common guest capacity trend in Barberino di Mugello vacation rentals is listings accommodating 4 guests (22.6%). This suggests the primary traveler segment is likely small families or groups.
- Properties designed for 4 guests and 6 guests dominate the Barberino di Mugello STR market, accounting for 38.7% of listings.
- 32.2% of properties accommodate 6+ guests, serving the market segment for larger families or group travel in Barberino di Mugello.
- On average, properties in Barberino di Mugello are equipped to host 4.1 guests.
Barberino di Mugello Airbnb Booking Patterns (2025): Available vs. Booked Days
Available Days Distribution
Booked Days Distribution
Booking Pattern Insights for Barberino di Mugello
- The most common availability pattern in Barberino di Mugello falls within the 271-366 days range, representing 53.2% of listings. This suggests many properties have significant open periods on their calendars.
- Approximately 90.3% of listings show high availability (181+ days open annually), indicating potential for increased bookings or specific owner usage patterns.
- For booked days, the 91-180 days range is most frequent in Barberino di Mugello (38.7%), reflecting common guest stay durations or potential owner blocking patterns.
- A notable 9.7% of properties secure long booking periods (181+ days booked per year), highlighting successful long-term rental strategies or significant owner usage.
Barberino di Mugello Airbnb Minimum Stay Requirements Analysis
Distribution of Listings by Minimum Night Requirement
1 Night
22 listings
37.3% of total
2 Nights
14 listings
23.7% of total
3 Nights
9 listings
15.3% of total
4-6 Nights
4 listings
6.8% of total
7-29 Nights
5 listings
8.5% of total
30+ Nights
5 listings
8.5% of total
Key Insights
- The most prevalent minimum stay requirement in Barberino di Mugello is 1 Night, adopted by 37.3% of listings. This highlights the market's preference for shorter, flexible bookings.
- A strong majority (61.0%) of the Barberino di Mugello Airbnb data shows acceptance of very short stays (1-2 nights), indicating a dynamic, high-turnover market.
Recommendations
- Align with the market by considering a 1 Night minimum stay, as 37.3% of Barberino di Mugello hosts use this setting.
- Explore offering discounts for stays of 30+ nights to attract the 8.5% of the market seeking extended stays.
- Adjust minimum nights based on seasonality – potentially shorter during low season and longer during peak demand periods in Barberino di Mugello.
Barberino di Mugello Airbnb Cancellation Policy Trends Analysis (2025)
Super Strict 60 Days
2 listings
3.3% of total
Super Strict 30 Days
6 listings
10% of total
Flexible
27 listings
45% of total
Moderate
15 listings
25% of total
Strict
10 listings
16.7% of total
Cancellation Policy Insights for Barberino di Mugello
- The prevailing Airbnb cancellation policy trend in Barberino di Mugello is Flexible, used by 45% of listings.
- There's a relatively balanced mix between guest-friendly (70.0%) and stricter (16.7%) policies, offering choices for different guest needs.
Recommendations for Hosts
- Consider adopting a Flexible policy to align with the 45% market standard in Barberino di Mugello.
- Regularly review your cancellation policy against competitors and market demand shifts in Barberino di Mugello.
Barberino di Mugello STR Booking Lead Time Analysis (2025)
Average Booking Lead Time by Month
Booking Lead Time Insights for Barberino di Mugello
- The overall average booking lead time for vacation rentals in Barberino di Mugello is 80 days.
- Guests book furthest in advance for stays during June (average 112 days), likely coinciding with peak travel demand or local events.
- The shortest booking windows occur for stays in March (average 21 days), indicating more last-minute travel plans during this time.
- Seasonally, Summer (94 days avg.) sees the longest lead times, while Winter (44 days avg.) has the shortest, reflecting typical travel planning cycles.
Recommendations for Hosts
- Use the overall average lead time (80 days) as a baseline for your pricing and availability strategy in Barberino di Mugello.
- For June stays, consider implementing length-of-stay discounts or slightly higher rates for bookings made less than 112 days out to capitalize on advance planning.
- Target marketing efforts for the Summer season well in advance (at least 94 days) to capture early planners.
- Monitor your own booking lead times against these Barberino di Mugello averages to identify opportunities for dynamic pricing adjustments.
Popular & Essential Airbnb Amenities in Barberino di Mugello (2025)
Amenity Prevalence
Amenity Insights for Barberino di Mugello
- Popular amenities like Kitchen, Free parking on premises, Wifi are common but not universal. Offering these can provide a competitive edge.
- Warning: Wifi is not universally provided but is considered essential globally. Ensure reliable Wifi is offered.
Recommendations for Hosts
- Consider adding popular differentiators like Kitchen or Free parking on premises to increase appeal.
- Highlight unique or less common amenities you offer (e.g., hot tub, dedicated workspace, EV charger) in your listing description and photos.
- Regularly check competitor amenities in Barberino di Mugello to stay competitive.
Barberino di Mugello Airbnb Guest Demographics & Profile Analysis (2025)
Guest Profile Summary for Barberino di Mugello
- The typical guest profile for Airbnb in Barberino di Mugello consists of predominantly international visitors (85%), with top international origins including France, typically belonging to the Post-2000s (Gen Z/Alpha) group (50%), primarily speaking English or French.
- Domestic travelers account for 14.6% of guests.
- Key international markets include Germany (15.8%) and France (14.9%).
- Top languages spoken are English (38.7%) followed by French (12.6%).
- A significant demographic segment is the Post-2000s (Gen Z/Alpha) group, representing 50% of guests.
Recommendations for Hosts
- Focus marketing internationally, particularly towards travelers from France.
- Tailor amenities and listing descriptions to appeal to the dominant Post-2000s (Gen Z/Alpha) demographic (e.g., highlight fast WiFi, smart home features, local guides).
- Highlight unique local experiences or amenities relevant to the primary guest profile.
- Consider seasonal promotions aligned with peak travel times for key origin markets.
Nearby Short-Term Rental Market Comparison
How does the Barberino di Mugello Airbnb market stack up against its neighbors? Compare key performance metrics like average monthly revenue, ADR, and occupancy rates in surrounding areas to understand the broader regional STR landscape.
| Market | Active Properties | Monthly Revenue | Daily Rate | Avg. Occupancy |
|---|---|---|---|---|
| Brenzone sul Garda | 19 | $4,128 | $335.25 | 52% |
| Crespina | 16 | $3,526 | $493.64 | 48% |
| Venice | 6,405 | $3,454 | $238.80 | 53% |
| Tignano | 10 | $3,391 | $500.31 | 36% |
| Luni Mare | 11 | $3,102 | $169.59 | 40% |
| Buonconvento | 59 | $3,068 | $456.70 | 46% |
| Cazzago San Martino | 14 | $3,018 | $474.20 | 28% |
| Castelfranco di Sotto | 47 | $2,881 | $294.54 | 38% |
| Florence | 9,598 | $2,833 | $208.48 | 52% |
| Marcialla | 25 | $2,788 | $236.61 | 54% |