Vallelaghi Airbnb Market Analysis 2025: Short Term Rental Data & Vacation Rental Statistics in Trentino – Alto Adige/Südtirol, Italy
Is Airbnb profitable in Vallelaghi in 2025? Explore comprehensive Airbnb analytics for Vallelaghi, Trentino – Alto Adige/Südtirol, Italy to uncover income potential. This 2025 STR market report for Vallelaghi, based on AirROI data from April 2024 to March 2025, reveals key trends in the niche market of 23 active listings.
Whether you're considering an Airbnb investment in Vallelaghi, optimizing your existing vacation rental, or exploring rental arbitrage opportunities, understanding the Vallelaghi Airbnb data is crucial. Navigating the high regulation landscape is key to maximizing your short term rental income potential. Let's dive into the specifics.
Key Vallelaghi Airbnb Performance Metrics Overview
Monthly Airbnb Revenue Variations & Income Potential in Vallelaghi (2025)
Understanding the monthly revenue variations for Airbnb listings in Vallelaghi is key to maximizing your short term rental income potential. Seasonality significantly impacts earnings. Our analysis, based on data from the past 12 months, shows that the peak revenue month for STRs in Vallelaghi is typically August, while November often presents the lowest earnings, highlighting opportunities for strategic pricing adjustments during shoulder and low seasons. Explore the typical Airbnb income in Vallelaghi across different performance tiers:
- Best-in-class properties (Top 10%) achieve $2,523+ monthly, often utilizing dynamic pricing and superior guest experiences.
- Strong performing properties (Top 25%) earn $1,877 or more, indicating effective management and desirable locations/amenities.
- Typical properties (Median) generate around $1,247 per month, representing the average market performance.
- Entry-level properties (Bottom 25%) see earnings around $626, often with potential for optimization.
Average Monthly Airbnb Earnings Trend in Vallelaghi
Vallelaghi Airbnb Occupancy Rate Trends (2025)
Maximize your bookings by understanding the Vallelaghi STR occupancy trends. Seasonal demand shifts significantly influence how often properties are booked. Typically, Augustsees the highest demand (peak season occupancy), while January experiences the lowest (low season). Effective strategies, like adjusting minimum stays or offering promotions, can boost occupancy during slower periods. Here's how different property tiers perform in Vallelaghi:
- Best-in-class properties (Top 10%) achieve 70%+ occupancy, indicating high desirability and potentially optimized availability.
- Strong performing properties (Top 25%) maintain 53% or higher occupancy, suggesting good market fit and guest satisfaction.
- Typical properties (Median) have an occupancy rate around 39%.
- Entry-level properties (Bottom 25%) average 22% occupancy, potentially facing higher vacancy.
Average Monthly Occupancy Rate Trend in Vallelaghi
Average Daily Rate (ADR) Airbnb Trends in Vallelaghi (2025)
Effective short term rental pricing strategy in Vallelaghi involves understanding monthly ADR fluctuations. The Average Daily Rate (ADR) for Airbnb in Vallelaghi typically peaks in December and dips lowest during March. Leveraging Airbnb dynamic pricing tools or strategies based on this seasonality can significantly boost revenue. Here's a look at the typical nightly rates achieved:
- Best-in-class properties (Top 10%) command rates of $155+ per night, often due to premium features or locations.
- Strong performing properties (Top 25%) achieve nightly rates of $117 or more.
- Typical properties (Median) charge around $93 per night.
- Entry-level properties (Bottom 25%) earn around $77 per night.
Average Daily Rate (ADR) Trend by Month in Vallelaghi
Get Live Vallelaghi Market Intelligence 👇

Explore Real-time Analytics
Airbnb Seasonality Analysis & Trends in Vallelaghi (2025)
Peak Season (August, July, December)
- Revenue averages $2,004 per month
- Occupancy rates average 59.1%
- Daily rates average $103
Shoulder Season
- Revenue averages $1,301 per month
- Occupancy maintains around 35.9%
- Daily rates hold near $98
Low Season (February, October, November)
- Revenue drops to average $836 per month
- Occupancy decreases to average 29.4%
- Daily rates adjust to average $100
Seasonality Insights for Vallelaghi
- The Airbnb seasonality in Vallelaghi shows highly seasonal trends requiring careful strategy. While the sections above show seasonal averages, it's also insightful to look at the extremes:
- During the high season, the absolute peak month showcases Vallelaghi's highest earning potential, with monthly revenues capable of climbing to $2,282, occupancy reaching a high of 71.8%, and ADRs peaking at $110.
- Conversely, the slowest single month of the year, typically falling within the low season, marks the market's lowest point. In this month, revenue might dip to $812, occupancy could drop to 23.8%, and ADRs may adjust down to $96.
- Understanding both the seasonal averages and these monthly peaks and troughs in revenue, occupancy, and ADR is crucial for maximizing your Airbnb profit potential in Vallelaghi.
Seasonal Strategies for Maximizing Profit
- Peak Season: Maximize revenue through premium pricing and potentially longer minimum stays. Ensure high availability.
- Low Season: Offer competitive pricing, special promotions (e.g., extended stay discounts), and flexible cancellation policies. Target off-season travelers like remote workers or budget-conscious guests.
- Shoulder Seasons: Implement dynamic pricing that balances peak and low rates. Target weekend travelers or specific events. Offer slightly more flexible terms than peak season.
- Regularly analyze your own performance against these Vallelaghi seasonality benchmarks and adjust your pricing and availability strategy accordingly.
Best Areas for Airbnb Investment in Vallelaghi (2025)
Exploring the top neighborhoods for short-term rentals in Vallelaghi? This section highlights key areas, outlining why they are attractive for hosts and guests, along with notable local attractions. Consider these locations based on your target guest profile and investment strategy.
| Neighborhood / Area | Why Host Here? (Target Guests & Appeal) | Key Attractions & Landmarks |
|---|---|---|
| Molveno | A stunning lake and mountain area popular for its natural beauty and outdoor activities. Ideal for tourists looking for a peaceful retreat with activities like hiking and skiing nearby. | Lake Molveno, Brenta Dolomites, Molveno-Pradel Cable Car, Hiking trails, Scenic viewpoints |
| Andalo | A popular ski resort town, known for its winter sports and family-friendly atmosphere. Attracts both winter tourists and summer hikers, making it a year-round destination. | Andalo Life Park, Paganella Ski Area, Hiking trails, Lake Andalo, Family activities |
| Fai della Paganella | Famous for its breathtaking views and outdoor sports, it offers both skiing in winter and hiking in summer. Great for nature lovers and adventure seekers. | Paganella Ski Area, Hiking trails, Natural parks, Scenic viewpoints, Local cuisine |
| Drena | A small village close to Lake Garda, ideal for guests looking to explore the lakes and outdoor activities such as climbing and hiking. It is less crowded and has a charm of its own. | Drena Castle, Climbing spots, Lake Garda, Hiking trails, Peaceful village atmosphere |
| Canazei | Located in the heart of the Dolomites, Canazei is a hotspot for skiing and mountain tourism. It offers a range of amenities for tourists and easy access to stunning mountain landscapes. | Sella Ronda ski circuit, DolomitiSuperski, Hiking trails, Lago di Fedaia, Local restaurants |
| Riva del Garda | A picturesque town at the northern tip of Lake Garda, known for its stunning views and vibrant culture. Ideal for both relaxation and water sports enthusiasts. | Lake Garda, Rocca di Riva, Piazza 3 Novembre, Water sports activities, Scenic trails |
| Torbole | A famous windsurfing and sailing destination on Lake Garda, attracting water sports enthusiasts and those looking for an active holiday. | Lake Garda, Wind and water sports, Nago-Torbole hiking paths, Vibrant nightlife, Beaches |
| Trento | The capital of Trentino, featuring rich history, culture, and architecture. It attracts visitors interested in urban tourism, history, and local cuisine. | Trento Cathedral, Buonconsiglio Castle, Muse - Science Museum, Piazza Duomo, Local wine tastings |
Understanding Airbnb License Requirements & STR Laws in Vallelaghi (2025)
Yes, Vallelaghi, Trentino – Alto Adige/Südtirol, Italy enforces high STR regulations. Obtaining a license and ensuring compliance is almost certainly required according to current 2025 STR laws. Always verify the latest short term rental regulations and Airbnb license requirements directly with local government authorities for Vallelaghi to ensure full compliance before hosting.
(Source: AirROI data, 2025, based on 78% licensed listings)
Top Performing Airbnb Properties in Vallelaghi (2025)
Benchmark your potential! Explore examples of top-performing Airbnb properties in Vallelaghibased on Trailing Twelve Month (TTM) revenue. Analyze their characteristics, revenue, occupancy rate, and ADR to understand what drives success in this market.
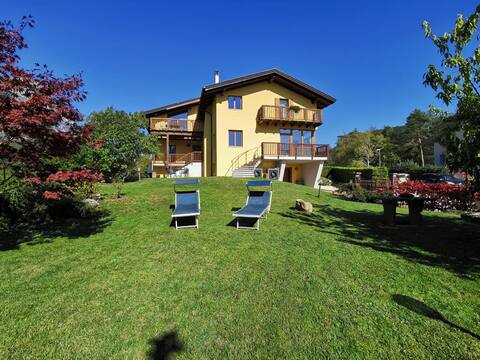
Villa Willie
Entire Place • 3 bedrooms
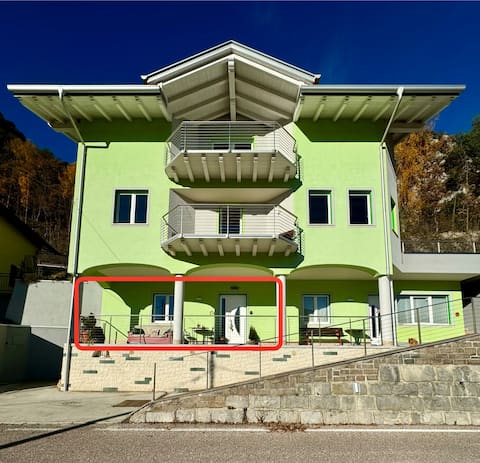
Villa Zoe - Suite with Sauna
Private Room • 1 bedroom
Casetta Zoe
Entire Place • 1 bedroom
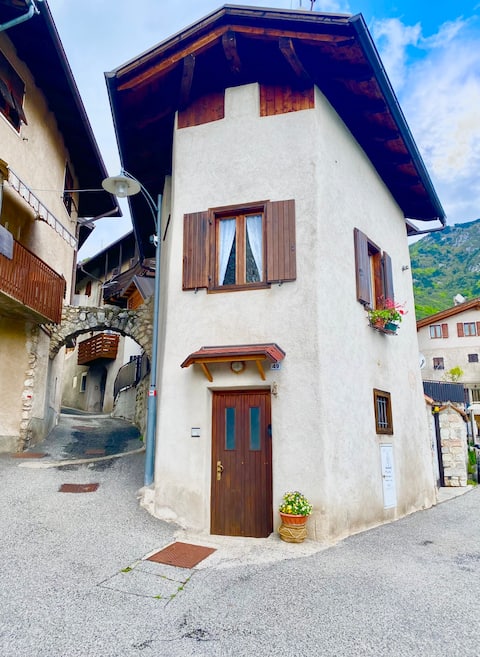
mi casa es tu casa
Entire Place • 3 bedrooms
Sanvili_casavacanze A vacation in the mountains
Entire Place • 2 bedrooms

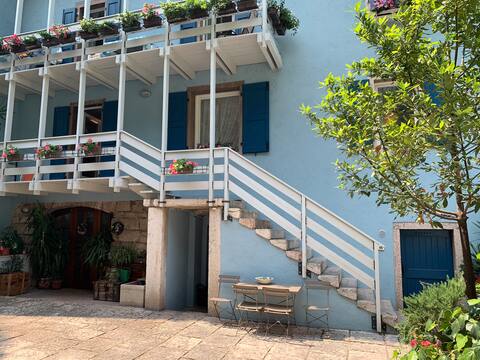
Villa ARCA - in the heart of Valle dei Laghi
Entire Place • 2 bedrooms
Note: Performance varies based on location, size, amenities, seasonality, and management quality. Data reflects the past 12 months.
Top Performing Airbnb Hosts in Vallelaghi (2025)
Learn from the best! This table showcases top-performing Airbnb hosts in Vallelaghi based on the number of properties managed and estimated total revenue over the past year. Analyze their scale and performance metrics.
| Host Name | Properties | Grossing Revenue | Stay Reviews | Avg Rating |
|---|---|---|---|---|
| Mattia | 2 | $44,303 | 60 | 4.92/5.0 |
| Marco | 3 | $29,224 | 61 | 4.84/5.0 |
| Emanuela | 1 | $27,874 | 29 | 4.93/5.0 |
| Host #51884692 | 1 | $20,355 | 0 | 0.00/5.0 |
| Sonia | 1 | $19,083 | 66 | 4.74/5.0 |
| Roberta | 1 | $15,429 | 65 | 4.98/5.0 |
| Karin | 1 | $14,090 | 11 | 5.00/5.0 |
| Host #159971190 | 1 | $14,088 | 1 | 0.00/5.0 |
| Maria Roberta | 1 | $13,976 | 56 | 4.82/5.0 |
| Giorgia | 1 | $13,912 | 71 | 4.97/5.0 |
Analyzing the strategies of top hosts, such as their property selection, pricing, and guest communication, can offer valuable lessons for optimizing your own Airbnb operations in Vallelaghi.
Dive Deeper: Advanced Vallelaghi STR Market Data (2025)
Ready to unlock more insights? AirROI provides access to advanced metrics and comprehensive Airbnb data for Vallelaghi. Explore detailed analytics beyond this report to refine your investment strategy, optimize pricing, and maximize your vacation rental profits.
Explore Advanced MetricsVallelaghi Short-Term Rental Market Composition (2025): Property & Room Types
Room Type Distribution
Property Type Distribution
Market Composition Insights for Vallelaghi
- The Vallelaghi Airbnb market composition is heavily skewed towards Entire Home/Apt listings, which make up 95.7% of the 23 active rentals. This indicates strong guest preference for privacy and space.
- Looking at the property type distribution in Vallelaghi, Apartment/Condo properties are the most common (69.6%), reflecting the local real estate landscape.
- Houses represent a significant 26.1% portion, catering likely to families or larger groups.
- Smaller segments like others (combined 4.3%) offer potential for unique stay experiences.
Vallelaghi Airbnb Room Capacity Analysis (2025): Bedroom Distribution
Distribution of Listings by Number of Bedrooms
Room Capacity Insights for Vallelaghi
- The dominant room capacity in Vallelaghi is 1 bedroom listings, making up 52.2% of the market. This suggests a strong demand for properties suitable for couples or solo travelers.
- Together, 1 bedroom and 2 bedrooms properties represent 91.3% of the active Airbnb listings in Vallelaghi, indicating a high concentration in these sizes.
- With over half the market (52.2%) consisting of studios or 1-bedroom units, Vallelaghi is particularly well-suited for individuals or couples.
- Listings with 3+ bedrooms (8.7%) represent a smaller niche, potentially indicating an underserved market for larger group accommodations in Vallelaghi.
Vallelaghi Vacation Rental Guest Capacity Trends (2025)
Distribution of Listings by Guest Capacity
Guest Capacity Insights for Vallelaghi
- The most common guest capacity trend in Vallelaghi vacation rentals is listings accommodating 4 guests (39.1%). This suggests the primary traveler segment is likely small families or groups.
- Properties designed for 4 guests and 3 guests dominate the Vallelaghi STR market, accounting for 60.8% of listings.
- 13.0% of properties accommodate 6+ guests, serving the market segment for larger families or group travel in Vallelaghi.
- On average, properties in Vallelaghi are equipped to host 4.1 guests.
Vallelaghi Airbnb Booking Patterns (2025): Available vs. Booked Days
Available Days Distribution
Booked Days Distribution
Booking Pattern Insights for Vallelaghi
- The most common availability pattern in Vallelaghi falls within the 181-270 days range, representing 43.5% of listings. This suggests many properties have significant open periods on their calendars.
- Approximately 82.6% of listings show high availability (181+ days open annually), indicating potential for increased bookings or specific owner usage patterns.
- For booked days, the 91-180 days range is most frequent in Vallelaghi (47.8%), reflecting common guest stay durations or potential owner blocking patterns.
- A notable 17.4% of properties secure long booking periods (181+ days booked per year), highlighting successful long-term rental strategies or significant owner usage.
Vallelaghi Airbnb Minimum Stay Requirements Analysis
Distribution of Listings by Minimum Night Requirement
1 Night
3 listings
15% of total
2 Nights
9 listings
45% of total
3 Nights
4 listings
20% of total
4-6 Nights
1 listings
5% of total
30+ Nights
3 listings
15% of total
Key Insights
- The most prevalent minimum stay requirement in Vallelaghi is 2 Nights, adopted by 45% of listings. This highlights the market's preference for shorter, flexible bookings.
- A significant segment (15%) caters to monthly stays (30+ nights) in Vallelaghi, pointing to opportunities in the extended-stay market.
Recommendations
- Align with the market by considering a 2 Nights minimum stay, as 45% of Vallelaghi hosts use this setting.
- If feasible, allowing 1-night stays, especially midweek or during low season, could capture last-minute bookings, as only 15% currently do.
- A 2-night minimum appears standard (45%). Consider this for weekends or peak periods.
- Explore offering discounts for stays of 30+ nights to attract the 15% of the market seeking extended stays.
- Adjust minimum nights based on seasonality – potentially shorter during low season and longer during peak demand periods in Vallelaghi.
Vallelaghi Airbnb Cancellation Policy Trends Analysis (2025)
Flexible
4 listings
21.1% of total
Moderate
13 listings
68.4% of total
Strict
2 listings
10.5% of total
Cancellation Policy Insights for Vallelaghi
- The prevailing Airbnb cancellation policy trend in Vallelaghi is Moderate, used by 68.4% of listings.
- The market strongly favors guest-friendly terms, with 89.5% of listings offering Flexible or Moderate policies. This suggests guests in Vallelaghi may expect booking flexibility.
Recommendations for Hosts
- Consider adopting a Moderate policy to align with the 68.4% market standard in Vallelaghi.
- Using a Strict policy might deter some guests, as only 10.5% of listings use it. Evaluate if potential revenue protection outweighs possible lower booking rates.
- Regularly review your cancellation policy against competitors and market demand shifts in Vallelaghi.
Vallelaghi STR Booking Lead Time Analysis (2025)
Average Booking Lead Time by Month
Booking Lead Time Insights for Vallelaghi
- The overall average booking lead time for vacation rentals in Vallelaghi is 40 days.
- Guests book furthest in advance for stays during July (average 93 days), likely coinciding with peak travel demand or local events.
- The shortest booking windows occur for stays in March (average 24 days), indicating more last-minute travel plans during this time.
- Seasonally, Summer (81 days avg.) sees the longest lead times, while Winter (30 days avg.) has the shortest, reflecting typical travel planning cycles.
Recommendations for Hosts
- Use the overall average lead time (40 days) as a baseline for your pricing and availability strategy in Vallelaghi.
- For July stays, consider implementing length-of-stay discounts or slightly higher rates for bookings made less than 93 days out to capitalize on advance planning.
- Target marketing efforts for the Summer season well in advance (at least 81 days) to capture early planners.
- Monitor your own booking lead times against these Vallelaghi averages to identify opportunities for dynamic pricing adjustments.
Popular & Essential Airbnb Amenities in Vallelaghi (2025)
Amenity Prevalence
Amenity Insights for Vallelaghi
- Essential amenities in Vallelaghi that guests expect include: Kitchen, Cooking basics, TV, Hot water. Lacking these (any) could significantly impact bookings.
- Popular amenities like Dishes and silverware, Free parking on premises, Wifi are common but not universal. Offering these can provide a competitive edge.
- Warning: Wifi is not universally provided but is considered essential globally. Ensure reliable Wifi is offered.
Recommendations for Hosts
- Ensure your listing includes all essential amenities for Vallelaghi: Kitchen, Cooking basics, TV, Hot water.
- Prioritize adding missing essentials: Cooking basics, TV, Hot water.
- Consider adding popular differentiators like Dishes and silverware or Free parking on premises to increase appeal.
- Highlight unique or less common amenities you offer (e.g., hot tub, dedicated workspace, EV charger) in your listing description and photos.
- Regularly check competitor amenities in Vallelaghi to stay competitive.
Vallelaghi Airbnb Guest Demographics & Profile Analysis (2025)
Guest Profile Summary for Vallelaghi
- The typical guest profile for Airbnb in Vallelaghi consists of a mix of domestic (41%) and international guests, with top international origins including Germany, typically belonging to the Post-2000s (Gen Z/Alpha) group (50%), primarily speaking English or Italian.
- Domestic travelers account for 41.0% of guests.
- Key international markets include Italy (41%) and Germany (23.8%).
- Top languages spoken are English (35.6%) followed by Italian (17.8%).
- A significant demographic segment is the Post-2000s (Gen Z/Alpha) group, representing 50% of guests.
Recommendations for Hosts
- Balance marketing efforts between domestic and international channels based on the guest mix.
- Tailor amenities and listing descriptions to appeal to the dominant Post-2000s (Gen Z/Alpha) demographic (e.g., highlight fast WiFi, smart home features, local guides).
- Highlight unique local experiences or amenities relevant to the primary guest profile.
- Consider seasonal promotions aligned with peak travel times for key origin markets.
Nearby Short-Term Rental Market Comparison
How does the Vallelaghi Airbnb market stack up against its neighbors? Compare key performance metrics like average monthly revenue, ADR, and occupancy rates in surrounding areas to understand the broader regional STR landscape.
| Market | Active Properties | Monthly Revenue | Daily Rate | Avg. Occupancy |
|---|---|---|---|---|
| Bayrischzell | 30 | $4,718 | $392.87 | 42% |
| Urtijëi - St. Ulrich in Gröden - Ortisei | 163 | $4,698 | $630.45 | 40% |
| Moos in Passeier - Moso in Passiria | 17 | $4,619 | $547.60 | 27% |
| Steinberg am Rofan | 11 | $4,394 | $311.71 | 40% |
| Brenzone sul Garda | 19 | $4,128 | $335.25 | 52% |
| Reith bei Kitzbühel | 44 | $3,766 | $308.69 | 45% |
| Pfafflar | 10 | $3,559 | $263.32 | 58% |
| Cortina d'Ampezzo | 265 | $3,522 | $379.53 | 43% |
| Venice | 6,405 | $3,454 | $238.80 | 53% |
| Wiesing | 16 | $3,222 | $208.10 | 52% |